Deck 23: Cost Estimation and Cost Behaviour
Full screen (f)
Question
Greene Enterprises has the following information about its truck fleet miles and operating costs: 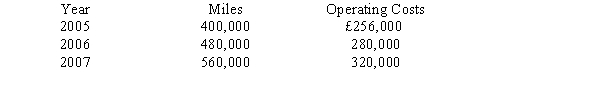 What is the best estimate of total costs using the high-low method if the expected fleet mileage for 2008 is 500,000 miles?
A) £288,000
B) £296,000
C) £256,000
D) £320,000
What is the best estimate of total costs using the high-low method if the expected fleet mileage for 2008 is 500,000 miles?A) £288,000
B) £296,000
C) £256,000
D) £320,000
Question
Figure 23-1
Lee Ltd. manufactures and sells party items. The following representative direct labour hours and production costs are provided for a four-month period: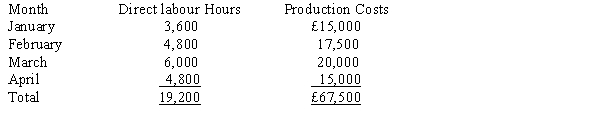 Let
Let
a
=
Fixed production costs per month
b
=
Variable production costs per direct labour hour
n
=
Number of months
X
=
Direct labour hours per month
Y
=
Total monthly production costs
=
Summation
-Refer to Figure 23-1. The cost function derived by the least-squares cost estimation method
A) is linear.
B) must be tested for minima and maxima.
C) is parabolic.
D) is quadratic.
Lee Ltd. manufactures and sells party items. The following representative direct labour hours and production costs are provided for a four-month period:
Leta
=
Fixed production costs per month
b
=
Variable production costs per direct labour hour
n
=
Number of months
X
=
Direct labour hours per month
Y
=
Total monthly production costs
=
Summation
-Refer to Figure 23-1. The cost function derived by the least-squares cost estimation method
A) is linear.
B) must be tested for minima and maxima.
C) is parabolic.
D) is quadratic.
Question
Question
The following information was available about supplies cost for the second quarter of the year:  Using the high-low method, the estimate of supplies cost at 1,000 units of production is
A) £2,700.
B) £4,460.
C) £4,900.
D) £7,100.
Using the high-low method, the estimate of supplies cost at 1,000 units of production isA) £2,700.
B) £4,460.
C) £4,900.
D) £7,100.
Question
Question
Hook Company wants to develop a cost estimating equation for its monthly cost of electricity. It has the following data:  Using the high-low method, which of the following is the best equation?
A) Y = £900 + £12.00X
B) Y = £900 + £8.40X
C) Y = £1,800 + £8.40X
D) Y = £2,400 + £8.40X
Using the high-low method, which of the following is the best equation?A) Y = £900 + £12.00X
B) Y = £900 + £8.40X
C) Y = £1,800 + £8.40X
D) Y = £2,400 + £8.40X
Question
Question
Question
Question
Question
Assume the following information: 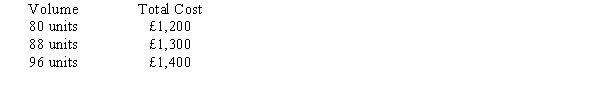 What is the variable cost per unit?
A) £15.00
B) £14.78
C) £13.75
D) £12.50
What is the variable cost per unit?A) £15.00
B) £14.78
C) £13.75
D) £12.50
Question
Question
The following information is available for electricity costs for the last six months of the year:  Using the high-low method, estimated variable cost per unit of production is
A) £1.26.
B) £1.53.
C) £1.65.
D) £1.77.
Using the high-low method, estimated variable cost per unit of production isA) £1.26.
B) £1.53.
C) £1.65.
D) £1.77.
Question
Question
Question
Figure 23-1
Lee Ltd. manufactures and sells party items. The following representative direct labour hours and production costs are provided for a four-month period: Let
a
=
Fixed production costs per month
b
=
Variable production costs per direct labour hour
n
=
Number of months
X
=
Direct labour hours per month
Y
=
Total monthly production costs
=
Summation
-Refer to Figure 23-1. Monthly production costs can be expressed as follows:
A) X = aY + b
B) Y = a + bX
C) X = a + bY
D) Y = b + aX
Lee Ltd. manufactures and sells party items. The following representative direct labour hours and production costs are provided for a four-month period:
Leta
=
Fixed production costs per month
b
=
Variable production costs per direct labour hour
n
=
Number of months
X
=
Direct labour hours per month
Y
=
Total monthly production costs
=
Summation
-Refer to Figure 23-1. Monthly production costs can be expressed as follows:
A) X = aY + b
B) Y = a + bX
C) X = a + bY
D) Y = b + aX
Question
Question
Question
Kane Ltd. found its maintenance cost and sales revenues to be somewhat correlated. Last year's high and low observations were as follows: 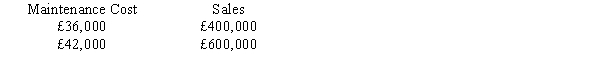 What is the fixed portion of the maintenance cost?
A) £24,000
B) £42,000
C) £30,000
D) £12,000
What is the fixed portion of the maintenance cost?A) £24,000
B) £42,000
C) £30,000
D) £12,000
Question
Question
Question
Question
The following computer printout estimated overhead costs using multiple regression: 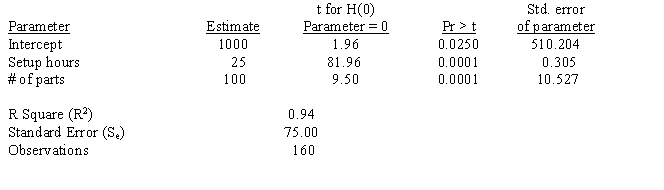 Which slope and intercept parameters are significant at the 0.05 level?
A) intercept
B) setup hours
C) number of parts
D) All of the above are significant
Which slope and intercept parameters are significant at the 0.05 level?A) intercept
B) setup hours
C) number of parts
D) All of the above are significant
Question
Question
Question
Question
Question
Question
Question
The following computer printout estimated overhead costs using multiple regression:  The model being measured is
A) Overhead = 1,000 + 25(Setup hours) + 100(# of parts).
B) Overhead = 510 + 0.305(Setup hours) + 10.527(# of parts).
C) Overhead = 0.98 + 40.98(Setup hours) + 4.865(# of parts).
D) Overhead = 1,000 + 25(Setup hours).
The model being measured isA) Overhead = 1,000 + 25(Setup hours) + 100(# of parts).
B) Overhead = 510 + 0.305(Setup hours) + 10.527(# of parts).
C) Overhead = 0.98 + 40.98(Setup hours) + 4.865(# of parts).
D) Overhead = 1,000 + 25(Setup hours).
Question
The following computer printout estimated overhead costs using linear regression: 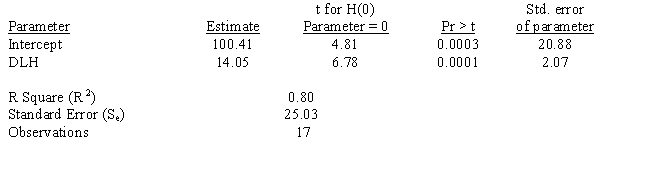 Table of Selected Values: t Distribution
 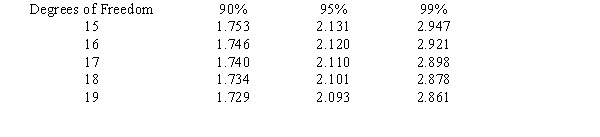 What is the interval around Y if 95 percent confidence is desired?
A) Y ± 20.024
B) Y ± 43.87759
C) Y ± 52.8133
D) Y ± 53.33893
Table of Selected Values: t Distribution What is the interval around Y if 95 percent confidence is desired?A) Y ± 20.024
B) Y ± 43.87759
C) Y ± 52.8133
D) Y ± 53.33893
Question
Question
Question
Question
The following computer printout estimated overhead costs using regression: 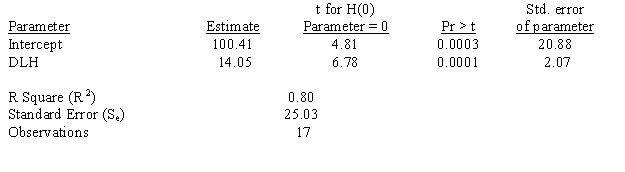 What is the 95 percent confidence interval around the slope estimate?
A) 11.98 to 16.13
B) 10.67 to 17.45
C) 9.57 to 18.54
D) 9.63 to 18.48
What is the 95 percent confidence interval around the slope estimate?A) 11.98 to 16.13
B) 10.67 to 17.45
C) 9.57 to 18.54
D) 9.63 to 18.48
Question
Question
Question
The following information was taken from a computer printout generated with the least-squares method for use in estimating overhead costs: 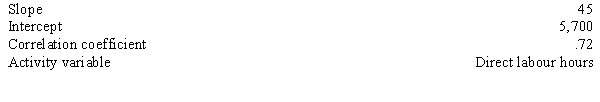 The cost formula is
A) Overhead = £5,700 - £45X.
B) Overhead = £5,700 + £45X.
C) Overhead = £5,700 + (£45* 0.72).
D) Overhead = £5,700 * 0.72.
The cost formula isA) Overhead = £5,700 - £45X.
B) Overhead = £5,700 + £45X.
C) Overhead = £5,700 + (£45* 0.72).
D) Overhead = £5,700 * 0.72.
Question
A managerial accountant has determined the following relationships between overhead and several possible bases: 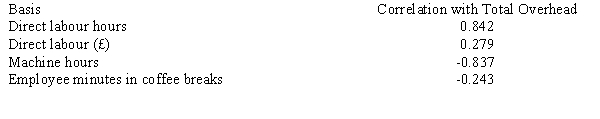 The best basis for overhead application is
A) direct labour hours.
B) coffee breaks.
C) direct labour (£)
D) machine hours.
The best basis for overhead application isA) direct labour hours.
B) coffee breaks.
C) direct labour (£)
D) machine hours.
Question
Question
Question
Question
Question
Question
Question
Question
Question
The following information was available about supplies cost for the first three months of the year: 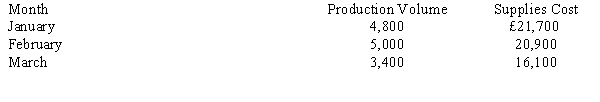 Using the high-low method, an estimate of supplies cost at 4,500 units of production would be
A) £19,400.
B) £20,500.
C) £19,950.
D) none of the above.
Using the high-low method, an estimate of supplies cost at 4,500 units of production would beA) £19,400.
B) £20,500.
C) £19,950.
D) none of the above.
Question
Question
Innova, SA., is beginning the production of a new product. Management believes that 500 labour hours will be required to complete the new unit. A 90 percent cumulative average-time learning curve model for direct labour hours is assumed to be valid. Data on costs are as follows: 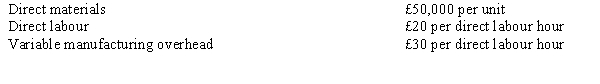 Required:
a.
Set up a table with columns for cumulative number of units, cumulative average time per unit in hours, and cumulative total time in hours using the cumulative average-time learning curve. Complete the table for 1, 2, 4, and 8 units.
b.
Set up a similar table assuming an 80 percent with the cumulative average-time learning curve.
c.
What is the difference in variable cost of producing four units?
Required: a.
Set up a table with columns for cumulative number of units, cumulative average time per unit in hours, and cumulative total time in hours using the cumulative average-time learning curve. Complete the table for 1, 2, 4, and 8 units.
b.
Set up a similar table assuming an 80 percent with the cumulative average-time learning curve.
c.
What is the difference in variable cost of producing four units?
Question
Question
Question
Question
Question
Question
Question
Question
Rush Company is trying to find an appropriate allocation base for factory overhead. Presented are five months of data: 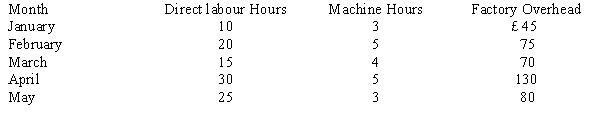 r =
r = 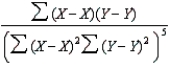 Required:
a.
Calculate the correlation coefficient between factory overhead and direct labour hours.
b.
Calculate the correlation coefficient between factory overhead and machine hours.
c.
Should Rush Company use direct labour hours or machine hours for their allocation base for factory overhead? Why?
r = Required: a.
Calculate the correlation coefficient between factory overhead and direct labour hours.
b.
Calculate the correlation coefficient between factory overhead and machine hours.
c.
Should Rush Company use direct labour hours or machine hours for their allocation base for factory overhead? Why?
Question
Question
The following cost functions were developed for manufacturing overhead costs: 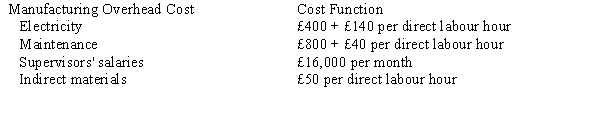 If July production is expected to be 200 units that require 300 direct labour hours, estimated manufacturing overhead costs would be
A) £17,430.
B) £55,200.
C) £63,200.
D) £86,200.
If July production is expected to be 200 units that require 300 direct labour hours, estimated manufacturing overhead costs would beA) £17,430.
B) £55,200.
C) £63,200.
D) £86,200.
Question
Innova, SA., is beginning the production of a new product. Management believes that 500 labour hours will be required to complete the new unit. An 80 percent incremental unit-time learning curve model for direct labour hours is assumed to be valid. Assume that the exponent b = -0.3219. Data on costs are as follows: 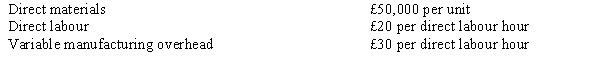 Required:
a.
Set up a table with columns for cumulative number of units showing the cumulative total time in hours using the incremental unit-time learning curve. Complete the table for 1, 2, 3, and 4 units given the individual unit time for the nth unit as 500, 400, 351, and 320 for 1 to 4 units respectively.
b.
Set up a similar table assuming a 90 percent with the incremental unit-time learning curve with the individual unit time for the nth unit as 500, 450, 430, 405 for 1 to 4 units respectively.
c.
What is the difference in variable cost of producing four units?
Required: a.
Set up a table with columns for cumulative number of units showing the cumulative total time in hours using the incremental unit-time learning curve. Complete the table for 1, 2, 3, and 4 units given the individual unit time for the nth unit as 500, 400, 351, and 320 for 1 to 4 units respectively.
b.
Set up a similar table assuming a 90 percent with the incremental unit-time learning curve with the individual unit time for the nth unit as 500, 450, 430, 405 for 1 to 4 units respectively.
c.
What is the difference in variable cost of producing four units?
Question
Question
SeyChy collected the following data on manufacturing costs and activity cost drivers for two months: 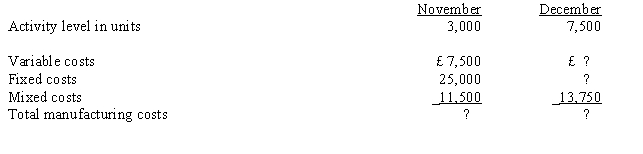 Required:
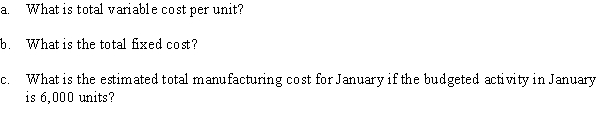
Required: 
Unlock Deck
Sign up to unlock the cards in this deck!
Unlock Deck
Unlock Deck
1/63
Play
Full screen (f)
Deck 23: Cost Estimation and Cost Behaviour
1
Greene Enterprises has the following information about its truck fleet miles and operating costs: What is the best estimate of total costs using the high-low method if the expected fleet mileage for 2008 is 500,000 miles?
A) £288,000
B) £296,000
C) £256,000
D) £320,000
What is the best estimate of total costs using the high-low method if the expected fleet mileage for 2008 is 500,000 miles?A) £288,000
B) £296,000
C) £256,000
D) £320,000
B
2
Figure 23-1
Lee Ltd. manufactures and sells party items. The following representative direct labour hours and production costs are provided for a four-month period: Let
a
=
Fixed production costs per month
b
=
Variable production costs per direct labour hour
n
=
Number of months
X
=
Direct labour hours per month
Y
=
Total monthly production costs
=
Summation
-Refer to Figure 23-1. The cost function derived by the least-squares cost estimation method
A) is linear.
B) must be tested for minima and maxima.
C) is parabolic.
D) is quadratic.
Lee Ltd. manufactures and sells party items. The following representative direct labour hours and production costs are provided for a four-month period:
Leta
=
Fixed production costs per month
b
=
Variable production costs per direct labour hour
n
=
Number of months
X
=
Direct labour hours per month
Y
=
Total monthly production costs
=
Summation
-Refer to Figure 23-1. The cost function derived by the least-squares cost estimation method
A) is linear.
B) must be tested for minima and maxima.
C) is parabolic.
D) is quadratic.
is linear.
3
The scatterplot method of cost estimation
A) is influenced by extreme observations.
B) requires the use of judgment.
C) uses the least-squares method.
D) is superior to other methods in its ability to distinguish between discretionary and committed fixed costs.
A) is influenced by extreme observations.
B) requires the use of judgment.
C) uses the least-squares method.
D) is superior to other methods in its ability to distinguish between discretionary and committed fixed costs.
B
4
The following information was available about supplies cost for the second quarter of the year: Using the high-low method, the estimate of supplies cost at 1,000 units of production is
A) £2,700.
B) £4,460.
C) £4,900.
D) £7,100.
Using the high-low method, the estimate of supplies cost at 1,000 units of production isA) £2,700.
B) £4,460.
C) £4,900.
D) £7,100.
Unlock Deck
Unlock for access to all 63 flashcards in this deck.
Unlock Deck
k this deck
5
Advantages of the method of least squares over the high-low method include all of the following EXCEPT
A) a statistical method is used to mathematically derive the cost function.
B) only two points are used to develop the cost function.
C) the squared differences between actual observations and the line (cost function) are minimized.
D) all the observations have an effect on the cost function.
A) a statistical method is used to mathematically derive the cost function.
B) only two points are used to develop the cost function.
C) the squared differences between actual observations and the line (cost function) are minimized.
D) all the observations have an effect on the cost function.
Unlock Deck
Unlock for access to all 63 flashcards in this deck.
Unlock Deck
k this deck
6
Hook Company wants to develop a cost estimating equation for its monthly cost of electricity. It has the following data: Using the high-low method, which of the following is the best equation?
A) Y = £900 + £12.00X
B) Y = £900 + £8.40X
C) Y = £1,800 + £8.40X
D) Y = £2,400 + £8.40X
Using the high-low method, which of the following is the best equation?A) Y = £900 + £12.00X
B) Y = £900 + £8.40X
C) Y = £1,800 + £8.40X
D) Y = £2,400 + £8.40X
Unlock Deck
Unlock for access to all 63 flashcards in this deck.
Unlock Deck
k this deck
7
In the formula Y = a + bx, b refers to the
A) slope.
B) intercept.
C) dependent variable.
D) total variable costs.
A) slope.
B) intercept.
C) dependent variable.
D) total variable costs.
Unlock Deck
Unlock for access to all 63 flashcards in this deck.
Unlock Deck
k this deck
8
In the formula Y = a + bx, x refers to the
A) slope.
B) intercept.
C) dependent variable.
D) independent variable.
A) slope.
B) intercept.
C) dependent variable.
D) independent variable.
Unlock Deck
Unlock for access to all 63 flashcards in this deck.
Unlock Deck
k this deck
9
In the formula Y = a + bx, a refers to the
A) slope.
B) intercept.
C) dependent variable.
D) independent variable.
A) slope.
B) intercept.
C) dependent variable.
D) independent variable.
Unlock Deck
Unlock for access to all 63 flashcards in this deck.
Unlock Deck
k this deck
10
In the formula Y = a + bx, bx refers to the
A) total variable costs.
B) intercept.
C) dependent variable.
D) independent variable.
A) total variable costs.
B) intercept.
C) dependent variable.
D) independent variable.
Unlock Deck
Unlock for access to all 63 flashcards in this deck.
Unlock Deck
k this deck
11
Assume the following information: What is the variable cost per unit?
A) £15.00
B) £14.78
C) £13.75
D) £12.50
What is the variable cost per unit?A) £15.00
B) £14.78
C) £13.75
D) £12.50
Unlock Deck
Unlock for access to all 63 flashcards in this deck.
Unlock Deck
k this deck
12
Weaknesses of the high-low method include all of the following EXCEPT
A) only two observations are used to develop the cost function.
B) the high and low activity levels may not be representative.
C) the method does not detect if the cost behaviour is nonlinear.
D) the method is relatively complex and difficult to apply.
A) only two observations are used to develop the cost function.
B) the high and low activity levels may not be representative.
C) the method does not detect if the cost behaviour is nonlinear.
D) the method is relatively complex and difficult to apply.
Unlock Deck
Unlock for access to all 63 flashcards in this deck.
Unlock Deck
k this deck
13
The following information is available for electricity costs for the last six months of the year: Using the high-low method, estimated variable cost per unit of production is
A) £1.26.
B) £1.53.
C) £1.65.
D) £1.77.
Using the high-low method, estimated variable cost per unit of production isA) £1.26.
B) £1.53.
C) £1.65.
D) £1.77.
Unlock Deck
Unlock for access to all 63 flashcards in this deck.
Unlock Deck
k this deck
14
The high-low method may give unsatisfactory results if
A) the data points all fall on a line.
B) volume of activity is heavy.
C) volume of activity is light.
D) the points are unrepresentative.
A) the data points all fall on a line.
B) volume of activity is heavy.
C) volume of activity is light.
D) the points are unrepresentative.
Unlock Deck
Unlock for access to all 63 flashcards in this deck.
Unlock Deck
k this deck
15
Baker Enterprises developed a cost function for manufacturing overhead costs of Y = £8,000 + £1.60X. Estimated manufacturing overhead costs at 10,000 units of production are
A) £16,000.
B) £17,600.
C) £24,000.
D) £26,000.
A) £16,000.
B) £17,600.
C) £24,000.
D) £26,000.
Unlock Deck
Unlock for access to all 63 flashcards in this deck.
Unlock Deck
k this deck
16
Figure 23-1
Lee Ltd. manufactures and sells party items. The following representative direct labour hours and production costs are provided for a four-month period: Let
a
=
Fixed production costs per month
b
=
Variable production costs per direct labour hour
n
=
Number of months
X
=
Direct labour hours per month
Y
=
Total monthly production costs
=
Summation
-Refer to Figure 23-1. Monthly production costs can be expressed as follows:
A) X = aY + b
B) Y = a + bX
C) X = a + bY
D) Y = b + aX
Lee Ltd. manufactures and sells party items. The following representative direct labour hours and production costs are provided for a four-month period:
Leta
=
Fixed production costs per month
b
=
Variable production costs per direct labour hour
n
=
Number of months
X
=
Direct labour hours per month
Y
=
Total monthly production costs
=
Summation
-Refer to Figure 23-1. Monthly production costs can be expressed as follows:
A) X = aY + b
B) Y = a + bX
C) X = a + bY
D) Y = b + aX
Unlock Deck
Unlock for access to all 63 flashcards in this deck.
Unlock Deck
k this deck
17
Which of the following decision-making tools would NOT be useful in determining the slope and intercept of a mixed cost?
A) linear programming
B) least-squares method
C) high-low method
D) scatter diagrams
A) linear programming
B) least-squares method
C) high-low method
D) scatter diagrams
Unlock Deck
Unlock for access to all 63 flashcards in this deck.
Unlock Deck
k this deck
18
In the formula Y = a + bx, Y refers to the
A) slope.
B) intercept.
C) dependent variable.
D) independent variable.
A) slope.
B) intercept.
C) dependent variable.
D) independent variable.
Unlock Deck
Unlock for access to all 63 flashcards in this deck.
Unlock Deck
k this deck
19
Kane Ltd. found its maintenance cost and sales revenues to be somewhat correlated. Last year's high and low observations were as follows: What is the fixed portion of the maintenance cost?
A) £24,000
B) £42,000
C) £30,000
D) £12,000
What is the fixed portion of the maintenance cost?A) £24,000
B) £42,000
C) £30,000
D) £12,000
Unlock Deck
Unlock for access to all 63 flashcards in this deck.
Unlock Deck
k this deck
20
English Ltd. analyzed the relationship between total factory overhead and changes in direct labour hours. It found the following: Y = £6,000 + £6X
The Y in the equation is an estimate of
A) total variable costs.
B) total direct labour hours.
C) total factory overhead.
D) total fixed costs.
The Y in the equation is an estimate of
A) total variable costs.
B) total direct labour hours.
C) total factory overhead.
D) total fixed costs.
Unlock Deck
Unlock for access to all 63 flashcards in this deck.
Unlock Deck
k this deck
21
The appropriate range for the coefficient of correlation (r) is
A) 0 r 1.
B) -% r +%.
C) -1 r 1.
D) -1 r +%.
A) 0 r 1.
B) -% r +%.
C) -1 r 1.
D) -1 r +%.
Unlock Deck
Unlock for access to all 63 flashcards in this deck.
Unlock Deck
k this deck
22
Which of the following statements is TRUE about the learning curve?
A) The curve decreases at an increasing rate.
B) The learning effect will eventually disappear as the number of units produced increases.
C) Failure to recognize learning curve effects will cause units produced later in a new production process to receive less cost than they should.
D) All of the above are true.
Unlock Deck
Unlock for access to all 63 flashcards in this deck.
Unlock Deck
k this deck
23
The following computer printout estimated overhead costs using multiple regression: Which slope and intercept parameters are significant at the 0.05 level?
A) intercept
B) setup hours
C) number of parts
D) All of the above are significant
Which slope and intercept parameters are significant at the 0.05 level?A) intercept
B) setup hours
C) number of parts
D) All of the above are significant
Unlock Deck
Unlock for access to all 63 flashcards in this deck.
Unlock Deck
k this deck
24
What is the difference between a correlation equal to -1 and a correlation equal to +1?
A) A correlation equal to -1 means two alternatives are moving in the same direction, whereas a correlation of +1 means they are moving in opposite directions.
B) A correlation equal to -1 means two alternatives are moving in the same direction, whereas a correlation of +1 means they are unrelated.
C) A correlation equal to -1 means two alternatives are moving in opposite directions, whereas a correlation of +1 means they are moving in the same direction.
D) A correlation equal to -1 means two alternatives are moving in opposite directions, whereas a correlation of +1 means they are unrelated.
Unlock Deck
Unlock for access to all 63 flashcards in this deck.
Unlock Deck
k this deck
25
A coefficient of determination of 0.91 means
A) the two variables move together in the same direction and have a strong relationship.
B) the parameter is not significant.
C) the model is significant 91 percent of the time.
D) that the independent variable explains 91 percent of the cost.
A) the two variables move together in the same direction and have a strong relationship.
B) the parameter is not significant.
C) the model is significant 91 percent of the time.
D) that the independent variable explains 91 percent of the cost.
Unlock Deck
Unlock for access to all 63 flashcards in this deck.
Unlock Deck
k this deck
26
What does a correlation coefficient near +1 mean?
A) Two variables are moving in the opposite direction.
B) Two variables are moving in the same direction.
C) Two variables are unrelated.
D) One variable is not a good predictor of the other.
A) Two variables are moving in the opposite direction.
B) Two variables are moving in the same direction.
C) Two variables are unrelated.
D) One variable is not a good predictor of the other.
Unlock Deck
Unlock for access to all 63 flashcards in this deck.
Unlock Deck
k this deck
27
Which of the following equations uses multiple regression?
A) Overhead = a + b(MH)
B) DL Costs = a + b(MH)
C) Overhead = a + b(DLH)
D) Overhead = a + b(DLH) + c(MH)
A) Overhead = a + b(MH)
B) DL Costs = a + b(MH)
C) Overhead = a + b(DLH)
D) Overhead = a + b(DLH) + c(MH)
Unlock Deck
Unlock for access to all 63 flashcards in this deck.
Unlock Deck
k this deck
28
What is the difference between a correlation equal to -1 and a correlation equal to 0?
A) A correlation equal to -1 means two alternatives are moving in the same direction, whereas a correlation of 0 means they are moving in opposite directions.
B) A correlation equal to -1 means two alternatives are moving in the same direction, whereas a correlation of 0 means they are unrelated.
C) A correlation equal to -1 means two alternatives are moving in opposite directions, whereas a correlation of 0 means they are moving in the same direction.
D) A correlation equal to -1 means two alternatives are moving in opposite directions, whereas a correlation of 0 means they are unrelated.
Unlock Deck
Unlock for access to all 63 flashcards in this deck.
Unlock Deck
k this deck
29
What does a correlation coefficient near 0 mean?
A) Two variables are moving in the opposite direction.
B) Two variables are moving in the same direction.
C) Two variables are unrelated.
D) One variable is a good predictor of the other.
A) Two variables are moving in the opposite direction.
B) Two variables are moving in the same direction.
C) Two variables are unrelated.
D) One variable is a good predictor of the other.
Unlock Deck
Unlock for access to all 63 flashcards in this deck.
Unlock Deck
k this deck
30
The following computer printout estimated overhead costs using multiple regression: The model being measured is
A) Overhead = 1,000 + 25(Setup hours) + 100(# of parts).
B) Overhead = 510 + 0.305(Setup hours) + 10.527(# of parts).
C) Overhead = 0.98 + 40.98(Setup hours) + 4.865(# of parts).
D) Overhead = 1,000 + 25(Setup hours).
The model being measured isA) Overhead = 1,000 + 25(Setup hours) + 100(# of parts).
B) Overhead = 510 + 0.305(Setup hours) + 10.527(# of parts).
C) Overhead = 0.98 + 40.98(Setup hours) + 4.865(# of parts).
D) Overhead = 1,000 + 25(Setup hours).
Unlock Deck
Unlock for access to all 63 flashcards in this deck.
Unlock Deck
k this deck
31
The following computer printout estimated overhead costs using linear regression: Table of Selected Values: t Distribution What is the interval around Y if 95 percent confidence is desired?
A) Y ± 20.024
B) Y ± 43.87759
C) Y ± 52.8133
D) Y ± 53.33893
Table of Selected Values: t Distribution What is the interval around Y if 95 percent confidence is desired?A) Y ± 20.024
B) Y ± 43.87759
C) Y ± 52.8133
D) Y ± 53.33893
Unlock Deck
Unlock for access to all 63 flashcards in this deck.
Unlock Deck
k this deck
32
Figure 23-3
Abboud Company is planning to introduce a new product with an 80 percent cumulative learning curve for production for batches of 1,000 units. The variable labour costs are £30 per unit for the first 1,000-unit batch. Each batch requires 100 hours. There are £10,000 in fixed costs not subject to learning.
Refer to Figure 23-3. What is the cumulative total time (labour hours) to produce 2,000 units?
A) 100 hours
B) 80 hours
C) 160 hours
D) 20 hours
Unlock Deck
Unlock for access to all 63 flashcards in this deck.
Unlock Deck
k this deck
33
What does a correlation coefficient near -1 mean?
A) Two variables are moving in the opposite direction.
B) Two variables are moving in the same direction.
C) Two variables are unrelated.
D) One variable is not a good predictor of the other.
A) Two variables are moving in the opposite direction.
B) Two variables are moving in the same direction.
C) Two variables are unrelated.
D) One variable is not a good predictor of the other.
Unlock Deck
Unlock for access to all 63 flashcards in this deck.
Unlock Deck
k this deck
34
Abboud Company is planning to introduce a new product with an 80 percent incremental unit-time learning curve for production for batches of 1,000 units. The variable labour costs are £30 per unit for the first 1,000-unit batch. Each batch requires 100 hours. There are £10,000 in fixed costs not subject to learning. What is the cumulative total time (labour hours) to produce 2,000 units?
A) 100 hours
B) 80 hours
C) 160 hours
D) 180 hours
A) 100 hours
B) 80 hours
C) 160 hours
D) 180 hours
Unlock Deck
Unlock for access to all 63 flashcards in this deck.
Unlock Deck
k this deck
35
The following computer printout estimated overhead costs using regression: What is the 95 percent confidence interval around the slope estimate?
A) 11.98 to 16.13
B) 10.67 to 17.45
C) 9.57 to 18.54
D) 9.63 to 18.48
What is the 95 percent confidence interval around the slope estimate?A) 11.98 to 16.13
B) 10.67 to 17.45
C) 9.57 to 18.54
D) 9.63 to 18.48
Unlock Deck
Unlock for access to all 63 flashcards in this deck.
Unlock Deck
k this deck
36
Which of the following statements is NOT true?
A) In selecting an independent variable for cost behaviour analysis, it is important to determine the activity that causes the cost being analyzed to occur.
B) Professional judgment is very important in selecting an activity measure for a particular cost.
C) A high correlation between two variables proves that one causes the other.
D) The least-squares cost estimation method can be used to measure the linear function.
Unlock Deck
Unlock for access to all 63 flashcards in this deck.
Unlock Deck
k this deck
37
In the method of least squares, the deviation is the difference between the
A) predicted and estimated costs.
B) predicted and average costs.
C) average and actual costs.
D) predicted and actual costs.
A) predicted and estimated costs.
B) predicted and average costs.
C) average and actual costs.
D) predicted and actual costs.
Unlock Deck
Unlock for access to all 63 flashcards in this deck.
Unlock Deck
k this deck
38
The following information was taken from a computer printout generated with the least-squares method for use in estimating overhead costs: The cost formula is
A) Overhead = £5,700 - £45X.
B) Overhead = £5,700 + £45X.
C) Overhead = £5,700 + (£45* 0.72).
D) Overhead = £5,700 * 0.72.
The cost formula isA) Overhead = £5,700 - £45X.
B) Overhead = £5,700 + £45X.
C) Overhead = £5,700 + (£45* 0.72).
D) Overhead = £5,700 * 0.72.
Unlock Deck
Unlock for access to all 63 flashcards in this deck.
Unlock Deck
k this deck
39
A managerial accountant has determined the following relationships between overhead and several possible bases: The best basis for overhead application is
A) direct labour hours.
B) coffee breaks.
C) direct labour (£)
D) machine hours.
The best basis for overhead application isA) direct labour hours.
B) coffee breaks.
C) direct labour (£)
D) machine hours.
Unlock Deck
Unlock for access to all 63 flashcards in this deck.
Unlock Deck
k this deck
40
The coefficient of determination is
A) a measure of the variability of actual costs around the cost-estimating equation.
B) used to construct probability intervals for cost estimates.
C) a standardized measure of the degree to which two variables move together.
D) a measure of the percent variation in the dependent variable that is explained by the cost estimating equation.
Unlock Deck
Unlock for access to all 63 flashcards in this deck.
Unlock Deck
k this deck
41
In a simple least-squares regression where X refers to the number of sales calls made by a sales department and Y refers to the monthly total cost of the sales department, the R-squared in the regression output would represent:
A) the estimated monthly total costs of the sales department.
B) the estimated monthly fixed costs of the sales department.
C) the estimated monthly variable costs per unit of the sales department.
D) the percent of variation in Y that is explained by X.
A) the estimated monthly total costs of the sales department.
B) the estimated monthly fixed costs of the sales department.
C) the estimated monthly variable costs per unit of the sales department.
D) the percent of variation in Y that is explained by X.
Unlock Deck
Unlock for access to all 63 flashcards in this deck.
Unlock Deck
k this deck
42
Figure 23-3
Abboud Company is planning to introduce a new product with an 80 percent cumulative learning curve for production for batches of 1,000 units. The variable labour costs are £30 per unit for the first 1,000-unit batch. Each batch requires 100 hours. There are £10,000 in fixed costs not subject to learning.
Refer to Figure 23-3. What is the individual unit time (labour hours) to produce 2,000 units?
A) 100 hours
B) 80 hours
C) 20 hours
D) 60 hours
Unlock Deck
Unlock for access to all 63 flashcards in this deck.
Unlock Deck
k this deck
43
Advantages of the method of least squares over the high-low method include all the following EXCEPT
A) a statistical method is used to mathematically derive the cost function.
B) only two points are used to develop the cost function.
C) the squared differences between actual observations and the line (cost function) are minimized.
D) all the observations have an effect on the cost function.
A) a statistical method is used to mathematically derive the cost function.
B) only two points are used to develop the cost function.
C) the squared differences between actual observations and the line (cost function) are minimized.
D) all the observations have an effect on the cost function.
Unlock Deck
Unlock for access to all 63 flashcards in this deck.
Unlock Deck
k this deck
44
Which of the following is a weakness of the high-low method?
A) The method is easy to apply because only two observations are required to develop the cost function.
B) The data points used may represent atypical cost-activity relationships.
C) Any two observers will arrive at the same conclusion.
D) The method is quick to use and easy to understand.
A) The method is easy to apply because only two observations are required to develop the cost function.
B) The data points used may represent atypical cost-activity relationships.
C) Any two observers will arrive at the same conclusion.
D) The method is quick to use and easy to understand.
Unlock Deck
Unlock for access to all 63 flashcards in this deck.
Unlock Deck
k this deck
45
In a simple least-squares regression where X refers to the number of sales calls made by a sales department and Y refers to the monthly total cost of the sales department, the constant in the regression output would represent:
A) the estimated monthly total costs of the sales department.
B) the estimated monthly fixed costs of the sales department.
C) the estimated monthly variable costs per unit of the sales department.
D) the percent of variation in Y that is explained by X.
A) the estimated monthly total costs of the sales department.
B) the estimated monthly fixed costs of the sales department.
C) the estimated monthly variable costs per unit of the sales department.
D) the percent of variation in Y that is explained by X.
Unlock Deck
Unlock for access to all 63 flashcards in this deck.
Unlock Deck
k this deck
46
Silversleeves, SA., shipped 18,000 tons of silver for £450,000 in January and 22,000 tons for £549,000 in February. Shipping costs for 21,000 tons to be shipped in March would be expected to be
A) £548,111.
B) £499,500.
C) £524,250.
D) none of the above.
A) £548,111.
B) £499,500.
C) £524,250.
D) none of the above.
Unlock Deck
Unlock for access to all 63 flashcards in this deck.
Unlock Deck
k this deck
47
Which of the following is a strength of the high-low advantage method?
A) Only two observations are used to develop the cost function.
B) The high and low activity levels may not be representative.
C) The method does not detect if the cost behaviour is nonlinear.
D) The method is easy to apply.
A) Only two observations are used to develop the cost function.
B) The high and low activity levels may not be representative.
C) The method does not detect if the cost behaviour is nonlinear.
D) The method is easy to apply.
Unlock Deck
Unlock for access to all 63 flashcards in this deck.
Unlock Deck
k this deck
48
The following information was available about supplies cost for the first three months of the year: Using the high-low method, an estimate of supplies cost at 4,500 units of production would be
A) £19,400.
B) £20,500.
C) £19,950.
D) none of the above.
Using the high-low method, an estimate of supplies cost at 4,500 units of production would beA) £19,400.
B) £20,500.
C) £19,950.
D) none of the above.
Unlock Deck
Unlock for access to all 63 flashcards in this deck.
Unlock Deck
k this deck
49
When the method of least squares is used to fit an equation involving two or more explanatory or independent variables, the method is called
A) simple regression.
B) multiple regression.
C) variable regression.
D) none of the above.
A) simple regression.
B) multiple regression.
C) variable regression.
D) none of the above.
Unlock Deck
Unlock for access to all 63 flashcards in this deck.
Unlock Deck
k this deck
50
Innova, SA., is beginning the production of a new product. Management believes that 500 labour hours will be required to complete the new unit. A 90 percent cumulative average-time learning curve model for direct labour hours is assumed to be valid. Data on costs are as follows: Required:
a.
Set up a table with columns for cumulative number of units, cumulative average time per unit in hours, and cumulative total time in hours using the cumulative average-time learning curve. Complete the table for 1, 2, 4, and 8 units.
b.
Set up a similar table assuming an 80 percent with the cumulative average-time learning curve.
c.
What is the difference in variable cost of producing four units?
Required: a.
Set up a table with columns for cumulative number of units, cumulative average time per unit in hours, and cumulative total time in hours using the cumulative average-time learning curve. Complete the table for 1, 2, 4, and 8 units.
b.
Set up a similar table assuming an 80 percent with the cumulative average-time learning curve.
c.
What is the difference in variable cost of producing four units?
Unlock Deck
Unlock for access to all 63 flashcards in this deck.
Unlock Deck
k this deck
51
Briefly discuss some of the areas of concern that make cost estimation and prediction difficult.
Unlock Deck
Unlock for access to all 63 flashcards in this deck.
Unlock Deck
k this deck
52
The percentage change in the dependent variable that is explained by the change in the independent variable is measured by the
A) intercept.
B) slope.
C) coefficient of determination.
D) correlation coefficient.
A) intercept.
B) slope.
C) coefficient of determination.
D) correlation coefficient.
Unlock Deck
Unlock for access to all 63 flashcards in this deck.
Unlock Deck
k this deck
53
If the coefficient of correlation between machine hours and utilities cost is equal to 0.98 (r = 0.98), the correlation is
A) positive.
B) negative.
C) not related.
D) none of the above.
A) positive.
B) negative.
C) not related.
D) none of the above.
Unlock Deck
Unlock for access to all 63 flashcards in this deck.
Unlock Deck
k this deck
54
Given the cost function, Y = £10,000 + £4X, at what level of the activity cost drivers will total cost be £22,000?
A) 3,000 units
B) 5,500 units
C) 10,000 units
D) 3,250 units
A) 3,000 units
B) 5,500 units
C) 10,000 units
D) 3,250 units
Unlock Deck
Unlock for access to all 63 flashcards in this deck.
Unlock Deck
k this deck
55
If the independent variable is production volume and the dependent variable is total manufacturing cost, a coefficient of determination of .90 indicates
A) 90 percent of the change in manufacturing cost can be explained by the change in the production volume.
B) 90 percent of the change in volume is caused by changes in manufacturing cost.
C) 10 percent of the change in volume is caused by changes in manufacturing cost.
D) costs will change by 90 percent of the change in volume.
Unlock Deck
Unlock for access to all 63 flashcards in this deck.
Unlock Deck
k this deck
56
____ is a measure of the percent of variation in the dependent variable (such as total cost) that is explained by variations in the independent variable (such as total shipments) when the least-squares estimation equation is used.
A) The constant
B) The standard error of Y estimate
C) The coefficient of determination
D) The standard error of X estimate
A) The constant
B) The standard error of Y estimate
C) The coefficient of determination
D) The standard error of X estimate
Unlock Deck
Unlock for access to all 63 flashcards in this deck.
Unlock Deck
k this deck
57
Which method can be used to estimate the cost function?
A) high-low method
B) scatterplot method
C) method of least squares
D) all of the above can be used to estimate the cost function
A) high-low method
B) scatterplot method
C) method of least squares
D) all of the above can be used to estimate the cost function
Unlock Deck
Unlock for access to all 63 flashcards in this deck.
Unlock Deck
k this deck
58
Rush Company is trying to find an appropriate allocation base for factory overhead. Presented are five months of data: r = Required:
a.
Calculate the correlation coefficient between factory overhead and direct labour hours.
b.
Calculate the correlation coefficient between factory overhead and machine hours.
c.
Should Rush Company use direct labour hours or machine hours for their allocation base for factory overhead? Why?
r = Required: a.
Calculate the correlation coefficient between factory overhead and direct labour hours.
b.
Calculate the correlation coefficient between factory overhead and machine hours.
c.
Should Rush Company use direct labour hours or machine hours for their allocation base for factory overhead? Why?
Unlock Deck
Unlock for access to all 63 flashcards in this deck.
Unlock Deck
k this deck
59
In a simple least-squares regression where X refers to the number of sales calls made by a sales department and Y refers to the monthly total cost of the sales department, the value of X in the regression output would represent:
A) the estimated monthly total costs of the sales department.
B) the estimated monthly fixed costs of the sales department.
C) the estimated monthly variable costs per unit of the sales department.
D) the percent of variation in Y that is explained by X.
A) the estimated monthly total costs of the sales department.
B) the estimated monthly fixed costs of the sales department.
C) the estimated monthly variable costs per unit of the sales department.
D) the percent of variation in Y that is explained by X.
Unlock Deck
Unlock for access to all 63 flashcards in this deck.
Unlock Deck
k this deck
60
The following cost functions were developed for manufacturing overhead costs: If July production is expected to be 200 units that require 300 direct labour hours, estimated manufacturing overhead costs would be
A) £17,430.
B) £55,200.
C) £63,200.
D) £86,200.
If July production is expected to be 200 units that require 300 direct labour hours, estimated manufacturing overhead costs would beA) £17,430.
B) £55,200.
C) £63,200.
D) £86,200.
Unlock Deck
Unlock for access to all 63 flashcards in this deck.
Unlock Deck
k this deck
61
Innova, SA., is beginning the production of a new product. Management believes that 500 labour hours will be required to complete the new unit. An 80 percent incremental unit-time learning curve model for direct labour hours is assumed to be valid. Assume that the exponent b = -0.3219. Data on costs are as follows: Required:
a.
Set up a table with columns for cumulative number of units showing the cumulative total time in hours using the incremental unit-time learning curve. Complete the table for 1, 2, 3, and 4 units given the individual unit time for the nth unit as 500, 400, 351, and 320 for 1 to 4 units respectively.
b.
Set up a similar table assuming a 90 percent with the incremental unit-time learning curve with the individual unit time for the nth unit as 500, 450, 430, 405 for 1 to 4 units respectively.
c.
What is the difference in variable cost of producing four units?
Required: a.
Set up a table with columns for cumulative number of units showing the cumulative total time in hours using the incremental unit-time learning curve. Complete the table for 1, 2, 3, and 4 units given the individual unit time for the nth unit as 500, 400, 351, and 320 for 1 to 4 units respectively.
b.
Set up a similar table assuming a 90 percent with the incremental unit-time learning curve with the individual unit time for the nth unit as 500, 450, 430, 405 for 1 to 4 units respectively.
c.
What is the difference in variable cost of producing four units?
Unlock Deck
Unlock for access to all 63 flashcards in this deck.
Unlock Deck
k this deck
62
Identify the three different cost estimation techniques and provide a description of the strengths and weaknesses of each.
Unlock Deck
Unlock for access to all 63 flashcards in this deck.
Unlock Deck
k this deck
63
SeyChy collected the following data on manufacturing costs and activity cost drivers for two months: Required:
Required: Unlock Deck
Unlock for access to all 63 flashcards in this deck.
Unlock Deck
k this deck
Unlock Deck
Unlock for access to all 63 flashcards in this deck.


