Deck 11: Estimation: Describing a Single Population
Full screen (f)
Question
Question
In developing an interval estimate for a population mean, the interval estimate was 62.84 to 69.46. The population standard deviation was assumed to be 6.50, and a sample of 100 observations was used. The mean of the sample was: 
Question
Which of the following best describes an unbiased estimator? 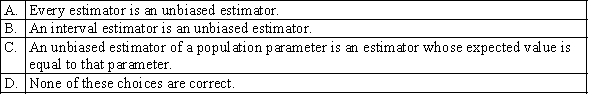
Question
A point estimate is defined as: 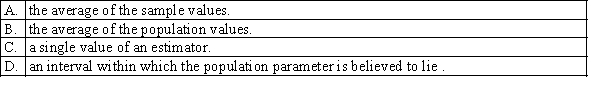
Question
The degrees of freedom used to find the t/2 for a confidence interval for the population mean? 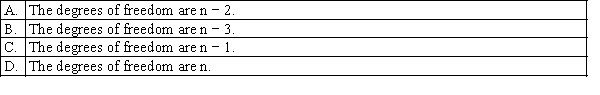
Question
If the Student t distribution is incorrectly used instead of the Standard normal distribution when finding the confidence interval for the population mean, and the population variance was known, what will happen to the width of the confidence interval? 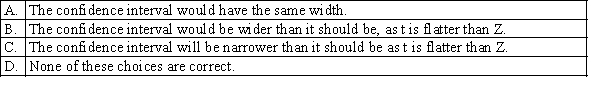
Question
The z value for a 95% confidence interval estimate is: 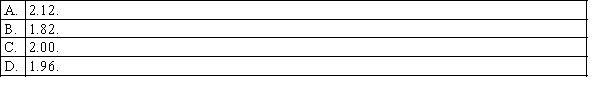
Question
Which of the following statistical distributions are used to find a confidence interval for the population proportion? 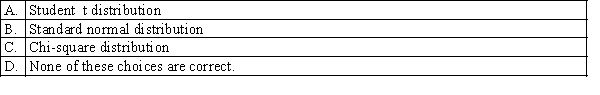
Question
Which of the following is the width of the confidence interval for the population mean? 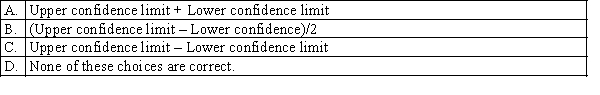
Question
A random sample of 64 observations has a mean of 30. The population variance is assumed to be 9. The 85.3% confidence interval estimate for the population mean (to the third decimal place) is: 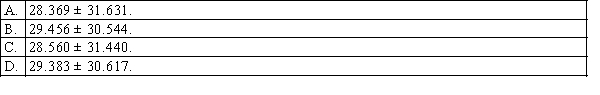
Question
The width of a confidence interval estimate of the population mean widens when the: 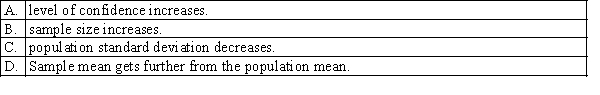
Question
Question
In developing an interval estimate at 87.4% for a population mean, the value of z to use is: 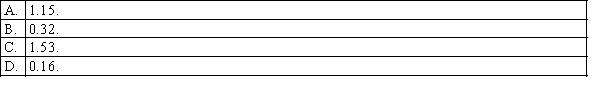
Question
Question
Which of the following statements are correct? 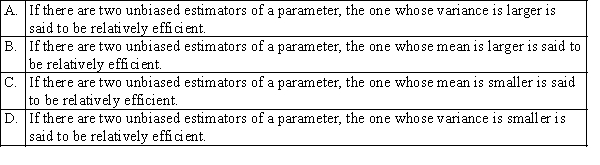
Question
Which of the following statistical distributions is used when estimating the population mean when the population variance is unknown? 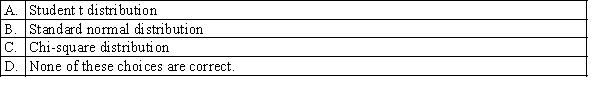
Question
Which of the following statements is (are) correct? 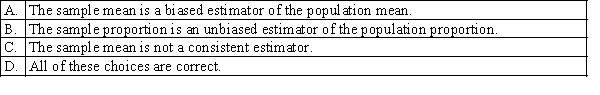
Question
The sample size needed to estimate a population mean to within 2 units with a 95% confidence when the population standard deviation equals 8 is: 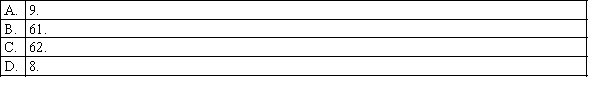
Question
Which of the following statistical distributions is used when estimating the population mean when the population variance is known? 
Question
Question
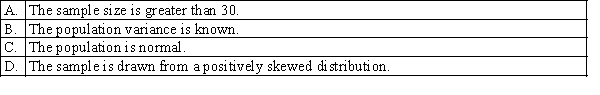
In constructing a confidence interval for the population mean when the population variance is unknown, which of the following assumptions is required when using the following formula? 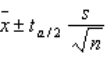
Question
Question
As the number of degrees of freedom for a t-distribution increases: 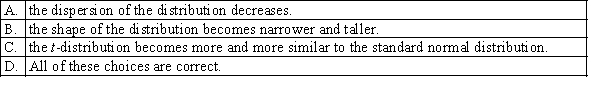
Question
Question
In the formula 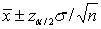 , the
, the  refers to:
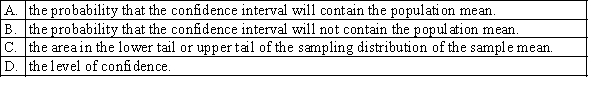
, the refers to: Question
For statistical inference about the mean of a single population when the population standard deviation is unknown, the number of degrees for freedom for the t-distribution is equal to n - 1 because we lose one degree of freedom by using the: 
Question
A random sample of size 15 taken from a normally distributed population revealed a sample mean of 75 and a sample variance of 25. The upper limit of a 95% confidence interval for the population mean would equal: 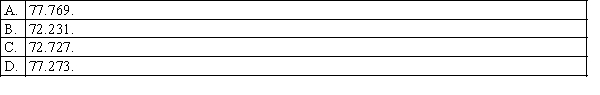
Question
For a sample of size 30 taken from a normally distributed population with standard deviation equal to 5, a 95% confidence interval for the population mean would require the use of: 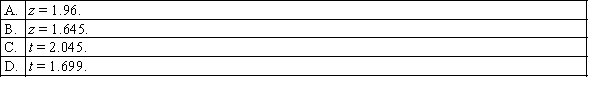
Question
In selecting the sample size to estimate the population proportion p, if we have no knowledge of even the approximate values of the sample proportion  , we:
, we: 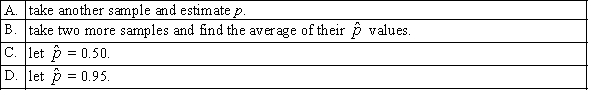
, we: Question
Which of the following is not a part of the formula for constructing a confidence interval estimate of the population mean? 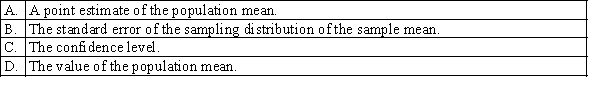
Question
The objective of estimation is to determine the approximate value of: 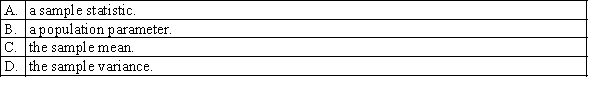
Question
The smaller the level of confidence used in constructing a confidence interval estimate of the population mean, the: 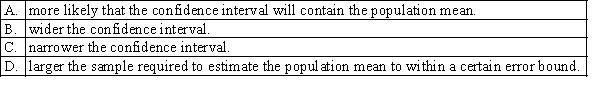
Question
The problem with relying on a point estimate of a population parameter is that: 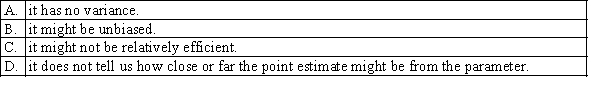
Question
A confidence interval is defined as: 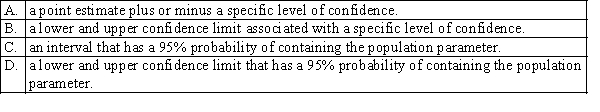
Question
The sample variance  is an unbiased estimator of the population variance
  when the denominator of
  is:
is: 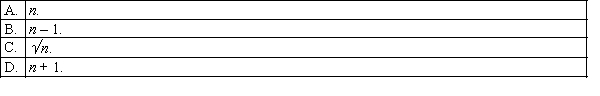
is an unbiased estimator of the population variance when the denominator of is: Question
The student t-distribution approaches the normal distribution as the: 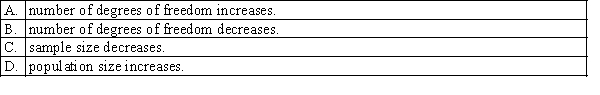
Question
A random sample of size 20 taken from a normally distributed population resulted in a sample variance of 32. The lower limit of a 90% confidence interval for the population variance would be: 
Question
A robust estimator is one that: 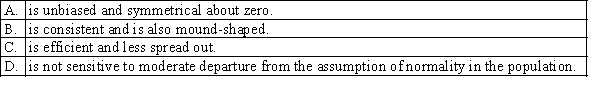
Question
Question
Question
Under which of the following circumstances is it impossible to construct a confidence interval for the population mean? 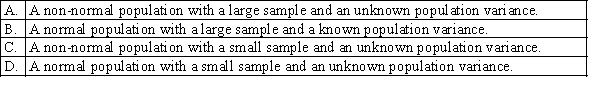
Question
Question
If the standard error of the sampling distribution of the sample proportion is 0.0337 for samples of size 200, then the population proportion must be: 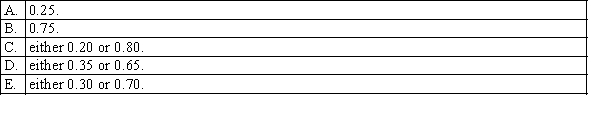
Question
Question
The use of the standard normal distribution for constructing a confidence interval estimate for the population proportion p requires that: 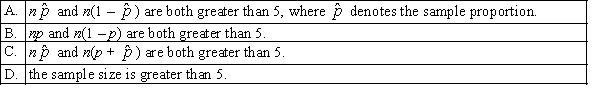
Question
Question
Question
From a sample of 300 items, 15 are defective. The point estimate of the population proportion defective will be: 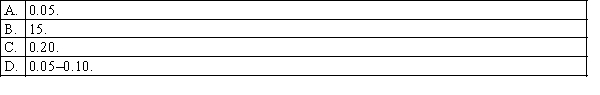
Question
A sample of size 200 is to be taken at random from an infinite population. Given that the population proportion is 0.60, the probability that the sample proportion will be greater than 0.58 is: 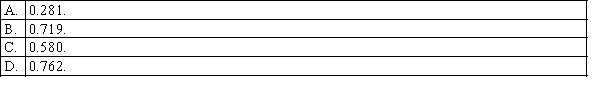
Question
A sample of 250 observations is to be selected at random from an infinite population. Given that the population proportion is 0.25, the standard error of the sampling distribution of the sample proportion is: 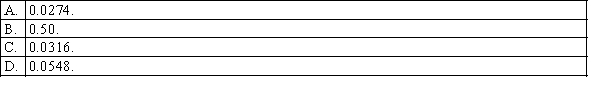
Question
After you calculate the sample size needed to estimate a population proportion to within 0.05, your statistics lecturer tells you the maximum allowable error must be reduced to just 0.025. If the original calculation led to a sample size of 400, the sample size will now have to be: 
Question
Question
Question
A random sample of size n has been selected from a normally distributed population whose standard deviation is s. In estimating an interval for the population mean, the t-distribution should be used instead of the z-test if: 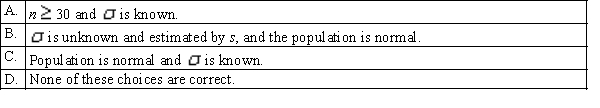
Question
A sample of size 300 is to be taken at random from an infinite population. Given that the population proportion is 0.70, the probability that the sample proportion will be smaller than 0.75 is: 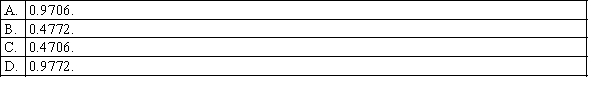
Question
If the standard error of the sampling distribution of the sample proportion is 0.0229 for samples of size 400, then the population proportion must be either: 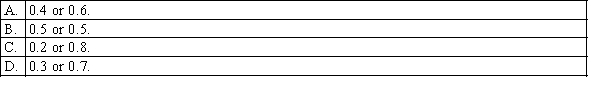
Question
The upper limit of a confidence interval at the 99% level of confidence for the population proportion if a sample of size 100 had 40 successes is: 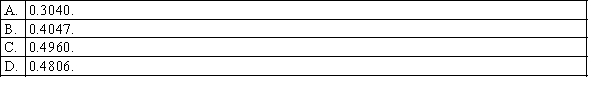
Question
Question
Question
Question
Question
Question
Question
Question
Question
Question
Question
Question
Question
Question
Question
Question
Question
Question
Question
Question
Question
Question
Question

Unlock Deck
Sign up to unlock the cards in this deck!
Unlock Deck
Unlock Deck
1/132
Play
Full screen (f)
Deck 11: Estimation: Describing a Single Population
1
Which of the following best describes an interval estimator?
B
2
In developing an interval estimate for a population mean, the interval estimate was 62.84 to 69.46. The population standard deviation was assumed to be 6.50, and a sample of 100 observations was used. The mean of the sample was:
D
3
Which of the following best describes an unbiased estimator?
C
4
A point estimate is defined as:
Unlock Deck
Unlock for access to all 132 flashcards in this deck.
Unlock Deck
k this deck
5
The degrees of freedom used to find the t/2 for a confidence interval for the population mean?
Unlock Deck
Unlock for access to all 132 flashcards in this deck.
Unlock Deck
k this deck
6
If the Student t distribution is incorrectly used instead of the Standard normal distribution when finding the confidence interval for the population mean, and the population variance was known, what will happen to the width of the confidence interval?
Unlock Deck
Unlock for access to all 132 flashcards in this deck.
Unlock Deck
k this deck
7
The z value for a 95% confidence interval estimate is:
Unlock Deck
Unlock for access to all 132 flashcards in this deck.
Unlock Deck
k this deck
8
Which of the following statistical distributions are used to find a confidence interval for the population proportion?
Unlock Deck
Unlock for access to all 132 flashcards in this deck.
Unlock Deck
k this deck
9
Which of the following is the width of the confidence interval for the population mean?
Unlock Deck
Unlock for access to all 132 flashcards in this deck.
Unlock Deck
k this deck
10
A random sample of 64 observations has a mean of 30. The population variance is assumed to be 9. The 85.3% confidence interval estimate for the population mean (to the third decimal place) is:
Unlock Deck
Unlock for access to all 132 flashcards in this deck.
Unlock Deck
k this deck
11
The width of a confidence interval estimate of the population mean widens when the:
Unlock Deck
Unlock for access to all 132 flashcards in this deck.
Unlock Deck
k this deck
12
A 95% confidence interval estimate for a population mean is determined to be 43.78 to 52.19. If the confidence level is decreased to 90%, the confidence interval :
Unlock Deck
Unlock for access to all 132 flashcards in this deck.
Unlock Deck
k this deck
13
In developing an interval estimate at 87.4% for a population mean, the value of z to use is:
Unlock Deck
Unlock for access to all 132 flashcards in this deck.
Unlock Deck
k this deck
14
In developing an interval estimate for a population mean, the population standard deviation was assumed to be 10. The interval estimate was 50.92 ± 2.14. Had equaled 20, the interval estimate would have been:
Unlock Deck
Unlock for access to all 132 flashcards in this deck.
Unlock Deck
k this deck
15
Which of the following statements are correct?
Unlock Deck
Unlock for access to all 132 flashcards in this deck.
Unlock Deck
k this deck
16
Which of the following statistical distributions is used when estimating the population mean when the population variance is unknown?
Unlock Deck
Unlock for access to all 132 flashcards in this deck.
Unlock Deck
k this deck
17
Which of the following statements is (are) correct?
Unlock Deck
Unlock for access to all 132 flashcards in this deck.
Unlock Deck
k this deck
18
The sample size needed to estimate a population mean to within 2 units with a 95% confidence when the population standard deviation equals 8 is:
Unlock Deck
Unlock for access to all 132 flashcards in this deck.
Unlock Deck
k this deck
19
Which of the following statistical distributions is used when estimating the population mean when the population variance is known?
Unlock Deck
Unlock for access to all 132 flashcards in this deck.
Unlock Deck
k this deck
20
A 90% confidence interval estimate of the population mean can be interpreted to mean that:
Unlock Deck
Unlock for access to all 132 flashcards in this deck.
Unlock Deck
k this deck
21
In constructing a confidence interval for the population mean when the population variance is unknown, which of the following assumptions is required when using the following formula?
Unlock Deck
Unlock for access to all 132 flashcards in this deck.
Unlock Deck
k this deck
22
Which of the following is true about the t-distribution?
Unlock Deck
Unlock for access to all 132 flashcards in this deck.
Unlock Deck
k this deck
23
As the number of degrees of freedom for a t-distribution increases:
Unlock Deck
Unlock for access to all 132 flashcards in this deck.
Unlock Deck
k this deck
24
Which of the following statements is (are) true?
Unlock Deck
Unlock for access to all 132 flashcards in this deck.
Unlock Deck
k this deck
25
In the formula , the refers to:
, the refers to: Unlock Deck
Unlock for access to all 132 flashcards in this deck.
Unlock Deck
k this deck
26
For statistical inference about the mean of a single population when the population standard deviation is unknown, the number of degrees for freedom for the t-distribution is equal to n - 1 because we lose one degree of freedom by using the:
Unlock Deck
Unlock for access to all 132 flashcards in this deck.
Unlock Deck
k this deck
27
A random sample of size 15 taken from a normally distributed population revealed a sample mean of 75 and a sample variance of 25. The upper limit of a 95% confidence interval for the population mean would equal:
Unlock Deck
Unlock for access to all 132 flashcards in this deck.
Unlock Deck
k this deck
28
For a sample of size 30 taken from a normally distributed population with standard deviation equal to 5, a 95% confidence interval for the population mean would require the use of:
Unlock Deck
Unlock for access to all 132 flashcards in this deck.
Unlock Deck
k this deck
29
In selecting the sample size to estimate the population proportion p, if we have no knowledge of even the approximate values of the sample proportion , we:
, we: Unlock Deck
Unlock for access to all 132 flashcards in this deck.
Unlock Deck
k this deck
30
Which of the following is not a part of the formula for constructing a confidence interval estimate of the population mean?
Unlock Deck
Unlock for access to all 132 flashcards in this deck.
Unlock Deck
k this deck
31
The objective of estimation is to determine the approximate value of:
Unlock Deck
Unlock for access to all 132 flashcards in this deck.
Unlock Deck
k this deck
32
The smaller the level of confidence used in constructing a confidence interval estimate of the population mean, the:
Unlock Deck
Unlock for access to all 132 flashcards in this deck.
Unlock Deck
k this deck
33
The problem with relying on a point estimate of a population parameter is that:
Unlock Deck
Unlock for access to all 132 flashcards in this deck.
Unlock Deck
k this deck
34
A confidence interval is defined as:
Unlock Deck
Unlock for access to all 132 flashcards in this deck.
Unlock Deck
k this deck
35
The sample variance is an unbiased estimator of the population variance when the denominator of is:
is an unbiased estimator of the population variance when the denominator of is: Unlock Deck
Unlock for access to all 132 flashcards in this deck.
Unlock Deck
k this deck
36
The student t-distribution approaches the normal distribution as the:
Unlock Deck
Unlock for access to all 132 flashcards in this deck.
Unlock Deck
k this deck
37
A random sample of size 20 taken from a normally distributed population resulted in a sample variance of 32. The lower limit of a 90% confidence interval for the population variance would be:
Unlock Deck
Unlock for access to all 132 flashcards in this deck.
Unlock Deck
k this deck
38
A robust estimator is one that:
Unlock Deck
Unlock for access to all 132 flashcards in this deck.
Unlock Deck
k this deck
39
Which of the following statements is false?
Unlock Deck
Unlock for access to all 132 flashcards in this deck.
Unlock Deck
k this deck
40
Which of the following assumptions must be true in order to use the formula to find a confidence interval estimate of the population mean?
Unlock Deck
Unlock for access to all 132 flashcards in this deck.
Unlock Deck
k this deck
41
Under which of the following circumstances is it impossible to construct a confidence interval for the population mean?
Unlock Deck
Unlock for access to all 132 flashcards in this deck.
Unlock Deck
k this deck
42
An unbiased estimator of a population parameter is an estimator whose expected value is equal to the population parameter to be estimated.
Unlock Deck
Unlock for access to all 132 flashcards in this deck.
Unlock Deck
k this deck
43
If the standard error of the sampling distribution of the sample proportion is 0.0337 for samples of size 200, then the population proportion must be:
Unlock Deck
Unlock for access to all 132 flashcards in this deck.
Unlock Deck
k this deck
44
A confidence interval is an interval estimate for which there is a specified degree of certainty that the actual value of the population parameter will fall within the interval.
Unlock Deck
Unlock for access to all 132 flashcards in this deck.
Unlock Deck
k this deck
45
The use of the standard normal distribution for constructing a confidence interval estimate for the population proportion p requires that:
Unlock Deck
Unlock for access to all 132 flashcards in this deck.
Unlock Deck
k this deck
46
An unbiased estimator is said to be consistent if the difference between the estimator and the parameter grows smaller as the sample size grows larger.
Unlock Deck
Unlock for access to all 132 flashcards in this deck.
Unlock Deck
k this deck
47
An interval estimate is a range of values within which the actual value of a population parameter falls.
Unlock Deck
Unlock for access to all 132 flashcards in this deck.
Unlock Deck
k this deck
48
From a sample of 300 items, 15 are defective. The point estimate of the population proportion defective will be:
Unlock Deck
Unlock for access to all 132 flashcards in this deck.
Unlock Deck
k this deck
49
A sample of size 200 is to be taken at random from an infinite population. Given that the population proportion is 0.60, the probability that the sample proportion will be greater than 0.58 is:
Unlock Deck
Unlock for access to all 132 flashcards in this deck.
Unlock Deck
k this deck
50
A sample of 250 observations is to be selected at random from an infinite population. Given that the population proportion is 0.25, the standard error of the sampling distribution of the sample proportion is:
Unlock Deck
Unlock for access to all 132 flashcards in this deck.
Unlock Deck
k this deck
51
After you calculate the sample size needed to estimate a population proportion to within 0.05, your statistics lecturer tells you the maximum allowable error must be reduced to just 0.025. If the original calculation led to a sample size of 400, the sample size will now have to be:
Unlock Deck
Unlock for access to all 132 flashcards in this deck.
Unlock Deck
k this deck
52
The sample proportion is a biased estimator of the population proportion.
Unlock Deck
Unlock for access to all 132 flashcards in this deck.
Unlock Deck
k this deck
53
Knowing that an estimator is unbiased only assures us that its expected value equals the parameter, but it does not tell us how close the estimator is to the parameter.
Unlock Deck
Unlock for access to all 132 flashcards in this deck.
Unlock Deck
k this deck
54
A random sample of size n has been selected from a normally distributed population whose standard deviation is s. In estimating an interval for the population mean, the t-distribution should be used instead of the z-test if:
Unlock Deck
Unlock for access to all 132 flashcards in this deck.
Unlock Deck
k this deck
55
A sample of size 300 is to be taken at random from an infinite population. Given that the population proportion is 0.70, the probability that the sample proportion will be smaller than 0.75 is:
Unlock Deck
Unlock for access to all 132 flashcards in this deck.
Unlock Deck
k this deck
56
If the standard error of the sampling distribution of the sample proportion is 0.0229 for samples of size 400, then the population proportion must be either:
Unlock Deck
Unlock for access to all 132 flashcards in this deck.
Unlock Deck
k this deck
57
The upper limit of a confidence interval at the 99% level of confidence for the population proportion if a sample of size 100 had 40 successes is:
Unlock Deck
Unlock for access to all 132 flashcards in this deck.
Unlock Deck
k this deck
58
The probability that a confidence interval includes the parameter of interest is either 1 or 0.
Unlock Deck
Unlock for access to all 132 flashcards in this deck.
Unlock Deck
k this deck
59
The sample standard deviation is an unbiased estimator of the population standard deviation.
Unlock Deck
Unlock for access to all 132 flashcards in this deck.
Unlock Deck
k this deck
60
An interval estimate is an estimate of the range for a population parameter.
Unlock Deck
Unlock for access to all 132 flashcards in this deck.
Unlock Deck
k this deck
61
The difference between the sample statistic and actual value of the population parameter is the percentage of the confidence interval.
Unlock Deck
Unlock for access to all 132 flashcards in this deck.
Unlock Deck
k this deck
62
We cannot interpret the confidence interval estimate of as a probability statement about , simply because the population mean is a fixed but unknown quantity.
Unlock Deck
Unlock for access to all 132 flashcards in this deck.
Unlock Deck
k this deck
63
In developing an interval estimate for a population mean, the population standard deviation was assumed to be 8. The interval estimate was 50.0 ± 2.50. Had equalled 16, the interval estimate would have been 100 ± 5.0.
Unlock Deck
Unlock for access to all 132 flashcards in this deck.
Unlock Deck
k this deck
64
When constructing confidence interval for a parameter, we generally set the confidence level close to 1 (usually between 0.90 and 0.99) because we would like to be reasonably confident that the interval includes the actual value of the population parameter.
Unlock Deck
Unlock for access to all 132 flashcards in this deck.
Unlock Deck
k this deck
65
The lower and upper limits of the 68.26% confidence interval for the population mean , given that n = 64, = 110 and = 8, are 109 and 111, respectively.
Unlock Deck
Unlock for access to all 132 flashcards in this deck.
Unlock Deck
k this deck
66
The upper limit of the 90% confidence interval for , given that n = 64, = 70 and = 20, is 65.89.
Unlock Deck
Unlock for access to all 132 flashcards in this deck.
Unlock Deck
k this deck
67
The sample proportion is a consistent estimator of the population proportion p because it is unbiased and the variance of is p(1 - p)/n, which grows smaller as n grows larger.
Unlock Deck
Unlock for access to all 132 flashcards in this deck.
Unlock Deck
k this deck
68
If there are two unbiased estimators of a parameter, the one whose variance is smaller is said to be relatively efficient.
Unlock Deck
Unlock for access to all 132 flashcards in this deck.
Unlock Deck
k this deck
69
It is possible to construct a confidence interval estimate of the population mean if the population variance is unknown.
Unlock Deck
Unlock for access to all 132 flashcards in this deck.
Unlock Deck
k this deck
70
In the formula , the subscript refers to the area in the lower tail or upper tail of the sampling distribution of the sample mean.
Unlock Deck
Unlock for access to all 132 flashcards in this deck.
Unlock Deck
k this deck
71
The larger the level of confidence used in constructing a confidence interval, the wider the confidence interval.
Unlock Deck
Unlock for access to all 132 flashcards in this deck.
Unlock Deck
k this deck
72
Suppose that a 90% confidence interval for is given by . This notation means that we are 90% confident that falls between and .
Unlock Deck
Unlock for access to all 132 flashcards in this deck.
Unlock Deck
k this deck
73
The range of a confidence interval is a measure of the expected sampling error.
Unlock Deck
Unlock for access to all 132 flashcards in this deck.
Unlock Deck
k this deck
74
The sample mean is an unbiased estimator of the population mean , and (when sampling from a normal population) the sample median is also an unbiased estimator of . However, the sample mean is relatively more efficient than the sample median.
Unlock Deck
Unlock for access to all 132 flashcards in this deck.
Unlock Deck
k this deck
75
The percentage of the confidence interval relies on the significance level.
Unlock Deck
Unlock for access to all 132 flashcards in this deck.
Unlock Deck
k this deck
76
The sample variance is an unbiased estimator of the population variance when the denominator of is n - 1.
Unlock Deck
Unlock for access to all 132 flashcards in this deck.
Unlock Deck
k this deck
77
A 95% confidence interval estimate for a population mean is determined to be 75 to 85. If the confidence level is reduced to 80%, the confidence interval for becomes narrower.
Unlock Deck
Unlock for access to all 132 flashcards in this deck.
Unlock Deck
k this deck
78
The sample mean is a consistent estimator of the population mean .
Unlock Deck
Unlock for access to all 132 flashcards in this deck.
Unlock Deck
k this deck
79
The width of a confidence interval increases as the level of significance increases.
Unlock Deck
Unlock for access to all 132 flashcards in this deck.
Unlock Deck
k this deck
80
A confidence interval becomes narrower as the sample size increases, for the same percentage of confidence.
Unlock Deck
Unlock for access to all 132 flashcards in this deck.
Unlock Deck
k this deck
Unlock Deck
Unlock for access to all 132 flashcards in this deck.


