Deck 2: Organizing Data
Full screen (f)
Question
Pyramid Lake, Nevada, is described as the pride of the Paiute Indian Nation. It is a beautiful desert lake famous for very large trout. The elevation of the lake surface (feet above sea level) varies according to the annual flow of the Truckee River from Lake Tahoe. Assume that the U.S. Geological Survey provided the following data: Make a time series graph.
A)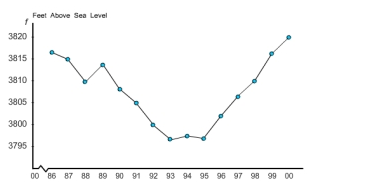
B)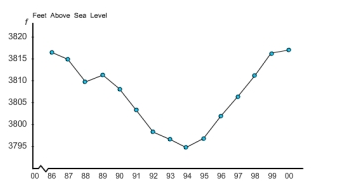
C)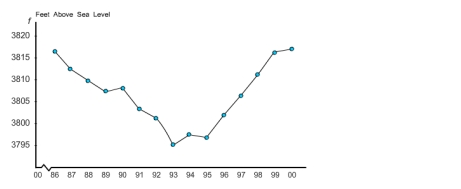
D)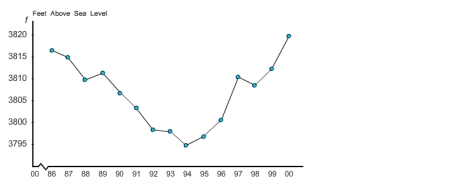
A)
B)
C)
D)
Question
Question
Finish times (to the nearest hour) for 57 dogsled teams are shown below. Make a dotplot for the data.
A)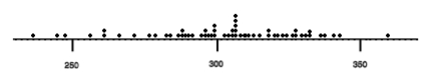
B)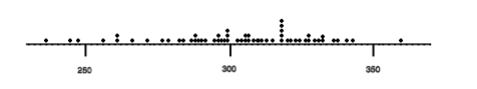
C)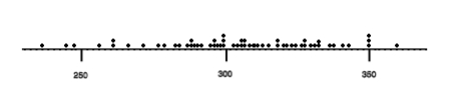
D)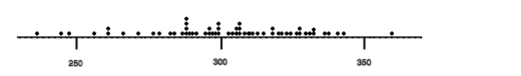
E)
A)
B)
C)
D)
E)
Question
Question
Assume that the following data represent baseball batting averages (multiplied by 1000) for a random sample of National League players near the end of the baseball season. The frequency table showing class limits, class boundaries, midpoints and frequency is given below. Draw a histogram.
A)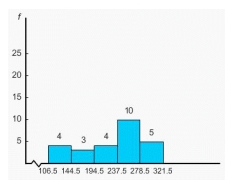
B)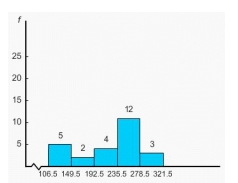
C)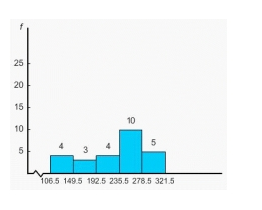
D)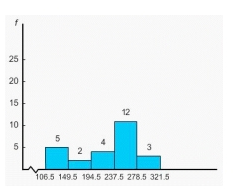
E)
A)
B)
C)
D)
E)
Question
Question
Question
It's not an easy life, but it's a good life! Suppose you decide to take the summer off and sign on as a deck hand for a commercial fishing boat in Alaska that specializes in deep-water fishing for groundfish. What kind of fish can you expect to catch? One way to answer this question is to examine the reports on groundfish caught in the Gulf of Alaska. The following list indicates the types of fish caught annually in thousands of metric tons: flatfish, 36.3; Pacific cod, 68.6; sablefish, 16.0; Walleye Pollock, 71.2; rockfish, 18.9. Make a Pareto chart showing the annual harvest for commercial fishing in the Gulf of Alaska.
A)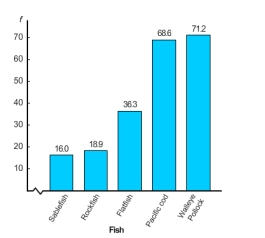
B)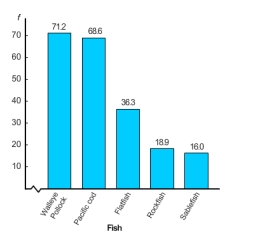
C)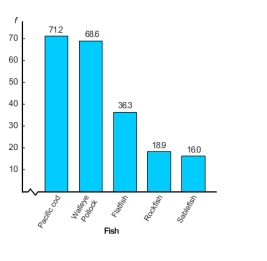
D)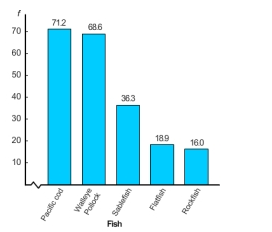
E)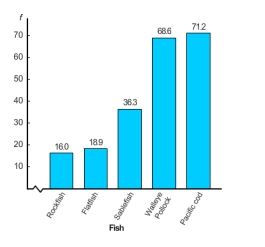
A)
B)
C)
D)
E)
Question
Question
Finish times (to the nearest hour) for 59 dogsled teams are shown below. Draw a relative - frequency histogram. Use five classes.
A)
B)
C)
D)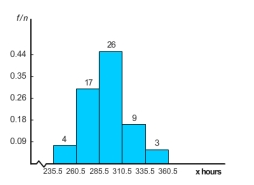
E)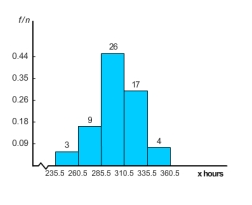
A)
B)
C)
D)
E)
Question
Finish times (to the nearest hour) for 59 dogsled teams are shown below. Draw a histogram. Use five classes. The frequency table for the above data is given below.
A)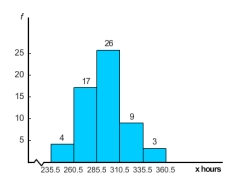
B)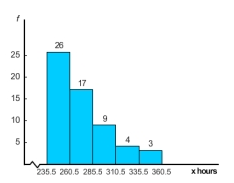
C)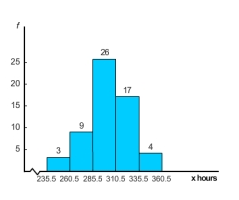
D)
E)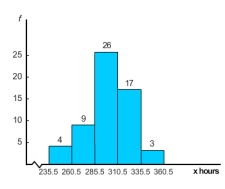
A)
B)
C)
D)
E)
Question
Question
Question
Question
Question
Finish times (to the nearest hour) for 59 dogsled teams are shown below. Draw a relative - frequency histogram. Use five classes. The frequency table for the above data is given below.
A)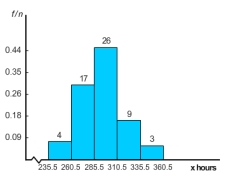
B)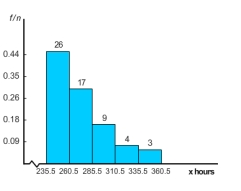
C)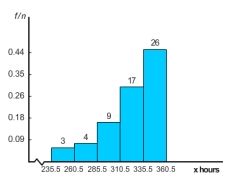
D)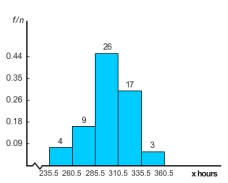
E)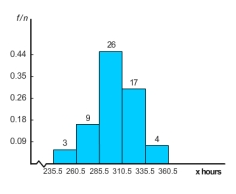
A)
B)
C)
D)
E)
Question
Question
Finish times (to the nearest hour) for 59 dogsled teams are shown below. Draw a histogram. Use five classes.
A)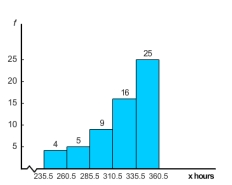
B)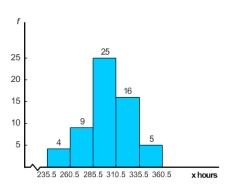
C)
D)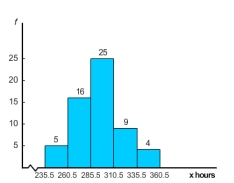
E)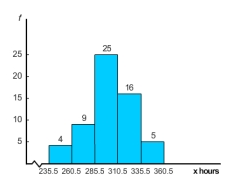
A)
B)
C)
D)
E)
Question
A survey of 1000 adults uncovered some interesting housekeeping secrets. When unexpected company comes, where do we hide the mess? The survey showed that 64% of the adults toss their mess in the closet, 24% shove things under bed, 8% put things in the bathtub, and 4% put the mess in the freezer. Make a circle graph to display this information.
A)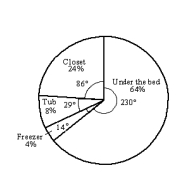
B)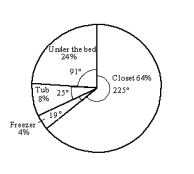
C)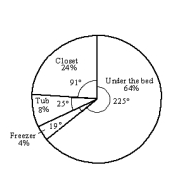
D)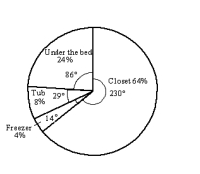
E)
A)
B)
C)
D)
E)
Question
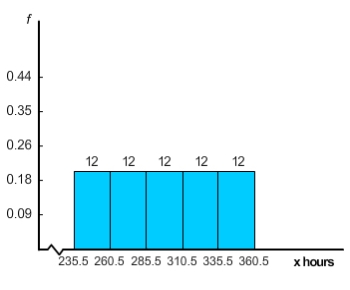
Finish times (to the nearest hour) for 60 dogsled teams are shown below. Use five classes. Categorize the basic distribution shape as uniform, mound-shaped symmetric, bimodal, skewed left, or skewed right. The relative frequency histogram of the above data is given below.
A)mound-shaped symmetric
B)none of these choices
C)Bimodal
D)Uniform or rectangular
E)Skewed right
A)mound-shaped symmetric
B)none of these choices
C)Bimodal
D)Uniform or rectangular
E)Skewed right
Question
Question
Question

Unlock Deck
Sign up to unlock the cards in this deck!
Unlock Deck
Unlock Deck
1/23
Play
Full screen (f)
Deck 2: Organizing Data
1
Pyramid Lake, Nevada, is described as the pride of the Paiute Indian Nation. It is a beautiful desert lake famous for very large trout. The elevation of the lake surface (feet above sea level) varies according to the annual flow of the Truckee River from Lake Tahoe. Assume that the U.S. Geological Survey provided the following data: Make a time series graph.
A)
B)
C)
D)
A)
B)
C)
D)
2
Suppose the American Medical Association Center for Health Policy Research included data, by state, on the number of community hospitals and the average patient stay (in days) in its publication. The data (by state) are shown in the table. Which two states have an unusually high number of hospitals?
A)Florida and Wisconsin
B)Alabama and Arkansas
C)Wisconsin and Louisiana
D)Maine and Iowa
E)none of these choices
A)Florida and Wisconsin
B)Alabama and Arkansas
C)Wisconsin and Louisiana
D)Maine and Iowa
E)none of these choices
Wisconsin and Louisiana
3
Finish times (to the nearest hour) for 57 dogsled teams are shown below. Make a dotplot for the data.
A)
B)
C)
D)
E)
A)
B)
C)
D)
E)
4
Finish times (to the nearest hour) for 10 dogsled teams are shown below. Find the class width. Use five classes. (Round your answer to the nearest integer.)
A)119
B)27
C)121
D)25
E)26
A)119
B)27
C)121
D)25
E)26
Unlock Deck
Unlock for access to all 23 flashcards in this deck.
Unlock Deck
k this deck
5
Assume that the following data represent baseball batting averages (multiplied by 1000) for a random sample of National League players near the end of the baseball season. The frequency table showing class limits, class boundaries, midpoints and frequency is given below. Draw a histogram.
A)
B)
C)
D)
E)
A)
B)
C)
D)
E)
Unlock Deck
Unlock for access to all 23 flashcards in this deck.
Unlock Deck
k this deck
6
Finish times (to the nearest hour) for 57 dogsled teams are shown below. Use five classes. Categorize the basic distribution shape as uniform or rectangular, mound-shaped symmetric, bimodal, skewed left, or skewed right.
A)approximately uniform or rectangular
B)approximately mound-shaped symmetric
C)approximately skewed left
D)approximately skewed right
E)approximately bimodal
A)approximately uniform or rectangular
B)approximately mound-shaped symmetric
C)approximately skewed left
D)approximately skewed right
E)approximately bimodal
Unlock Deck
Unlock for access to all 23 flashcards in this deck.
Unlock Deck
k this deck
7
At Westgate Community College, a survey was done to determine when students are available for class. A questionnaire was given to a random sample of students. The instructions were to mark each of the time categories in which they could take classes. Many students marked more than one category. Responses from the students in the sample indicated that 52 would take early morning classes, 85 would take mid-morning classes, 41 would take afternoon classes and 37 would take evening classes. Would a circle graph be appropriate for this data? Give a reason for your answer.
A)No. Since there were multiple responses from some students this data does not represent parts of a whole.
B)No. There are too few categories for a circle graph to be useful.
C)Yes. Circle graphs are most effective when the number of wedges is 10 or fewer.
D)Yes. Each category represents a percentage of the total student population that could attend class at a certain time.
E)Yes. The categories represent all possible responses.
Unlock Deck
Unlock for access to all 23 flashcards in this deck.
Unlock Deck
k this deck
8
It's not an easy life, but it's a good life! Suppose you decide to take the summer off and sign on as a deck hand for a commercial fishing boat in Alaska that specializes in deep-water fishing for groundfish. What kind of fish can you expect to catch? One way to answer this question is to examine the reports on groundfish caught in the Gulf of Alaska. The following list indicates the types of fish caught annually in thousands of metric tons: flatfish, 36.3; Pacific cod, 68.6; sablefish, 16.0; Walleye Pollock, 71.2; rockfish, 18.9. Make a Pareto chart showing the annual harvest for commercial fishing in the Gulf of Alaska.
A)
B)
C)
D)
E)
A)
B)
C)
D)
E)
Unlock Deck
Unlock for access to all 23 flashcards in this deck.
Unlock Deck
k this deck
9
Wetlands offer a diversity of benefits. They provide habitat for wildlife, spawning grounds for U.S. commercial fish, and renewable timber resources. In the last 200 years the United States has lost more than half its wetlands. Suppose Environmental Almanac gives the percentage of wet lands lost in each state in the last 200 years. Assume that for the lower 48 states, the percentage loss of wetlands per state is as follows: The distribution is approximately mound shaped.
A)False
B)True
A)False
B)True
Unlock Deck
Unlock for access to all 23 flashcards in this deck.
Unlock Deck
k this deck
10
Finish times (to the nearest hour) for 59 dogsled teams are shown below. Draw a relative - frequency histogram. Use five classes.
A)
B)
C)
D)
E)
A)
B)
C)
D)
E)
Unlock Deck
Unlock for access to all 23 flashcards in this deck.
Unlock Deck
k this deck
11
Finish times (to the nearest hour) for 59 dogsled teams are shown below. Draw a histogram. Use five classes. The frequency table for the above data is given below.
A)
B)
C)
D)
E)
A)
B)
C)
D)
E)
Unlock Deck
Unlock for access to all 23 flashcards in this deck.
Unlock Deck
k this deck
12
How long did real cowboys live? One answer may be found in the book The Last Cowboys by Connie Brooks (University of New Mexico Press). This delightful book presents a thoughtful sociological study of cowboys in West Texas and Southeastern New Mexico around the year 1890. Assume that a sample of 32 cowboys gave the following years of longevity: Make a stem-and-leaf display for these data.
A)
B)
C)
D)
E)
A)
B)
C)
D)
E)
Unlock Deck
Unlock for access to all 23 flashcards in this deck.
Unlock Deck
k this deck
13
Assume that the following data represent baseball batting averages for a random sample of National League players near the end of the baseball season. Multiply each data value by 1000 to "clear" the decimals.
A)
B)
C)
D)
E)
A)
B)
C)
D)
E)
Unlock Deck
Unlock for access to all 23 flashcards in this deck.
Unlock Deck
k this deck
14
Assume that the following data represent baseball batting averages (multiplied by 1000) for a random sample of National League players near the end of the baseball season. Make a frequency table showing class limits, class boundaries, midpoints and frequency. Use five classes. (Round your answer for boundaries and midpoints to the nearest tenth.)
A)
B)
C)
D)
E)
A)
B)
C)
D)
E)
Unlock Deck
Unlock for access to all 23 flashcards in this deck.
Unlock Deck
k this deck
15
Finish times (to the nearest hour) for 10 dogsled teams are shown below. Make a frequency table showing class limits, class boundaries, midpoints, frequency, relative frequencies, and cumulative frequencies. Use three classes. The class size of the given data is 24. (Round your answer for relative frequency to the nearest hundredth and for midpoint to the nearest tenth.)
A)
B)
C)
D)
E)
A)
B)
C)
D)
E)
Unlock Deck
Unlock for access to all 23 flashcards in this deck.
Unlock Deck
k this deck
16
Finish times (to the nearest hour) for 59 dogsled teams are shown below. Draw a relative - frequency histogram. Use five classes. The frequency table for the above data is given below.
A)
B)
C)
D)
E)
A)
B)
C)
D)
E)
Unlock Deck
Unlock for access to all 23 flashcards in this deck.
Unlock Deck
k this deck
17
Finish times (to the nearest hour) for 10 dogsled teams are shown below. Make a frequency table showing class limits, class boundaries, midpoints, frequency, relative frequencies, and cumulative frequencies. Use three classes. (Round your answer for relative frequency to the nearest hundredth and for midpoint to the nearest tenth.)
A)
B)
C)
D)
E)
A)
B)
C)
D)
E)
Unlock Deck
Unlock for access to all 23 flashcards in this deck.
Unlock Deck
k this deck
18
Finish times (to the nearest hour) for 59 dogsled teams are shown below. Draw a histogram. Use five classes.
A)
B)
C)
D)
E)
A)
B)
C)
D)
E)
Unlock Deck
Unlock for access to all 23 flashcards in this deck.
Unlock Deck
k this deck
19
A survey of 1000 adults uncovered some interesting housekeeping secrets. When unexpected company comes, where do we hide the mess? The survey showed that 64% of the adults toss their mess in the closet, 24% shove things under bed, 8% put things in the bathtub, and 4% put the mess in the freezer. Make a circle graph to display this information.
A)
B)
C)
D)
E)
A)
B)
C)
D)
E)
Unlock Deck
Unlock for access to all 23 flashcards in this deck.
Unlock Deck
k this deck
20
Finish times (to the nearest hour) for 60 dogsled teams are shown below. Use five classes. Categorize the basic distribution shape as uniform, mound-shaped symmetric, bimodal, skewed left, or skewed right. The relative frequency histogram of the above data is given below.
A)mound-shaped symmetric
B)none of these choices
C)Bimodal
D)Uniform or rectangular
E)Skewed right
A)mound-shaped symmetric
B)none of these choices
C)Bimodal
D)Uniform or rectangular
E)Skewed right
Unlock Deck
Unlock for access to all 23 flashcards in this deck.
Unlock Deck
k this deck
21
Assume that the U.S Open Golf Tournament was played at Congressional Country club, with prizes ranging from $465,000 for first place to $5000. Par for the course is 70. The tournament consists of four rounds played on different days. Suppose the scores for each round of the 32 players who placed in the money (more than $17,000) were given on a web site. The scores for the first round were as follows: The scores for the fourth round for these players were as follows:
Compare the two distributions.
A)Scores are equal for both the rounds.
B)Scores are lower in the first round.
C)Scores are lower in the fourth round.
D)none of these choices
Compare the two distributions.
A)Scores are equal for both the rounds.
B)Scores are lower in the first round.
C)Scores are lower in the fourth round.
D)none of these choices
Unlock Deck
Unlock for access to all 23 flashcards in this deck.
Unlock Deck
k this deck
22
Use the data given in the following table to make a stem - and - leaf display for milligrams of nicotine per cigarette smoked. In this case, truncate the measurements at the tenths position and use two lines per stem.
A)
B)
C)
D)
E)
A)
B)
C)
D)
E)
Unlock Deck
Unlock for access to all 23 flashcards in this deck.
Unlock Deck
k this deck
23
Assume that the U.S Open Golf Tournament was played at Congressional Country club, with prizes ranging from $465,000 for first place to $5000. Par for the course is 70. The tournament consists of four rounds played on different days. Suppose the scores for each round of the 32 players who placed in the money (more than $17,000) were given on a web site. The scores for the first round were as follows: Make a stem - and - leaf display for the first - round scores. Use two lines per stem.
A)
B)
C)
D)
E)
A)
B)
C)
D)
E)
Unlock Deck
Unlock for access to all 23 flashcards in this deck.
Unlock Deck
k this deck
Unlock Deck
Unlock for access to all 23 flashcards in this deck.


