Deck 1: Overview and Descriptive Statistics
Full screen (f)
Question
A sample of 26 offshore oil workers took part in a simulated escape exercise, resulting in the accompanying data on time (sec) to complete the escape: 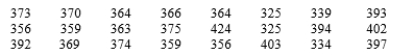
a. Construct a stem-and-leaf display of the data. How does it suggest that the sample mean and median will compare?
b. Calculate the values of the sample mean and median.
c. By how much could the largest time, currently 424, be increased without affecting the value of the sample median? By how much could this value be decreased without affecting the value of the sample mean?
d. What are the values of
and
when the observations are re-expressed in minutes?
Question
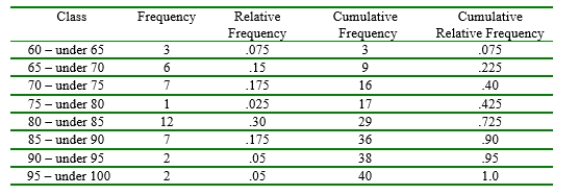
The cumulative frequency and cumulative relative frequency for a particular class interval are the sum of frequencies and relative frequencies, respectively, for that interval and all intervals lying below it. Compute the cumulative frequencies and cumulative relative frequencies for the following data: 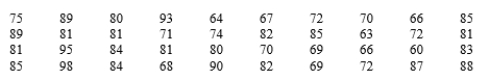
Question
A sample of 20 glass bottles of a particular type was selected, and the internal pressure strength of each bottle was determined. Consider the following partial sample information:
Median = 202.2
lower fourth = 196.0
Upper fourth = 216.8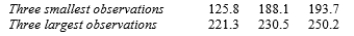 Are there any outliers in the sample? Any extreme outliers?
Median = 202.2
lower fourth = 196.0
Upper fourth = 216.8
Are there any outliers in the sample? Any extreme outliers? Question
Question
Calculate and interpret the values of the sample mean and sample standard deviation for the following observations on fracture strength. 
Question
Question
Question
The accompanying data specific gravity values for various wood types used in construction . 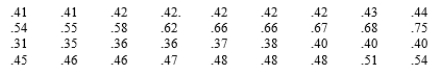 Construct a stem-and-leaf display using repeated stems and comment on any interesting features of the display.
Construct a stem-and-leaf display using repeated stems and comment on any interesting features of the display. Question
Answer the following two questions:
a. If a constant c is added to each
in a sample, yielding
=
+ c, how do the sample mean and median of the
's relate to the mean and median of the
's? Verify your conjectures.
b. If each
is multiplied by a constant c, yielding
=
, answer the question of part (a). Again, verify your conjectures.
a. If a constant c is added to each
in a sample, yielding
=
+ c, how do the sample mean and median of the
's relate to the mean and median of the
's? Verify your conjectures.
b. If each
is multiplied by a constant c, yielding
=
, answer the question of part (a). Again, verify your conjectures.
Question
Question
Temperature transducers of a certain type are shipped in batches of 50. A sample of 60 batches was selected, and the number of transducers in each batch not conforming to design specifications was determined, resulting in the following data: 
a. Determine frequencies and relative frequencies for the observed values of x = number of nonconforming transducers in a batch.
b. What proportion of batches in the sample has at most four nonconforming transducers? What proportion has fewer than four? What proportion has at least four nonconforming units?
Question
A sample of n = 10 automobiles was selected, and each was subjected to a 5-mph crash test. Denoting a car with no visible damage by S (for success) and a car with such damage by F, results were as follows: S S S F F S S F S S
a. What is the value of the sample proportion of successes x/n?
b. Replace each S with a 1 and each F with a 0. Then calculate
for this numerically coded sample. How does
compare to x/n?
c. Suppose it is decided to include 15 more cars in the experiment. How many of these would have to be S's to x/n = .80 for the entire sample of 25 cars?
Question
Question
Consider the following observations on shear strength of a joint bonded in a particular manner: 
a. Determine the value of the sample mean.
b. Determine the value of the sample median. Why is it so different from the mean?
c. Calculate a trimmed mean by deleting the smallest and largest observations. What is the corresponding trimming percentage? How does the value of this
compare to the mean and median?
Question
The number of contaminating particles on a silicon wafer prior to a certain rinsing process was determined for each wafer in a sample size 100, resulting in the following frequencies: 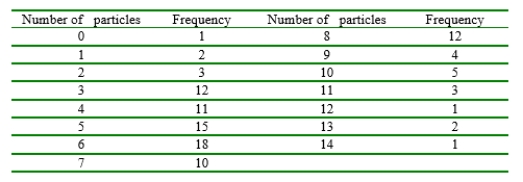
a. What proportion of the sampled wafers had at least two particles? At least six particles?
b. What proportion of the sampled wafers had between four and nine particles, inclusive? Strictly between four and nine particles?
a. What proportion of the sampled wafers had at least two particles? At least six particles?
b. What proportion of the sampled wafers had between four and nine particles, inclusive? Strictly between four and nine particles?

Unlock Deck
Sign up to unlock the cards in this deck!
Unlock Deck
Unlock Deck
1/15
Play
Full screen (f)
Deck 1: Overview and Descriptive Statistics
1
A sample of 26 offshore oil workers took part in a simulated escape exercise, resulting in the accompanying data on time (sec) to complete the escape:
a. Construct a stem-and-leaf display of the data. How does it suggest that the sample mean and median will compare?
b. Calculate the values of the sample mean and median.
c. By how much could the largest time, currently 424, be increased without affecting the value of the sample median? By how much could this value be decreased without affecting the value of the sample mean?
d. What are the values of
and
when the observations are re-expressed in minutes?
a. A. stem-and-leaf display of this data appears below: 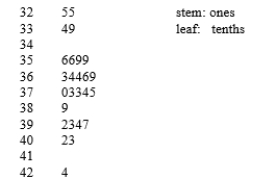
 The display is reasonably symmetric, so the mean and median will be close.
b. The sample mean is = 9638/26 = 370.7. The sample median is
  = (369+370)/2=369.50.
c. The largest value (currently 424) could be increased by any amount. Doing so will not change the fact that the middle two observations are 369 and 170, and hence, the median will not change. However, the value x = 424 can not be changed to a number less than 370 ( a change of 424-370 = 54) since that will lower the values(s) of the two middle observations.
d. Expressed in minutes, the mean is (370.7 sec)/(60 sec) = 6.18 min; the median 6.16 min.
The display is reasonably symmetric, so the mean and median will be close.b. The sample mean is
= 9638/26 = 370.7. The sample median is = (369+370)/2=369.50.c. The largest value (currently 424) could be increased by any amount. Doing so will not change the fact that the middle two observations are 369 and 170, and hence, the median will not change. However, the value x = 424 can not be changed to a number less than 370 ( a change of 424-370 = 54) since that will lower the values(s) of the two middle observations.
d. Expressed in minutes, the mean is (370.7 sec)/(60 sec) = 6.18 min; the median 6.16 min.
2
The cumulative frequency and cumulative relative frequency for a particular class interval are the sum of frequencies and relative frequencies, respectively, for that interval and all intervals lying below it. Compute the cumulative frequencies and cumulative relative frequencies for the following data:
3
A sample of 20 glass bottles of a particular type was selected, and the internal pressure strength of each bottle was determined. Consider the following partial sample information:
Median = 202.2
lower fourth = 196.0
Upper fourth = 216.8 Are there any outliers in the sample? Any extreme outliers?
Median = 202.2
lower fourth = 196.0
Upper fourth = 216.8
Are there any outliers in the sample? Any extreme outliers?1.5(IQR) = 1.5(216.8-196.0) = 31.2 and 3(IQR) = 3(216.8-196.0) = 62.4.
Mild outliers: observations below 196-31.2 = 164.6 or above 216.8+31.2=248.
Extreme outliers: observations below 196-62.4 = 133.6 or above 216.8+62.4 = 279.2.
Of the observations given, 125.8 is an extreme outlier and 250.2 is a mild outlier.
Mild outliers: observations below 196-31.2 = 164.6 or above 216.8+31.2=248.
Extreme outliers: observations below 196-62.4 = 133.6 or above 216.8+62.4 = 279.2.
Of the observations given, 125.8 is an extreme outlier and 250.2 is a mild outlier.
4
Give one possible sample of size 4 from each of the following populations:
a. All daily newspapers published in the United States
b. All companies listed on the New York Stock Exchange
c. All students at your college or university
d. All grade point averages of students at your college or university
a. All daily newspapers published in the United States
b. All companies listed on the New York Stock Exchange
c. All students at your college or university
d. All grade point averages of students at your college or university
Unlock Deck
Unlock for access to all 15 flashcards in this deck.
Unlock Deck
k this deck
5
Calculate and interpret the values of the sample mean and sample standard deviation for the following observations on fracture strength.
Unlock Deck
Unlock for access to all 15 flashcards in this deck.
Unlock Deck
k this deck
6
The first four deviations from the mean in a sample of n = 5 reaction times were .6, .9, 1.0, and 1.5. What is the fifth deviation from the mean? Give a sample for which these are the five deviations from the mean.
Unlock Deck
Unlock for access to all 15 flashcards in this deck.
Unlock Deck
k this deck
7
A Southern State University system consists of 23 campuses. An administrator wishes to make an inference about the average distance between the hometowns of students and their campuses. Describe and discuss several different sampling methods that might be employed. Would this be an enumerative or an analytic study? Explain your reasoning.
Unlock Deck
Unlock for access to all 15 flashcards in this deck.
Unlock Deck
k this deck
8
The accompanying data specific gravity values for various wood types used in construction . Construct a stem-and-leaf display using repeated stems and comment on any interesting features of the display.
Construct a stem-and-leaf display using repeated stems and comment on any interesting features of the display. Unlock Deck
Unlock for access to all 15 flashcards in this deck.
Unlock Deck
k this deck
9
Answer the following two questions:
a. If a constant c is added to each
in a sample, yielding
=
+ c, how do the sample mean and median of the
's relate to the mean and median of the
's? Verify your conjectures.
b. If each
is multiplied by a constant c, yielding
=
, answer the question of part (a). Again, verify your conjectures.
a. If a constant c is added to each
in a sample, yielding
=
+ c, how do the sample mean and median of the
's relate to the mean and median of the
's? Verify your conjectures.
b. If each
is multiplied by a constant c, yielding
=
, answer the question of part (a). Again, verify your conjectures.
Unlock Deck
Unlock for access to all 15 flashcards in this deck.
Unlock Deck
k this deck
10
A Michigan city divides naturally into ten district neighborhoods. How might a real estate appraiser select a sample of single-family homes that could be used as a basis for developing an equation to predict appraised value from characteristics such as age, size, number of bathrooms, and distance to the nearest school, and so on? Is the study enumerative or analytic?
Unlock Deck
Unlock for access to all 15 flashcards in this deck.
Unlock Deck
k this deck
11
Temperature transducers of a certain type are shipped in batches of 50. A sample of 60 batches was selected, and the number of transducers in each batch not conforming to design specifications was determined, resulting in the following data:
a. Determine frequencies and relative frequencies for the observed values of x = number of nonconforming transducers in a batch.
b. What proportion of batches in the sample has at most four nonconforming transducers? What proportion has fewer than four? What proportion has at least four nonconforming units?
Unlock Deck
Unlock for access to all 15 flashcards in this deck.
Unlock Deck
k this deck
12
A sample of n = 10 automobiles was selected, and each was subjected to a 5-mph crash test. Denoting a car with no visible damage by S (for success) and a car with such damage by F, results were as follows: S S S F F S S F S S
a. What is the value of the sample proportion of successes x/n?
b. Replace each S with a 1 and each F with a 0. Then calculate
for this numerically coded sample. How does
compare to x/n?
c. Suppose it is decided to include 15 more cars in the experiment. How many of these would have to be S's to x/n = .80 for the entire sample of 25 cars?
a. What is the value of the sample proportion of successes x/n?
b. Replace each S with a 1 and each F with a 0. Then calculate
for this numerically coded sample. How does
compare to x/n?
c. Suppose it is decided to include 15 more cars in the experiment. How many of these would have to be S's to x/n = .80 for the entire sample of 25 cars?
Unlock Deck
Unlock for access to all 15 flashcards in this deck.
Unlock Deck
k this deck
13
An experiment was carried out to study how flow rate through a solenoid valve in an automobile's pollution-control system depended on three factors: armature lengths, spring load, and bobbin depth. Two different levels (low and high) of each factor were chosen, and a single observation on flow was made for each combination of levels.
a. The resulting data set consisted of how many observations?
b. Is this an enumerative or analytic study? Explain your reasoning.
a. The resulting data set consisted of how many observations?
b. Is this an enumerative or analytic study? Explain your reasoning.
Unlock Deck
Unlock for access to all 15 flashcards in this deck.
Unlock Deck
k this deck
14
Consider the following observations on shear strength of a joint bonded in a particular manner:
a. Determine the value of the sample mean.
b. Determine the value of the sample median. Why is it so different from the mean?
c. Calculate a trimmed mean by deleting the smallest and largest observations. What is the corresponding trimming percentage? How does the value of this
compare to the mean and median?
Unlock Deck
Unlock for access to all 15 flashcards in this deck.
Unlock Deck
k this deck
15
The number of contaminating particles on a silicon wafer prior to a certain rinsing process was determined for each wafer in a sample size 100, resulting in the following frequencies:
a. What proportion of the sampled wafers had at least two particles? At least six particles?
b. What proportion of the sampled wafers had between four and nine particles, inclusive? Strictly between four and nine particles?
a. What proportion of the sampled wafers had at least two particles? At least six particles?
b. What proportion of the sampled wafers had between four and nine particles, inclusive? Strictly between four and nine particles?
Unlock Deck
Unlock for access to all 15 flashcards in this deck.
Unlock Deck
k this deck
Unlock Deck
Unlock for access to all 15 flashcards in this deck.


