Deck 12: Simple Linear Regression and Correlation
Full screen (f)
Question
Question
In the simple linear regression model Y =  the quantity E is a random variable, assumed to be normally distributed with E(
  ) = 0, and V(
  ) =
) =  . The estimated standard error of
  (the least squares estimated of
  ), denoted by
  , is __________ divided by __________, where
 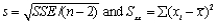 .
.
the quantity E is a random variable, assumed to be normally distributed with E( ) = 0, and V( ) = . The estimated standard error of (the least squares estimated of ), denoted by , is __________ divided by __________, where . Question
In the simple linear regression model  the quantity E is a random variable, assumed to be normally distributed with E(
  ) = 0 and V(
  ) =
) =  . The estimator
  has a __________ distribution, because it is a linear function of independent __________ random variables.
the quantity E is a random variable, assumed to be normally distributed with E( ) = 0 and V( ) = . The estimator has a __________ distribution, because it is a linear function of independent __________ random variables. Question
Question
The assumptions of the simple of the simple linear regression model imply that the standardized variable  has a t distribution with __________ degrees of freedom.
has a t distribution with __________ degrees of freedom. Question
Question
If  then the least squares estimate of the slope coefficient
  of the true regression line
  = __________.
then the least squares estimate of the slope coefficient of the true regression line = __________. Question
The vertical deviations 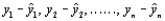 from the estimated regression line are referred to as the __________.
from the estimated regression line are referred to as the __________. Question
Question
If  then the least squares estimate of the slope coefficient
  of the true regression line
  = __________.
then the least squares estimate of the slope coefficient of the true regression line = __________. Question
Question
Question
In a simple linear regression problem, the following statistics are given:  Then, the error sum of squares is __________.
Then, the error sum of squares is __________. Question
In simple linear regression analysis, SST is the total sum of squares, SSE is the error sum of squares, and SSR is the regression sum of squares. The coefficient of determination  is given by
is given by Question
Since the mean of  is an __________ estimator of
  .
.
is an __________ estimator of . Question
If 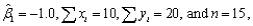 then the least squares estimate of the intercept
  of the true regression line
  = __________.
then the least squares estimate of the intercept of the true regression line = __________. Question
The simple linear regression model is  is a random variable assumed to be __________ distributed, with
is a random variable assumed to be __________ distributed, with Question
When the estimated regression line is obtained via the principle of least squares, the sum of the residuals  (i = 1, 3, …….., n) should in theory be __________.
(i = 1, 3, …….., n) should in theory be __________. Question
Question
Question
In a simple linear regression, the most commonly encountered pair of hypotheses about  is
is  A test of these two hypotheses is often referred to as the __________.
is A test of these two hypotheses is often referred to as the __________. Question
Given that  , and n = 15, the 95% confidence interval for the slope
  of the true regression line (__________,__________).
, and n = 15, the 95% confidence interval for the slope of the true regression line (__________,__________). Question
Question
The validity of joint or simultaneous confidence intervals for the expected value of Y when  rests on a probability result called the __________ inequality, so the joint confidence intervals are referred to as __________ intervals.
rests on a probability result called the __________ inequality, so the joint confidence intervals are referred to as __________ intervals. Question
In testing  the test statistic value is the t - ratio t = __________ divided by __________.
the test statistic value is the t - ratio t = __________ divided by __________. Question
If the  confidence interval
  .
.  For the expected value of Y when
  is computed both for x = a and for x = b to obtain joint confidence intervals for
  then the joint confidence coefficient on the resulting pair of intervals is at least __________ %.
confidence interval . For the expected value of Y when is computed both for x = a and for x = b to obtain joint confidence intervals for then the joint confidence coefficient on the resulting pair of intervals is at least __________ %. Question
The sample correlation coefficient r equals -1 if and only if all  pairs lie on a straight line with __________ slope.
pairs lie on a straight line with __________ slope. Question
A 100(1 -  ) % confidence interval for the slope
  of the true regression line is
  __________
 .
.
) % confidence interval for the slope of the true regression line is __________ . Question
In testing  the t test statistic value is found to be t = 2.15. Should the null hypothesis be tested by constructing an ANOVA table, the F test would result in a test statistic value f = __________.
the t test statistic value is found to be t = 2.15. Should the null hypothesis be tested by constructing an ANOVA table, the F test would result in a test statistic value f = __________. Question
In testing  using a sample of 18 observations, the rejection region for .025 level test is
  __________.
using a sample of 18 observations, the rejection region for .025 level test is __________. Question
Given n pairs of observations  if large x's are paired with large y's and small x's are paired with small y's, then a __________ relationship between the variables is implied. Similarly, it is natural to speak of x and y having a __________ relationship if large x's are paired with small y's and small x's are paired with large y's.
if large x's are paired with large y's and small x's are paired with small y's, then a __________ relationship between the variables is implied. Similarly, it is natural to speak of x and y having a __________ relationship if large x's are paired with small y's and small x's are paired with large y's. Question
The sample correlation coefficient r equals 1 if and only if all  pairs lie on a straight line with __________ slope.
pairs lie on a straight line with __________ slope. Question
Question
Question
The null hypothesis  can be tested against
  by constructing an ANOVA table, and rejecting
  level of significance if the test statistic value f
  __________, where n is the sample size.
can be tested against by constructing an ANOVA table, and rejecting level of significance if the test statistic value f __________, where n is the sample size. Question
The t critical value for a confidence level of 90% for the slope  of the regression line, based on a sample of size 20, is t = __________.
of the regression line, based on a sample of size 20, is t = __________. Question
Let  where
where  is some fixed value of x. Then, the mean value of
  is
is  __________.
where is some fixed value of x. Then, the mean value of is __________. Question
In testing 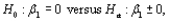 using a sample of 15 observations, the rejection region for .05 level test is either
  __________ or
  __________.
using a sample of 15 observations, the rejection region for .05 level test is either __________ or __________. Question
Question
Both the confidence interval for  , the expected value of Y when
  and prediction interval for a future Y observation to be made when
  are __________ for an
  near
near  than for an
  far from
  .
.
, the expected value of Y when and prediction interval for a future Y observation to be made when are __________ for an near than for an far from . Question
Question
Question
Question
Question
If  then the sample correlation coefficient r equals __________.
then the sample correlation coefficient r equals __________. Question
Question
Question
In testing  using a sample of size 25, the test statistic value is found to be t = 2.50. The corresponding P-value for the test is __________, and we __________
  when
when 
using a sample of size 25, the test statistic value is found to be t = 2.50. The corresponding P-value for the test is __________, and we __________ when Question
Which of the following statements are true?
A) The true regression line
Is the line of mean values.
B) The height of the true regression line
Above any particular x value is the expected value of Y for that value of x.
C) The slope
Of the true regression line
Is interpreted as the expected change in Y associated with a 1-unit increase in the value of x.
D) The equation
States that the amount of variability in the distribution of Y values is the same at each different value of x (homogeneity of variance).
E) All of the above statements are true.
Question
Question
Question
Question
A reasonable rule of thumb is to say that the correlation is weak if __________  __________, strong if __________
  __________, and moderate otherwise.
__________, strong if __________ __________, and moderate otherwise. Question
When  is true, the test statistic
 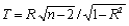 has a t distribution with __________ degrees of Freedom, where n is the sample size.
is true, the test statistic has a t distribution with __________ degrees of Freedom, where n is the sample size. Question
Question
Question
Question
Question
The simple linear regression model is where
is a random variable assumed to be normally distributed with Let denote a particular value of the independent variable x. Which of the following identities are true regarding the expected or mean value of Y when ?
A)
B)
C)
D)
E)
is a random variable assumed to be normally distributed with Let denote a particular value of the independent variable x. Which of the following identities are true regarding the expected or mean value of Y when ?
A)
B)
C)
D)
E)
Question
The simple linear regression model is is a random variable assumed to be normally distributed with denote a particular value of the independent variable x. Which of the following identities are true regarding the variance of Y when ?
A)
B)
C)
D)
E)
A)
B)
C)
D)
E)
Question
Which of the following statements are true?
A) The confidence interval for
; the expected value of Y when
Is centered at the point estimate for
And extends out to each side by an amount that depends on the confidence level and on the extent of variability in the estimator on which the point estimated is based.
B) In some situations, a confidence interval is desired not just for a single x value but for two or more x values.
C) The joint or simultaneous confidence level for a set of K Bonferroni intervals is guaranteed to be at least 100(1 - K
)%)
D) We refer to an interval of plausible values for a future Y as a prediction interval rather than a confidence interval, since a future value of Y is a random variable.
E) All of the above statements are true.
Question
Which of the following statements are not true?
A)
, where
Is a specified value of the independent variable x, can be regarded either as a point estimate of
(the expected or true average value of Y when
) or as a prediction of the Y value that will result from a single observation made when
)
B) Before we obtain sample data, both
And
Are subject to sampling variability - that is, they are both statistics whose values will vary from sample to sample.
C) A confidence interval for a mean y value in regression is based on properties of the sampling distribution of the statistic
)
D) All of the above statements are true.
E) None of the above statements are true.
Question
Question
Which of the above statements are not true?
A) A t variable obtained by standardizing
Leads to a confidence interval and test procedure concerning![<strong>Which of the above statements are not true?</strong> A) A t variable obtained by standardizing \hat { \beta } _ { 0 } + \hat { \beta } _ { 1 } x ^ { + } Leads to a confidence interval and test procedure concerning (the expected value of Y when x = x ^ { + } )) B) The variable T = \left[ \hat { Y } - \left( \beta _ { 0 } + \beta _ { 1 } x ^ { +} \right) \right] / S _ { \dot { y } } Has a t distribution with n - 1 degrees of Freedom, where n is the sample size and x ^ { + } Is a specified value of the independent variable x. C) A 100 ( 1 - \alpha ) \% Confidence interval for ; the expected value of Y when x = x ^ { + } , is given by Where n is the sample size. D) All of the above statements are true. E) None of the above statements are true. <div style=padding-top: 35px>](https://d2lvgg3v3hfg70.cloudfront.net/TB3498/11eb0e05_3e9d_db06_9431_cd97e33b9b3d_TB3498_11.jpg)
(the expected value of Y when
))
B) The variable T =
Has a t distribution with n - 1 degrees of Freedom, where n is the sample size and
Is a specified value of the independent variable x.
C) A 100
Confidence interval for![<strong>Which of the above statements are not true?</strong> A) A t variable obtained by standardizing \hat { \beta } _ { 0 } + \hat { \beta } _ { 1 } x ^ { + } Leads to a confidence interval and test procedure concerning (the expected value of Y when x = x ^ { + } )) B) The variable T = \left[ \hat { Y } - \left( \beta _ { 0 } + \beta _ { 1 } x ^ { +} \right) \right] / S _ { \dot { y } } Has a t distribution with n - 1 degrees of Freedom, where n is the sample size and x ^ { + } Is a specified value of the independent variable x. C) A 100 ( 1 - \alpha ) \% Confidence interval for ; the expected value of Y when x = x ^ { + } , is given by Where n is the sample size. D) All of the above statements are true. E) None of the above statements are true. <div style=padding-top: 35px>](https://d2lvgg3v3hfg70.cloudfront.net/TB3498/11eb0e05_3e9e_021b_9431_e32b6ef36446_TB3498_11.jpg)
; the expected value of Y when
, is given by![<strong>Which of the above statements are not true?</strong> A) A t variable obtained by standardizing \hat { \beta } _ { 0 } + \hat { \beta } _ { 1 } x ^ { + } Leads to a confidence interval and test procedure concerning (the expected value of Y when x = x ^ { + } )) B) The variable T = \left[ \hat { Y } - \left( \beta _ { 0 } + \beta _ { 1 } x ^ { +} \right) \right] / S _ { \dot { y } } Has a t distribution with n - 1 degrees of Freedom, where n is the sample size and x ^ { + } Is a specified value of the independent variable x. C) A 100 ( 1 - \alpha ) \% Confidence interval for ; the expected value of Y when x = x ^ { + } , is given by Where n is the sample size. D) All of the above statements are true. E) None of the above statements are true. <div style=padding-top: 35px>](https://d2lvgg3v3hfg70.cloudfront.net/TB3498/11eb0e05_3e9e_021d_9431_8d6906324847_TB3498_11.jpg)
![<strong>Which of the above statements are not true?</strong> A) A t variable obtained by standardizing \hat { \beta } _ { 0 } + \hat { \beta } _ { 1 } x ^ { + } Leads to a confidence interval and test procedure concerning (the expected value of Y when x = x ^ { + } )) B) The variable T = \left[ \hat { Y } - \left( \beta _ { 0 } + \beta _ { 1 } x ^ { +} \right) \right] / S _ { \dot { y } } Has a t distribution with n - 1 degrees of Freedom, where n is the sample size and x ^ { + } Is a specified value of the independent variable x. C) A 100 ( 1 - \alpha ) \% Confidence interval for ; the expected value of Y when x = x ^ { + } , is given by Where n is the sample size. D) All of the above statements are true. E) None of the above statements are true. <div style=padding-top: 35px>](https://d2lvgg3v3hfg70.cloudfront.net/TB3498/11eb0e05_3e9e_292e_9431_f74099eb84e7_TB3498_11.jpg)
Where n is the sample size.
D) All of the above statements are true.
E) None of the above statements are true.
A) A t variable obtained by standardizing
Leads to a confidence interval and test procedure concerning
(the expected value of Y when
))
B) The variable T =
Has a t distribution with n - 1 degrees of Freedom, where n is the sample size and
Is a specified value of the independent variable x.
C) A 100
Confidence interval for
; the expected value of Y when
, is given by
Where n is the sample size.
D) All of the above statements are true.
E) None of the above statements are true.
Question
Question
Question
Question
Question
Question
Question
Question
Question
Which of the following statements are true?
A) The assumptions of the simple linear regression model imply that the standardized variable
Has a t distribution with n - 2 degrees of freedom.
B) The estimated standard error of
; namely
, will tend to be small when there is little variability in the distribution of
And large otherwise.
C) There is an estimated standard error for the statistic
From which a confidence interval for the intercept
Of the population regression line can be calculated.
D) The most commonly encountered pair of hypotheses about the slope
Of the population regression line is
E) All of the above statements are true.
Question
Which of the following statements are not true?
A) The model utility test is the test of
In which case the test statistic value is the t ratio t =
)
B) The null hypothesis
Can be tested against the alternative hypothesis
By constructing an ANOVA table and rejecting
If the test statistic value
, when n is the sample size.
C) The simple linear regression model should not be used for further inferences (estimates of mean value or predictions of future values) unless the model utility test results in acceptance of
For a suitably small significance level
)
D) All of the above statements are true.
E) None of the above statements are true.
Question
Question
Question
Question
Which of the following statements are not true?
A) Let
Where
Is some fixed value of x, then the mean value of
Is E(
) =
)
B)
Is an unbiased estimator for
(i)e., for
)
C) The estimation
For
Is more precise when
Is near the center of the
's then when it is far from the x values at which observations have been made.
D) All of the above statements are true.
E) None of the above statements are true.
Question
Question

Unlock Deck
Sign up to unlock the cards in this deck!
Unlock Deck
Unlock Deck
1/106
Play
Full screen (f)
Deck 12: Simple Linear Regression and Correlation
1
The estimated regression line or least squares line for the simple linear regression model is the line whose equation is given by __________.

2
In the simple linear regression model Y = the quantity E is a random variable, assumed to be normally distributed with E( ) = 0, and V( ) = . The estimated standard error of (the least squares estimated of ), denoted by , is __________ divided by __________, where .
the quantity E is a random variable, assumed to be normally distributed with E( ) = 0, and V( ) = . The estimated standard error of (the least squares estimated of ), denoted by , is __________ divided by __________, where .s, 
3
In the simple linear regression model the quantity E is a random variable, assumed to be normally distributed with E( ) = 0 and V( ) = . The estimator has a __________ distribution, because it is a linear function of independent __________ random variables.
the quantity E is a random variable, assumed to be normally distributed with E( ) = 0 and V( ) = . The estimator has a __________ distribution, because it is a linear function of independent __________ random variables.normal, normal
4
In simple linear regression analysis, a quantitative measure of the total amount of variation in observed y values is given by the __________, denoted by __________.
Unlock Deck
Unlock for access to all 106 flashcards in this deck.
Unlock Deck
k this deck
5
The assumptions of the simple of the simple linear regression model imply that the standardized variable has a t distribution with __________ degrees of freedom.
has a t distribution with __________ degrees of freedom. Unlock Deck
Unlock for access to all 106 flashcards in this deck.
Unlock Deck
k this deck
6
If y = -2x - 8, then the y-intercept is __________.
Unlock Deck
Unlock for access to all 106 flashcards in this deck.
Unlock Deck
k this deck
7
If then the least squares estimate of the slope coefficient of the true regression line = __________.
then the least squares estimate of the slope coefficient of the true regression line = __________. Unlock Deck
Unlock for access to all 106 flashcards in this deck.
Unlock Deck
k this deck
8
The vertical deviations from the estimated regression line are referred to as the __________.
from the estimated regression line are referred to as the __________. Unlock Deck
Unlock for access to all 106 flashcards in this deck.
Unlock Deck
k this deck
9
If SSE = 36 and SST = 500, then the proportion of total variation that can be explained by the simple linear regression model is_ _________.
Unlock Deck
Unlock for access to all 106 flashcards in this deck.
Unlock Deck
k this deck
10
If then the least squares estimate of the slope coefficient of the true regression line = __________.
then the least squares estimate of the slope coefficient of the true regression line = __________. Unlock Deck
Unlock for access to all 106 flashcards in this deck.
Unlock Deck
k this deck
11
A first step in a regression analysis involving two variables is to construct a __________. In such a plot, each (x,y) is represented as a point plotted on a two-dimensional coordinate system.
Unlock Deck
Unlock for access to all 106 flashcards in this deck.
Unlock Deck
k this deck
12
In simple linear regression analysis, the __________, denoted by __________, can be interpreted as a measure of how much variability in y left unexplained by the model - that is, how much cannot be attributed to a linear relationship.
Unlock Deck
Unlock for access to all 106 flashcards in this deck.
Unlock Deck
k this deck
13
In a simple linear regression problem, the following statistics are given: Then, the error sum of squares is __________.
Then, the error sum of squares is __________. Unlock Deck
Unlock for access to all 106 flashcards in this deck.
Unlock Deck
k this deck
14
In simple linear regression analysis, SST is the total sum of squares, SSE is the error sum of squares, and SSR is the regression sum of squares. The coefficient of determination is given by
is given by Unlock Deck
Unlock for access to all 106 flashcards in this deck.
Unlock Deck
k this deck
15
Since the mean of is an __________ estimator of .
is an __________ estimator of . Unlock Deck
Unlock for access to all 106 flashcards in this deck.
Unlock Deck
k this deck
16
If then the least squares estimate of the intercept of the true regression line = __________.
then the least squares estimate of the intercept of the true regression line = __________. Unlock Deck
Unlock for access to all 106 flashcards in this deck.
Unlock Deck
k this deck
17
The simple linear regression model is is a random variable assumed to be __________ distributed, with
is a random variable assumed to be __________ distributed, with Unlock Deck
Unlock for access to all 106 flashcards in this deck.
Unlock Deck
k this deck
18
When the estimated regression line is obtained via the principle of least squares, the sum of the residuals (i = 1, 3, …….., n) should in theory be __________.
(i = 1, 3, …….., n) should in theory be __________. Unlock Deck
Unlock for access to all 106 flashcards in this deck.
Unlock Deck
k this deck
19
In general, the variable whose value is fixed by the experimenter will be denoted by x and will be called the independent, predictor, or __________ variable. For fixed x, the second variable will be random; we denote this random variable and its observed value by Y and y, respectively, and refer to it as the dependent or __________ variable.
Unlock Deck
Unlock for access to all 106 flashcards in this deck.
Unlock Deck
k this deck
20
If y = 2x + 5, then y__________ by __________when x increases by 1.
Unlock Deck
Unlock for access to all 106 flashcards in this deck.
Unlock Deck
k this deck
21
In a simple linear regression, the most commonly encountered pair of hypotheses about is A test of these two hypotheses is often referred to as the __________.
is A test of these two hypotheses is often referred to as the __________. Unlock Deck
Unlock for access to all 106 flashcards in this deck.
Unlock Deck
k this deck
22
Given that , and n = 15, the 95% confidence interval for the slope of the true regression line (__________,__________).
, and n = 15, the 95% confidence interval for the slope of the true regression line (__________,__________). Unlock Deck
Unlock for access to all 106 flashcards in this deck.
Unlock Deck
k this deck
23
The __________ is a measure of how strongly related two variables x and y are in a sample.
Unlock Deck
Unlock for access to all 106 flashcards in this deck.
Unlock Deck
k this deck
24
The validity of joint or simultaneous confidence intervals for the expected value of Y when rests on a probability result called the __________ inequality, so the joint confidence intervals are referred to as __________ intervals.
rests on a probability result called the __________ inequality, so the joint confidence intervals are referred to as __________ intervals. Unlock Deck
Unlock for access to all 106 flashcards in this deck.
Unlock Deck
k this deck
25
In testing the test statistic value is the t - ratio t = __________ divided by __________.
the test statistic value is the t - ratio t = __________ divided by __________. Unlock Deck
Unlock for access to all 106 flashcards in this deck.
Unlock Deck
k this deck
26
If the confidence interval . For the expected value of Y when is computed both for x = a and for x = b to obtain joint confidence intervals for then the joint confidence coefficient on the resulting pair of intervals is at least __________ %.
confidence interval . For the expected value of Y when is computed both for x = a and for x = b to obtain joint confidence intervals for then the joint confidence coefficient on the resulting pair of intervals is at least __________ %. Unlock Deck
Unlock for access to all 106 flashcards in this deck.
Unlock Deck
k this deck
27
The sample correlation coefficient r equals -1 if and only if all pairs lie on a straight line with __________ slope.
pairs lie on a straight line with __________ slope. Unlock Deck
Unlock for access to all 106 flashcards in this deck.
Unlock Deck
k this deck
28
A 100(1 - ) % confidence interval for the slope of the true regression line is __________ .
) % confidence interval for the slope of the true regression line is __________ . Unlock Deck
Unlock for access to all 106 flashcards in this deck.
Unlock Deck
k this deck
29
In testing the t test statistic value is found to be t = 2.15. Should the null hypothesis be tested by constructing an ANOVA table, the F test would result in a test statistic value f = __________.
the t test statistic value is found to be t = 2.15. Should the null hypothesis be tested by constructing an ANOVA table, the F test would result in a test statistic value f = __________. Unlock Deck
Unlock for access to all 106 flashcards in this deck.
Unlock Deck
k this deck
30
In testing using a sample of 18 observations, the rejection region for .025 level test is __________.
using a sample of 18 observations, the rejection region for .025 level test is __________. Unlock Deck
Unlock for access to all 106 flashcards in this deck.
Unlock Deck
k this deck
31
Given n pairs of observations if large x's are paired with large y's and small x's are paired with small y's, then a __________ relationship between the variables is implied. Similarly, it is natural to speak of x and y having a __________ relationship if large x's are paired with small y's and small x's are paired with large y's.
if large x's are paired with large y's and small x's are paired with small y's, then a __________ relationship between the variables is implied. Similarly, it is natural to speak of x and y having a __________ relationship if large x's are paired with small y's and small x's are paired with large y's. Unlock Deck
Unlock for access to all 106 flashcards in this deck.
Unlock Deck
k this deck
32
The sample correlation coefficient r equals 1 if and only if all pairs lie on a straight line with __________ slope.
pairs lie on a straight line with __________ slope. Unlock Deck
Unlock for access to all 106 flashcards in this deck.
Unlock Deck
k this deck
33
The value of the sample correlation coefficient r is always between __________ and __________.
Unlock Deck
Unlock for access to all 106 flashcards in this deck.
Unlock Deck
k this deck
34
A confidence interval refers to a parameter, or population characteristic, whose value is fixed but unknown to us. In contrast, a future value of Y is not a parameter but instead a random variable; for this reason we refer to an interval of plausible values for a future Y as a __________ rather than a confidence interval.
Unlock Deck
Unlock for access to all 106 flashcards in this deck.
Unlock Deck
k this deck
35
The null hypothesis can be tested against by constructing an ANOVA table, and rejecting level of significance if the test statistic value f __________, where n is the sample size.
can be tested against by constructing an ANOVA table, and rejecting level of significance if the test statistic value f __________, where n is the sample size. Unlock Deck
Unlock for access to all 106 flashcards in this deck.
Unlock Deck
k this deck
36
The t critical value for a confidence level of 90% for the slope of the regression line, based on a sample of size 20, is t = __________.
of the regression line, based on a sample of size 20, is t = __________. Unlock Deck
Unlock for access to all 106 flashcards in this deck.
Unlock Deck
k this deck
37
Let where is some fixed value of x. Then, the mean value of is __________.
where is some fixed value of x. Then, the mean value of is __________. Unlock Deck
Unlock for access to all 106 flashcards in this deck.
Unlock Deck
k this deck
38
In testing using a sample of 15 observations, the rejection region for .05 level test is either __________ or __________.
using a sample of 15 observations, the rejection region for .05 level test is either __________ or __________. Unlock Deck
Unlock for access to all 106 flashcards in this deck.
Unlock Deck
k this deck
39
If the sample correlation coefficient r equals -.80, then the value of the coefficient of determinations is __________.
Unlock Deck
Unlock for access to all 106 flashcards in this deck.
Unlock Deck
k this deck
40
Both the confidence interval for , the expected value of Y when and prediction interval for a future Y observation to be made when are __________ for an near than for an far from .
, the expected value of Y when and prediction interval for a future Y observation to be made when are __________ for an near than for an far from . Unlock Deck
Unlock for access to all 106 flashcards in this deck.
Unlock Deck
k this deck
41
Which of the following statements are not true?
A) The predicted value
Is the value of y that we would predict or expect when using the estimated regression line with
B) The predicted value
Is the height of the estimated regression line above the value
For which the
Observation was made.
C) The residual
Is the difference between the observed
And the predicted
D) If the residuals are all large in magnitude, then much of the variability in observed y values appears to be due to the linear relationship between x and y, whereas many small residuals suggest quite a bit of inherent variability in y relative to the amount due to the linear relation.
E) All of the above statements are true.
Unlock Deck
Unlock for access to all 106 flashcards in this deck.
Unlock Deck
k this deck
42
Which of the following statements are true?
A) Before the least squares estimates
Are computed, a scatter plot should be examined to see whether a linear probabilistic model is plausible.
B) For a fixed
(the height of the estimated regression line above
) gives either a point estimate of the expected value of Y when
Or a point prediction of the Y value that will result from a single new observation made at
)
C) The least squares regression line should not be used to make a prediction for an x value much beyond the range of the data x values.
D) The residuals are the vertical deviations
From the estimated regression line.
E) All of the above statements are true.
Unlock Deck
Unlock for access to all 106 flashcards in this deck.
Unlock Deck
k this deck
43
In simple linear regression model which of the following statements are not required assumptions about the random error term
?
A) The expected value of
Is zero.
B) The variance of
Is the same for all values of the independent variable x.
C) The error term is normally distributed.
D) The values of the error term are independent of one another.
E) All of the above are required assumptions about
)
?
A) The expected value of
Is zero.
B) The variance of
Is the same for all values of the independent variable x.
C) The error term is normally distributed.
D) The values of the error term are independent of one another.
E) All of the above are required assumptions about
)
Unlock Deck
Unlock for access to all 106 flashcards in this deck.
Unlock Deck
k this deck
44
Which of the following statements are true?
A) The simplest deterministic mathematical relationship between two variables x and y is a linear relationship
B) The set of pairs (x, y) for which
Determines a straight line with slope
And y-intercept
)
C) The slope of a line
Is the change in y per a 1-unit increase in x.
D) The y-intercept of a line
Is the height at which the line crosses the vertical axis and is obtained by setting x = 0 in the equation.
E) All of the above statements are true.
Unlock Deck
Unlock for access to all 106 flashcards in this deck.
Unlock Deck
k this deck
45
If then the sample correlation coefficient r equals __________.
then the sample correlation coefficient r equals __________. Unlock Deck
Unlock for access to all 106 flashcards in this deck.
Unlock Deck
k this deck
46
If then the least squares estimate of the slope coefficient of the true regression line is
A) 18.75
B) 28.42
C) 9.15
D) 9.76
E) 10.50
A) 18.75
B) 28.42
C) 9.15
D) 9.76
E) 10.50
Unlock Deck
Unlock for access to all 106 flashcards in this deck.
Unlock Deck
k this deck
47
Which of the following statements are not true?
A) In regression analysis, the independent variable is also referred to as the predictor or explanatory variable.
B) In regression analysis, the dependent variable is also referred to as the response variable.
C) A first step in a regression analysis involving two variables is to construct a scatter plot.
D) The simple linear regression model is
Where the quantity
Is a random variable, assumed to be normally distributed with
E) All of the above statements are true.
Unlock Deck
Unlock for access to all 106 flashcards in this deck.
Unlock Deck
k this deck
48
In testing using a sample of size 25, the test statistic value is found to be t = 2.50. The corresponding P-value for the test is __________, and we __________ when
using a sample of size 25, the test statistic value is found to be t = 2.50. The corresponding P-value for the test is __________, and we __________ when Unlock Deck
Unlock for access to all 106 flashcards in this deck.
Unlock Deck
k this deck
49
Which of the following statements are true?
A) The true regression line
Is the line of mean values.
B) The height of the true regression line
Above any particular x value is the expected value of Y for that value of x.
C) The slope
Of the true regression line
Is interpreted as the expected change in Y associated with a 1-unit increase in the value of x.
D) The equation
States that the amount of variability in the distribution of Y values is the same at each different value of x (homogeneity of variance).
E) All of the above statements are true.
Unlock Deck
Unlock for access to all 106 flashcards in this deck.
Unlock Deck
k this deck
50
The principle of least squares results in values of that minimizes the sum of squared deviations between
A) the observed values of the explanatory variable x and the estimated values
B) the observed values of the response variable y and the estimated values
C) the observed values of the explanatory variable x and the response variable y
D) the observed values of the explanatory variable x and the response values
E) the estimated values of the explanatory variable x and the observed values of the response variable y
Unlock Deck
Unlock for access to all 106 flashcards in this deck.
Unlock Deck
k this deck
51
Which of the following statements are not true if ?
A) The y-intercept is 7
B) y decreases by 3 when x increases by 4
C) y decreases by 3 when x increases by 1
D) The slope of the line is -3
E) All of the above statements are not true.
A) The y-intercept is 7
B) y decreases by 3 when x increases by 4
C) y decreases by 3 when x increases by 1
D) The slope of the line is -3
E) All of the above statements are not true.
Unlock Deck
Unlock for access to all 106 flashcards in this deck.
Unlock Deck
k this deck
52
A procedure used to estimate the regression parameters and to find the least squares line which provides the best approximation for the relationship between the explanatory variable x and the response variable Y is known as the
A) least squares method
B) best squares method
C) regression analysis method
D) coefficient of determination method
E) prediction analysis method
A) least squares method
B) best squares method
C) regression analysis method
D) coefficient of determination method
E) prediction analysis method
Unlock Deck
Unlock for access to all 106 flashcards in this deck.
Unlock Deck
k this deck
53
A reasonable rule of thumb is to say that the correlation is weak if __________ __________, strong if __________ __________, and moderate otherwise.
__________, strong if __________ __________, and moderate otherwise. Unlock Deck
Unlock for access to all 106 flashcards in this deck.
Unlock Deck
k this deck
54
When is true, the test statistic has a t distribution with __________ degrees of Freedom, where n is the sample size.
is true, the test statistic has a t distribution with __________ degrees of Freedom, where n is the sample size. Unlock Deck
Unlock for access to all 106 flashcards in this deck.
Unlock Deck
k this deck
55
Which of the following statements are not true regarding the normal equations ?
A) The normal equations are linear in the unknowns
)
B) The least squares estimates are always the unique solution to the system of normal equations.
C) Provided that at least two of the
Values are different, the least squares estimates are the unique solution to the system of normal equations.
D) The quantity
Is not needed to solve the system of normal equations.
E) All of the above statements are true.
Unlock Deck
Unlock for access to all 106 flashcards in this deck.
Unlock Deck
k this deck
56
If then the least squares estimate of the slope coefficient of the true regression line is
A) 11.314
B) 8.944
C) 1.600
D) 0.625
E) cannot be determined from the given information
A) 11.314
B) 8.944
C) 1.600
D) 0.625
E) cannot be determined from the given information
Unlock Deck
Unlock for access to all 106 flashcards in this deck.
Unlock Deck
k this deck
57
Which of the following statements are not true?
A) The objective of regression analysis is the exploit the relationship between two (or more) variables so that we can gain information about one of them through knowing values of the other(s).
B) Saying that variables x and y are deterministically related means that once we are told the value of x, the value of y is completely specified.
C) Regression analysis is the part of statistics that deals with investigation of the relationship between two or more variables related in a deterministic fashion.
D) All of the above statements are true.
E) None of the above statements are true.
Unlock Deck
Unlock for access to all 106 flashcards in this deck.
Unlock Deck
k this deck
58
If then the least squares estimate of the slope coefficient of the true regression line is
A) 3.60
B) 0.75
C) 1.33
D) 4.80
E) 1.68
A) 3.60
B) 0.75
C) 1.33
D) 4.80
E) 1.68
Unlock Deck
Unlock for access to all 106 flashcards in this deck.
Unlock Deck
k this deck
59
The simple linear regression model is where
is a random variable assumed to be normally distributed with Let denote a particular value of the independent variable x. Which of the following identities are true regarding the expected or mean value of Y when ?
A)
B)
C)
D)
E)
is a random variable assumed to be normally distributed with Let denote a particular value of the independent variable x. Which of the following identities are true regarding the expected or mean value of Y when ?
A)
B)
C)
D)
E)
Unlock Deck
Unlock for access to all 106 flashcards in this deck.
Unlock Deck
k this deck
60
The simple linear regression model is is a random variable assumed to be normally distributed with denote a particular value of the independent variable x. Which of the following identities are true regarding the variance of Y when ?
A)
B)
C)
D)
E)
A)
B)
C)
D)
E)
Unlock Deck
Unlock for access to all 106 flashcards in this deck.
Unlock Deck
k this deck
61
Which of the following statements are true?
A) The confidence interval for
; the expected value of Y when
Is centered at the point estimate for
And extends out to each side by an amount that depends on the confidence level and on the extent of variability in the estimator on which the point estimated is based.
B) In some situations, a confidence interval is desired not just for a single x value but for two or more x values.
C) The joint or simultaneous confidence level for a set of K Bonferroni intervals is guaranteed to be at least 100(1 - K
)%)
D) We refer to an interval of plausible values for a future Y as a prediction interval rather than a confidence interval, since a future value of Y is a random variable.
E) All of the above statements are true.
Unlock Deck
Unlock for access to all 106 flashcards in this deck.
Unlock Deck
k this deck
62
Which of the following statements are not true?
A)
, where
Is a specified value of the independent variable x, can be regarded either as a point estimate of
(the expected or true average value of Y when
) or as a prediction of the Y value that will result from a single observation made when
)
B) Before we obtain sample data, both
And
Are subject to sampling variability - that is, they are both statistics whose values will vary from sample to sample.
C) A confidence interval for a mean y value in regression is based on properties of the sampling distribution of the statistic
)
D) All of the above statements are true.
E) None of the above statements are true.
Unlock Deck
Unlock for access to all 106 flashcards in this deck.
Unlock Deck
k this deck
63
In testing versus using a sample of 20 observations, the rejection region for .01 level of significance test is
A) t
-2)878
B) t
2)878
C) -2.878
T
2)878
D) either t
2)878 or t
-2)878
E) t = 0
A) t
-2)878
B) t
2)878
C) -2.878
T
2)878
D) either t
2)878 or t
-2)878
E) t = 0
Unlock Deck
Unlock for access to all 106 flashcards in this deck.
Unlock Deck
k this deck
64
Which of the above statements are not true?
A) A t variable obtained by standardizing
Leads to a confidence interval and test procedure concerning
(the expected value of Y when
))
B) The variable T =
Has a t distribution with n - 1 degrees of Freedom, where n is the sample size and
Is a specified value of the independent variable x.
C) A 100
Confidence interval for
; the expected value of Y when
, is given by
Where n is the sample size.
D) All of the above statements are true.
E) None of the above statements are true.
Unlock Deck
Unlock for access to all 106 flashcards in this deck.
Unlock Deck
k this deck
65
A 95% confidence interval for the expected value of Y is constructed first for x = 2, then for x = 3, then for x = 4, and finally for x = 5. This yields a set of four confidence intervals for which the joint or simultaneous confidence level is guaranteed to be at least
A) 95%
B) 90%
C) 85%
D) 80%
E) 75%
A) 95%
B) 90%
C) 85%
D) 80%
E) 75%
Unlock Deck
Unlock for access to all 106 flashcards in this deck.
Unlock Deck
k this deck
66
The quantity
in the simple linear regression model is a random variable, assumed to be normally distributed with The estimated standard deviation is given by
A) SSE / (n - 2)
B)
C)
D)
E)
in the simple linear regression model is a random variable, assumed to be normally distributed with The estimated standard deviation is given by
A) SSE / (n - 2)
B)
C)
D)
E)
Unlock Deck
Unlock for access to all 106 flashcards in this deck.
Unlock Deck
k this deck
67
Which of the following statements are not true?
A) The slope
Of the population regression line is the true average change in the independent variable x associated with a 1 - unit increase in the dependent variable y.
B) The slope of the least squares line,
Of the population regression line.
C) Inferences about the slope
Of the population regression line are based on thinking of the slope
Of the least squares line as a statistic and investigating its sampling distribution.
D) All of the above statements are true
E) Non of the above statements are true.
Unlock Deck
Unlock for access to all 106 flashcards in this deck.
Unlock Deck
k this deck
68
Which of the following statements are not correct?
A) The coefficient of determination, denoted by ,
Is interpreted as the proportion of observed y variation that cannot be explained by the simple linear regression model.
B) The higher the value of the coefficient of determination, the more successful is the simple linear regression model in explaining y variation.
C) If the coefficient of determination is small, an analyst will usually want to search for an alternative model (either a nonlinear model or a multiple regression model that involves more than a single independent variable).
D) The coefficient of determination can be calculated as the ratio of the regression sum of squares (SSR) to the total sum of squares.
E) All of the above statements are correct.
Unlock Deck
Unlock for access to all 106 flashcards in this deck.
Unlock Deck
k this deck
69
Which of the following statements are true?
A) The denominator of the slope
Of the least squares line is
, which is a constant since it depends only on the
And not on the
B) The slope
Of the least squares line is a linear function of the "independent" random variables
Each of which is normally distributed.
C) The distribution of the slope
Of the least squares line is always centered at the value of the slope
Of the population regression line.
D) All of the above statements are true.
E) None of the above statements are true.
Unlock Deck
Unlock for access to all 106 flashcards in this deck.
Unlock Deck
k this deck
70
If the error sum of squares is 12 and the total sum of squares is 400, then the proportion of observed y variation explained by the simple linear regression model is
A) 0.030
B) 0.173
C) 0.970
D) 0.985
E) None of the above answers are correct.
A) 0.030
B) 0.173
C) 0.970
D) 0.985
E) None of the above answers are correct.
Unlock Deck
Unlock for access to all 106 flashcards in this deck.
Unlock Deck
k this deck
71
In testing using a sample of 22 observations, the test statistic value is found to be t = -2.528. the approximated P-value of the test is
A) .01
B) .02
C) .025
D) .05
E) .99
A) .01
B) .02
C) .025
D) .05
E) .99
Unlock Deck
Unlock for access to all 106 flashcards in this deck.
Unlock Deck
k this deck
72
In simple linear regression analysis, if the residual sum of squares is zero, then the coefficient of determination must be
A) -1
B) 0
C) between -1 and zero
D) 1
E) between -1 and 1
A) -1
B) 0
C) between -1 and zero
D) 1
E) between -1 and 1
Unlock Deck
Unlock for access to all 106 flashcards in this deck.
Unlock Deck
k this deck
73
Which of the following statements are true?
A) The assumptions of the simple linear regression model imply that the standardized variable
Has a t distribution with n - 2 degrees of freedom.
B) The estimated standard error of
; namely
, will tend to be small when there is little variability in the distribution of
And large otherwise.
C) There is an estimated standard error for the statistic
From which a confidence interval for the intercept
Of the population regression line can be calculated.
D) The most commonly encountered pair of hypotheses about the slope
Of the population regression line is
E) All of the above statements are true.
Unlock Deck
Unlock for access to all 106 flashcards in this deck.
Unlock Deck
k this deck
74
Which of the following statements are not true?
A) The model utility test is the test of
In which case the test statistic value is the t ratio t =
)
B) The null hypothesis
Can be tested against the alternative hypothesis
By constructing an ANOVA table and rejecting
If the test statistic value
, when n is the sample size.
C) The simple linear regression model should not be used for further inferences (estimates of mean value or predictions of future values) unless the model utility test results in acceptance of
For a suitably small significance level
)
D) All of the above statements are true.
E) None of the above statements are true.
Unlock Deck
Unlock for access to all 106 flashcards in this deck.
Unlock Deck
k this deck
75
Which of the following statements are not true?
A) The slope
Of the least squares line is an unbiased estimator of the slope coefficient
Of the true regression line.
B) The variance
Of the least squares line equals the variance
Of the random error
Divided by
, where
C) Values of
All close to one another imply a highly variable estimator
Of the slope
Of the true regression line.
D) Values of
That are quite spread out results in a more precise estimator
Of the slope
Of the true regression line
E) All of the above statements are true
Unlock Deck
Unlock for access to all 106 flashcards in this deck.
Unlock Deck
k this deck
76
The quantity
in the simple linear regression model is a random variable, assumed to be normally distributed with Based on 20 observations, if the residual sum of squares is 8, then the estimated standard deviation is
A) 2.500
B) 0.400
C) 0.667
D) 0.444
E) None of the above answers are correct.
in the simple linear regression model is a random variable, assumed to be normally distributed with Based on 20 observations, if the residual sum of squares is 8, then the estimated standard deviation is
A) 2.500
B) 0.400
C) 0.667
D) 0.444
E) None of the above answers are correct.
Unlock Deck
Unlock for access to all 106 flashcards in this deck.
Unlock Deck
k this deck
77
Which of the following statements are not true?
A) The total sum of squares is the sum of squared deviations about the sample mean of the observed y values.
B) The error sum of squares is the sum of squared deviations about the least squares line
C) The ratio of the error sum of squares to the total sum of squares is the proportion of total variation that cannot be explained by the simple linear regression model.
D) The sum of squared deviations about the least squares regression line is always smaller than the sum of squared deviations about any other line.
E) All of the above statements are true.
Unlock Deck
Unlock for access to all 106 flashcards in this deck.
Unlock Deck
k this deck
78
Which of the following statements are not true?
A) Let
Where
Is some fixed value of x, then the mean value of
Is E(
) =
)
B)
Is an unbiased estimator for
(i)e., for
)
C) The estimation
For
Is more precise when
Is near the center of the
's then when it is far from the x values at which observations have been made.
D) All of the above statements are true.
E) None of the above statements are true.
Unlock Deck
Unlock for access to all 106 flashcards in this deck.
Unlock Deck
k this deck
79
In testing the rejection region for .05 level of significance test is
A) z
1)645
B) z
-1)645
C) -1.645
Z
1)645
D) either z
1)645 or z
-1)645
E) z = 1.96
A) z
1)645
B) z
-1)645
C) -1.645
Z
1)645
D) either z
1)645 or z
-1)645
E) z = 1.96
Unlock Deck
Unlock for access to all 106 flashcards in this deck.
Unlock Deck
k this deck
80
The test statistic value for testing is found to be z = 1.52. The corresponding P-value for the test is
A) .9357
B) .0643
C) .1286
D) .4357
E) .3714
A) .9357
B) .0643
C) .1286
D) .4357
E) .3714
Unlock Deck
Unlock for access to all 106 flashcards in this deck.
Unlock Deck
k this deck
Unlock Deck
Unlock for access to all 106 flashcards in this deck.


