Deck 13: Nonlinear and Multiple Regression
Full screen (f)
Question
In general, with  is the error sum of squares from a kth degree polynomial,
  ____________
  , and
, and  ____________
  whenever
  > k.
> k.
is the error sum of squares from a kth degree polynomial, ____________ , and ____________ whenever > k. Question
With  , the sum of squared residuals (error sum of squares) is
  . Hence the mean square error is MSE =__________/___________.
, the sum of squared residuals (error sum of squares) is . Hence the mean square error is MSE =__________/___________. Question
Question
The principle__________selects  and
and  to minimize
  .
.
and to minimize . Question
The transformation __________ is used to linearize the function 
Question
The additive exponential and power models,  and
and  are ___________ linear.
and are ___________ linear. Question
If we let  , and
, and  , then SSE/SST is the proportion of the total variation in the observed
  's that is ___________by the polynomial model.
, and , then SSE/SST is the proportion of the total variation in the observed 's that is ___________by the polynomial model. Question
If  = .75 is the value of the coefficient of multiple determination from a cubic regression model and that n =15, then the adjusted
  value is _____________.
= .75 is the value of the coefficient of multiple determination from a cubic regression model and that n =15, then the adjusted value is _____________. Question
The regression coefficient  in the multiple regression model
  is interpreted as the expected change in ___________ associated with a 1-unit increase in ___________,while___________ are held fixed.
in the multiple regression model is interpreted as the expected change in ___________ associated with a 1-unit increase in ___________,while___________ are held fixed. Question
The function  has been found quite useful in many applications. This function is well known as the ___________function.
has been found quite useful in many applications. This function is well known as the ___________function. Question
A function relating y to x is ___________ if by means of a transformation on x and / or y, the function can be expressed as  , where
  is the transformed independent variable and
  is the transformed dependent variable.
, where is the transformed independent variable and is the transformed dependent variable. Question
If the regression parameters  and
and  are estimated by minimizing the expression
  , where the
  's are weights that decrease with increasing
  , this yields____________estimates.
and are estimated by minimizing the expression , where the 's are weights that decrease with increasing , this yields____________estimates. Question
The kth -degree polynomial regression model equation is  , where
  is a normally distributed random variable with
  = ___________ and
  = ___________
, where is a normally distributed random variable with = ___________ and = ___________ Question
The transformation __________ is used to linearize the reciprocal function 
Question
Question
If we let  , and
, and  , then 1-SSE/SST is the proportion of the total variation in the observed
  's that is __________ by the polynomial model. It is called the ____________ ,and is denoted by R .
, and , then 1-SSE/SST is the proportion of the total variation in the observed 's that is __________ by the polynomial model. It is called the ____________ ,and is denoted by R . Question
In logistic regression it can be shown that  . The expression on the left-hand side of this equality is well known as the ___________.
. The expression on the left-hand side of this equality is well known as the ___________. Question
Many statisticians recommend __________ for an assessment of model validity and usefulness. These include plotting the residuals  or standardized residuals
  on the vertical axis versus the independent variable
  or fitted values
  on the horizontal axis.
or standardized residuals on the vertical axis versus the independent variable or fitted values on the horizontal axis. Question
For the exponential function  , only the __________ variable is transformed via the transformation __________ to achieve linearity.
, only the __________ variable is transformed via the transformation __________ to achieve linearity. Question
The transformation __________ of the dependent variable y and the transformation __________ of the independent variable x are used to linearize the power function 
Question
Question
Question
Question
A multiple regression model with k predictors will include __________ regression parameters, because  will always be included.
will always be included. Question
Question
Question
Question
Question
In many multiple regression data sets, the predictors  are highly interdependent. When the sample
  values can be predicted very well from the other predictor values, for at least one predictor, the data is said to exhibit __________.
are highly interdependent. When the sample values can be predicted very well from the other predictor values, for at least one predictor, the data is said to exhibit __________. Question
Question
Question
Question
Question
Question
Question
Inferences concerning a single parameter  in a multiple regression model with 5 predictors and 25 observations are based on a standardized variable T which has a t distribution with ___________ degrees of freedom.
in a multiple regression model with 5 predictors and 25 observations are based on a standardized variable T which has a t distribution with ___________ degrees of freedom. Question
Question
Question
Question
If  is the error sum of squares computed from a model with k predictors and n observations, then the mean squared error for the model is
  = __________/__________.
is the error sum of squares computed from a model with k predictors and n observations, then the mean squared error for the model is = __________/__________. Question
Question
In multiple regression analysis with n observations and k predictors (or equivalently k+1 parameters), inferences concerning a single parameter are based on the standardized variable  , which has a t-distribution with degrees of freedom equal to
A) n-k+1
B) n-k
C) n-k-1
D) n+k-1
E) n+k+1
, which has a t-distribution with degrees of freedom equal toA) n-k+1
B) n-k
C) n-k-1
D) n+k-1
E) n+k+1
Question
Question
Question
Question
Question
Question
Question
Suppose the variables x=commuting distance and y=commuting time are related according to the simple linear regression model with 
a. If n=5 observations are made at the x values
calculate the standard deviations of the five corresponding residuals.
b. Repeat part (a) for
c. What do the results of parts (a) and (b) imply about the deviation of the estimated line from the observation made at the largest sampled x value?
a. If n=5 observations are made at the x values
calculate the standard deviations of the five corresponding residuals.
b. Repeat part (a) for
c. What do the results of parts (a) and (b) imply about the deviation of the estimated line from the observation made at the largest sampled x value?
Question
Question
Question
Question
Question
Question
Question
Question
Question
Question
Question
Question
It is important to find characteristics of the production process that produce tortilla chips with an appealing texture. The following data on x = frying time (sec) and y = moisture content (%) are obtained: 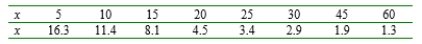
a. Construct a scatter plot of y versus x and comment.
b. Construct a scatter plot of the (In(x), In(y)) pairs and comment.
c. What probabilistic relationship between x and y is suggested by the linear pattern in the plot of part (b)?
d. Predict the value of moisture content when frying time is 20 in a way that conveys information about reliability and precision.
Question
A trucking company considered a multiple regression model for relating the dependent variable y=total daily travel time for one of its drivers (hours) to the predictors  =distance traveled (miles) and
  the number of deliveries made. Suppose that the model equation is
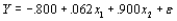
a. What is the mean value of travel time when distance traveled is 50 miles and three deliveries are made?
b. How would interpret
the coefficient of the predictor
? What is the interpretation of
c. If
hour, what is the probability that travel time will be at most 6 hours when three deliveries are made and the distance traveled is 50 miles?
=distance traveled (miles) and the number of deliveries made. Suppose that the model equation is a. What is the mean value of travel time when distance traveled is 50 miles and three deliveries are made?
b. How would interpret
the coefficient of the predictor
? What is the interpretation of
c. If
hour, what is the probability that travel time will be at most 6 hours when three deliveries are made and the distance traveled is 50 miles?
Question
Answer the following questions.
a. Show that![Answer the following questions. a. Show that when the are the residuals from a simple linear regression. b. Are the residuals from a simple linear regression independent of one another, positively correlated, or negatively correlated? Explain. c. Show that for the residuals from a simple linear regression. [This result along with part (a) shows that there are two linear restrictions on the , resulting in a loss of 2 df when the squared residuals are used to estimate ]<div style=padding-top: 35px>](https://d2lvgg3v3hfg70.cloudfront.net/TB3498/11eb0e05_3e80_b64d_9431_8d322b10169d_TB3498_11.jpg)
![Answer the following questions. a. Show that when the are the residuals from a simple linear regression. b. Are the residuals from a simple linear regression independent of one another, positively correlated, or negatively correlated? Explain. c. Show that for the residuals from a simple linear regression. [This result along with part (a) shows that there are two linear restrictions on the , resulting in a loss of 2 df when the squared residuals are used to estimate ]<div style=padding-top: 35px>](https://d2lvgg3v3hfg70.cloudfront.net/TB3498/11eb0e05_3e80_b64e_9431_53038bd4075f_TB3498_11.jpg)
when the![Answer the following questions. a. Show that when the are the residuals from a simple linear regression. b. Are the residuals from a simple linear regression independent of one another, positively correlated, or negatively correlated? Explain. c. Show that for the residuals from a simple linear regression. [This result along with part (a) shows that there are two linear restrictions on the , resulting in a loss of 2 df when the squared residuals are used to estimate ]<div style=padding-top: 35px>](https://d2lvgg3v3hfg70.cloudfront.net/TB3498/11eb0e05_3e80_dd5f_9431_832ac3c29e45_TB3498_11.jpg)
are the residuals from a simple linear regression.
b. Are the residuals from a simple linear regression independent of one another, positively correlated, or negatively correlated? Explain.
c. Show that![Answer the following questions. a. Show that when the are the residuals from a simple linear regression. b. Are the residuals from a simple linear regression independent of one another, positively correlated, or negatively correlated? Explain. c. Show that for the residuals from a simple linear regression. [This result along with part (a) shows that there are two linear restrictions on the , resulting in a loss of 2 df when the squared residuals are used to estimate ]<div style=padding-top: 35px>](https://d2lvgg3v3hfg70.cloudfront.net/TB3498/11eb0e05_3e80_dd60_9431_21e792612e14_TB3498_11.jpg)
for the residuals from a simple linear regression. [This result along with part (a) shows that there are two linear restrictions on the![Answer the following questions. a. Show that when the are the residuals from a simple linear regression. b. Are the residuals from a simple linear regression independent of one another, positively correlated, or negatively correlated? Explain. c. Show that for the residuals from a simple linear regression. [This result along with part (a) shows that there are two linear restrictions on the , resulting in a loss of 2 df when the squared residuals are used to estimate ]<div style=padding-top: 35px>](https://d2lvgg3v3hfg70.cloudfront.net/TB3498/11eb0e05_3e80_dd61_9431_b5f6836925a3_TB3498_11.jpg)
, resulting in a loss of 2 df when the squared residuals are used to estimate![Answer the following questions. a. Show that when the are the residuals from a simple linear regression. b. Are the residuals from a simple linear regression independent of one another, positively correlated, or negatively correlated? Explain. c. Show that for the residuals from a simple linear regression. [This result along with part (a) shows that there are two linear restrictions on the , resulting in a loss of 2 df when the squared residuals are used to estimate ]<div style=padding-top: 35px>](https://d2lvgg3v3hfg70.cloudfront.net/TB3498/11eb0e05_3e81_0472_9431_25b97fbb2dfb_TB3498_11.jpg)
]
a. Show that
when the
are the residuals from a simple linear regression.
b. Are the residuals from a simple linear regression independent of one another, positively correlated, or negatively correlated? Explain.
c. Show that
for the residuals from a simple linear regression. [This result along with part (a) shows that there are two linear restrictions on the
, resulting in a loss of 2 df when the squared residuals are used to estimate
]
Question
Suppose that the expected value of thermal conductivity y is a linear function of  where x is lamellar thickness.
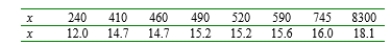
a. Estimate the parameters of the regression function and the regression function itself.
b. Predict the value of thermal conductivity when lamellar thickness is 500 angstroms.
where x is lamellar thickness. a. Estimate the parameters of the regression function and the regression function itself.
b. Predict the value of thermal conductivity when lamellar thickness is 500 angstroms.
Question
An investigation of the influence of sodium benzoate concentration on the critical minimum pH necessary for the inhibition of Fe yielded the accompanying data, which suggests that expected critical minimum pH is linearly related to the natural logarithm of concentrate: 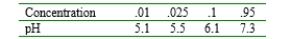
a. What is the implied probabilistic model, and what are the estimates of the model parameters?
b. What critical minimum pH would you predict for a concentration of 1.0? Obtain a 95% PI for critical minimum pH when concentration is 1.0.
a. What is the implied probabilistic model, and what are the estimates of the model parameters?
b. What critical minimum pH would you predict for a concentration of 1.0? Obtain a 95% PI for critical minimum pH when concentration is 1.0.
Question
The viscosity (y) of an oil was measured by a cone and plate viscometer at six different cone speeds (x). It was assumed that a quadratic regression model was appropriate, and the estimated regression function resulting from the n=6 observations was 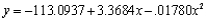
a. Estimate
, the expected viscosity when speed is 75 rpm.
b. What viscosity would you predict for a cone speed of 60 rpm.
c. If
and
compute SSE
d. From part ( c ),
Using SSE computed in part ( c ), what is the computed value of
e. If the estimated standard deviation of
at level .01.
a. Estimate
, the expected viscosity when speed is 75 rpm.
b. What viscosity would you predict for a cone speed of 60 rpm.
c. If
and
compute SSE
d. From part ( c ),
Using SSE computed in part ( c ), what is the computed value of
e. If the estimated standard deviation of
at level .01.
Question
In the accompanying table, we give the smallest SSE for each number of predictors k (k = 1,2,3,4) for a regression problem in which y=cumulative heat of hardening in cement,  =% tricalcium aluminate,
  = % tricalcium silicate,
  = % aluminum ferrate, and
  = % dicalcium silicate.
 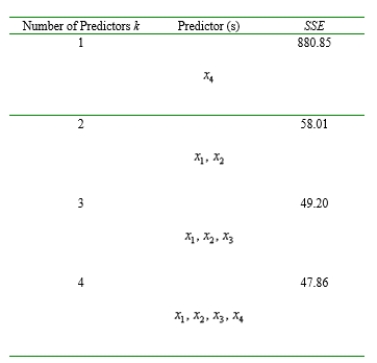 In addition, n=13, and SST=2715.16.
a. Use the criteria discussed in the text to recommend the use of a particular regression model.
b. Would forward selection result in the best two-predictor model? Explain.
=% tricalcium aluminate, = % tricalcium silicate, = % aluminum ferrate, and = % dicalcium silicate. In addition, n=13, and SST=2715.16. a. Use the criteria discussed in the text to recommend the use of a particular regression model.
b. Would forward selection result in the best two-predictor model? Explain.
Question
Wear resistance of certain nuclear reactor components made of Zircaloy-2 is partly determined by properties of the oxide layer. The following data appears in a study that proposed a new nondestructive testing method to monitor thickness of the layer. The variables are x =oxide-layer thickness (  and y =eddy-current respond (arbitrary units).
  The equation of the least squares line is
  =20.6 - .047x. Calculate and plot the residuals against x and then comment on the appropriateness of the simple linear regression model.
and y =eddy-current respond (arbitrary units). The equation of the least squares line is =20.6 - .047x. Calculate and plot the residuals against x and then comment on the appropriateness of the simple linear regression model. Question
Let y = sales at a fast food outlet (1000's of $),  number of competing outlets within a 1-mile radius,
  the population within a 1-mile radius (1000's of people), and
  be an indicator variable that equals 1 if the outlet has a drive-up window and 0 otherwise. Suppose that the true regression model is
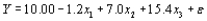
a. What is the mean value of sales when the number of competing outlets is 2, there are 8000 people within a 1-mile radius, and outlet has a drive-up window?
b. What is the mean value of sales for an outlet without a drive-up window that has three competing outlets and 5000 people within a 1-mile radius?
c. Interpret
number of competing outlets within a 1-mile radius, the population within a 1-mile radius (1000's of people), and be an indicator variable that equals 1 if the outlet has a drive-up window and 0 otherwise. Suppose that the true regression model is a. What is the mean value of sales when the number of competing outlets is 2, there are 8000 people within a 1-mile radius, and outlet has a drive-up window?
b. What is the mean value of sales for an outlet without a drive-up window that has three competing outlets and 5000 people within a 1-mile radius?
c. Interpret
Question
In each of the following cases, decide whether the given function is intrinsically linear. If so, identify  and then explain how a random error term
  can be introduced to yield an intrinsically linear probabilistic model.
a.
b.
c.
(a Gompertz curve)
d.
and then explain how a random error term can be introduced to yield an intrinsically linear probabilistic model. a.
b.
c.
(a Gompertz curve)
d.
Question
A multiple regression model with four independent variables to study accuracy in reading liquid crystal displays was used. The variables were
y = error percentage for subjects reading a four-digit liquid crystal display = level of backlight (ranging from 0 to 122
  )
)  = character subtense (ranging from
  )
)  = viewing angle (ranging from
  )
)  =level of ambient light (ranging from 20 to 1500 lux)
The model fit to data was The resulting estimated coefficient were
a. Calculate an estimate of expected error percentage when
b. Estimate the mean error percentage associated with a backlight level of 20, character subtense of .5, viewing angle of 10, and ambient light level of 30.
c. What is the estimated expected change in error percentage when the level of ambient light is increased by 1 unit while all other variables are fixed at the values given in part (a)? Answer for a 100-unit increase in ambient light level.
d. Explain why the answers in part ( c ) do not depend on the fixed values of
Under what conditions would there be such a dependence?
e. The estimated model was based on n=30 observations, with SST=39.2 and SSE=20.0. Calculate and interpret the coefficient of multiple determination, and then carry out the model utility test using
y = error percentage for subjects reading a four-digit liquid crystal display
= level of backlight (ranging from 0 to 122 ) = character subtense (ranging from ) = viewing angle (ranging from ) =level of ambient light (ranging from 20 to 1500 lux)The model fit to data was
The resulting estimated coefficient were a. Calculate an estimate of expected error percentage when
b. Estimate the mean error percentage associated with a backlight level of 20, character subtense of .5, viewing angle of 10, and ambient light level of 30.
c. What is the estimated expected change in error percentage when the level of ambient light is increased by 1 unit while all other variables are fixed at the values given in part (a)? Answer for a 100-unit increase in ambient light level.
d. Explain why the answers in part ( c ) do not depend on the fixed values of
Under what conditions would there be such a dependence?
e. The estimated model was based on n=30 observations, with SST=39.2 and SSE=20.0. Calculate and interpret the coefficient of multiple determination, and then carry out the model utility test using
Question
Question
Cardiorespiratory fitness is widely recognized as a major component of overall physical well-being. Direct measurement of maximal oxygen uptake  is the single best measure of such fitness, but direct measurement is time-consuming and expensive. It is therefore desirable to have a prediction equation for
  in terms of easily obtained quantities. Consider the variables
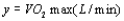


 Here is one possible model, for male students:
  , and
, and 
a. Interpret
.
b. What is the expected value of
when weight 75 kg. age is 20 yr, walk time is 15 minutes, and heart rate is 140 b/m?
c. What is the probability that
will be between 1.00 and 2.60 for a single observation made when the values of the predictors are as stated in part (b)?
is the single best measure of such fitness, but direct measurement is time-consuming and expensive. It is therefore desirable to have a prediction equation for in terms of easily obtained quantities. Consider the variables Here is one possible model, for male students: , and a. Interpret
.
b. What is the expected value of
when weight 75 kg. age is 20 yr, walk time is 15 minutes, and heart rate is 140 b/m?
c. What is the probability that
will be between 1.00 and 2.60 for a single observation made when the values of the predictors are as stated in part (b)?
Question
A study reported data on y-tensile strength (MPa),  = slab thickness (cm),
  = load (kg),
  = age at loading (days), and
  = time under test (days) resulting from stress tests of n=9 reinforced concrete slabs. The results of applying the BE elimination method of variable selection are summarized in the accompanying tabular format. Explain what occurred at each step of the procedure.
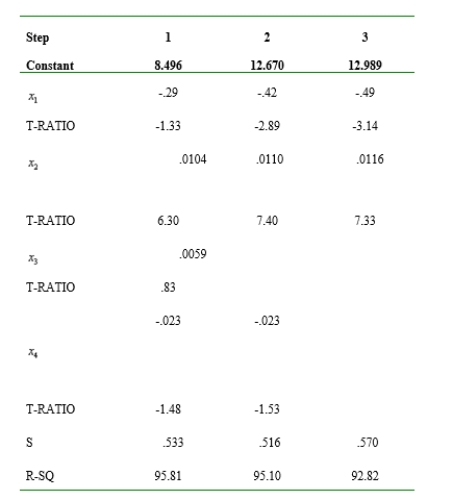
= slab thickness (cm), = load (kg), = age at loading (days), and = time under test (days) resulting from stress tests of n=9 reinforced concrete slabs. The results of applying the BE elimination method of variable selection are summarized in the accompanying tabular format. Explain what occurred at each step of the procedure. Question
The following data resulted from an experiment to assess the potential of unburnt colliery spoil as a medium for plant growth. The variables are x=acid extractable cations and y=exchangeable acidity/total cation exchange capacity. 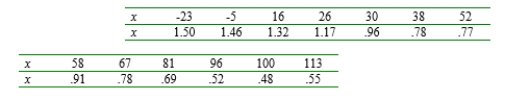 Standardizing the independent variable x to obtain
  and fitting the regression function
 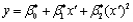 yielded the accompanying computer output.
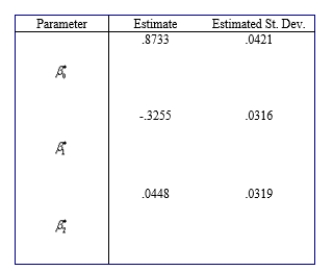
a. Estimate
.
b. Compute the value of the coefficient of multiple determination.
c. What is the estimated regression function
using the unstandardized variable x?
d. What is the estimated standard deviation of
computed in part ( c )?
e. Carry out a test using the standardized estimates to decide whether the quadratic term should be retained in the model. Repeat using the unstandardized estimates. Do your conclusions differ?
Standardizing the independent variable x to obtain and fitting the regression function yielded the accompanying computer output. a. Estimate
.
b. Compute the value of the coefficient of multiple determination.
c. What is the estimated regression function
using the unstandardized variable x?
d. What is the estimated standard deviation of
computed in part ( c )?
e. Carry out a test using the standardized estimates to decide whether the quadratic term should be retained in the model. Repeat using the unstandardized estimates. Do your conclusions differ?
Question
Consider the following data on mass rate of burning x and flame length y: 
a. Estimate the parameters of a power function model.
b. Assume that the power function is an appropriate model, test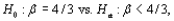
using a level .05 test.
c. Test the null hypothesis that states that the median flame length when burning rate is 5.0 is twice the median flame length when burning rate is 2.5 against the alternative that this is not the case.
Question
A study reports the accompanying data on discharge amount (  ), flow area (
  ), and slope of the water surface (b, in m/m) obtained at a number of floodplain stations. The study proposed a multiplicative power model
  .
. 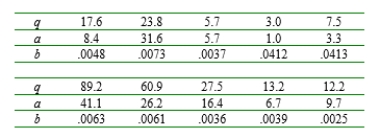
a. Use an appropriate transformation to make the model linear and then estimate the regression parameters for the transformed model. Finally, estimate
(the parameters of the original model). What would be your prediction of discharge amount when flow area is 10 and slope is .01?
b. Without actually doing any analysis, how would you fit a multiplicative exponential model
?
c. After the transformation to linearity in part (a), a 95% CI for the value of the transformed regression function when a = 3.3 and b = .0046 was obtained from computer output as (.217, 1.755). Obtain a 95% CI for
when a = 3.3 and b = .0046.
), flow area ( ), and slope of the water surface (b, in m/m) obtained at a number of floodplain stations. The study proposed a multiplicative power model . a. Use an appropriate transformation to make the model linear and then estimate the regression parameters for the transformed model. Finally, estimate
(the parameters of the original model). What would be your prediction of discharge amount when flow area is 10 and slope is .01?
b. Without actually doing any analysis, how would you fit a multiplicative exponential model
?
c. After the transformation to linearity in part (a), a 95% CI for the value of the transformed regression function when a = 3.3 and b = .0046 was obtained from computer output as (.217, 1.755). Obtain a 95% CI for
when a = 3.3 and b = .0046.

Unlock Deck
Sign up to unlock the cards in this deck!
Unlock Deck
Unlock Deck
1/77
Play
Full screen (f)
Deck 13: Nonlinear and Multiple Regression
1
In general, with is the error sum of squares from a kth degree polynomial, ____________ , and ____________ whenever > k.
is the error sum of squares from a kth degree polynomial, ____________ , and ____________ whenever > k. ,
, 
2
With , the sum of squared residuals (error sum of squares) is . Hence the mean square error is MSE =__________/___________.
, the sum of squared residuals (error sum of squares) is . Hence the mean square error is MSE =__________/___________.SSE, n-(k+1)
3
A dichotomous variable, one with just two possible categories, can be incorporated into a regression model via a ___________ or __________ variable x whose possible values 0 and 1 indicate which category is relevant for any particular observations.
dummy, indicator
4
The principle__________selects and to minimize .
and to minimize . Unlock Deck
Unlock for access to all 77 flashcards in this deck.
Unlock Deck
k this deck
5
The transformation __________ is used to linearize the function
Unlock Deck
Unlock for access to all 77 flashcards in this deck.
Unlock Deck
k this deck
6
The additive exponential and power models, and are ___________ linear.
and are ___________ linear. Unlock Deck
Unlock for access to all 77 flashcards in this deck.
Unlock Deck
k this deck
7
If we let , and , then SSE/SST is the proportion of the total variation in the observed 's that is ___________by the polynomial model.
, and , then SSE/SST is the proportion of the total variation in the observed 's that is ___________by the polynomial model. Unlock Deck
Unlock for access to all 77 flashcards in this deck.
Unlock Deck
k this deck
8
If = .75 is the value of the coefficient of multiple determination from a cubic regression model and that n =15, then the adjusted value is _____________.
= .75 is the value of the coefficient of multiple determination from a cubic regression model and that n =15, then the adjusted value is _____________. Unlock Deck
Unlock for access to all 77 flashcards in this deck.
Unlock Deck
k this deck
9
The regression coefficient in the multiple regression model is interpreted as the expected change in ___________ associated with a 1-unit increase in ___________,while___________ are held fixed.
in the multiple regression model is interpreted as the expected change in ___________ associated with a 1-unit increase in ___________,while___________ are held fixed. Unlock Deck
Unlock for access to all 77 flashcards in this deck.
Unlock Deck
k this deck
10
The function has been found quite useful in many applications. This function is well known as the ___________function.
has been found quite useful in many applications. This function is well known as the ___________function. Unlock Deck
Unlock for access to all 77 flashcards in this deck.
Unlock Deck
k this deck
11
A function relating y to x is ___________ if by means of a transformation on x and / or y, the function can be expressed as , where is the transformed independent variable and is the transformed dependent variable.
, where is the transformed independent variable and is the transformed dependent variable. Unlock Deck
Unlock for access to all 77 flashcards in this deck.
Unlock Deck
k this deck
12
If the regression parameters and are estimated by minimizing the expression , where the 's are weights that decrease with increasing , this yields____________estimates.
and are estimated by minimizing the expression , where the 's are weights that decrease with increasing , this yields____________estimates. Unlock Deck
Unlock for access to all 77 flashcards in this deck.
Unlock Deck
k this deck
13
The kth -degree polynomial regression model equation is , where is a normally distributed random variable with = ___________ and = ___________
, where is a normally distributed random variable with = ___________ and = ___________ Unlock Deck
Unlock for access to all 77 flashcards in this deck.
Unlock Deck
k this deck
14
The transformation __________ is used to linearize the reciprocal function
Unlock Deck
Unlock for access to all 77 flashcards in this deck.
Unlock Deck
k this deck
15
Multiple regression analysis involves building models for relating dependent variable y to __________or more independent variables.
Unlock Deck
Unlock for access to all 77 flashcards in this deck.
Unlock Deck
k this deck
16
If we let , and , then 1-SSE/SST is the proportion of the total variation in the observed 's that is __________ by the polynomial model. It is called the ____________ ,and is denoted by R .
, and , then 1-SSE/SST is the proportion of the total variation in the observed 's that is __________ by the polynomial model. It is called the ____________ ,and is denoted by R . Unlock Deck
Unlock for access to all 77 flashcards in this deck.
Unlock Deck
k this deck
17
In logistic regression it can be shown that . The expression on the left-hand side of this equality is well known as the ___________.
. The expression on the left-hand side of this equality is well known as the ___________. Unlock Deck
Unlock for access to all 77 flashcards in this deck.
Unlock Deck
k this deck
18
Many statisticians recommend __________ for an assessment of model validity and usefulness. These include plotting the residuals or standardized residuals on the vertical axis versus the independent variable or fitted values on the horizontal axis.
or standardized residuals on the vertical axis versus the independent variable or fitted values on the horizontal axis. Unlock Deck
Unlock for access to all 77 flashcards in this deck.
Unlock Deck
k this deck
19
For the exponential function , only the __________ variable is transformed via the transformation __________ to achieve linearity.
, only the __________ variable is transformed via the transformation __________ to achieve linearity. Unlock Deck
Unlock for access to all 77 flashcards in this deck.
Unlock Deck
k this deck
20
The transformation __________ of the dependent variable y and the transformation __________ of the independent variable x are used to linearize the power function
Unlock Deck
Unlock for access to all 77 flashcards in this deck.
Unlock Deck
k this deck
21
Which of the following statements are not true?
A) Provided that the model is correct, no residual plot should exhibit distinct patterns.
B) Provided that the model is correct, the residuals should be randomly distributed about 0 according to a normal distribution, so all but a very few standardized residuals should lie between -2 and +2 ( i.e., all but a few residuals are within 2 standard deviations of their expected value 0 ).
C) If we plot the fitted or predicted values on the vertical axis versus the actual values
On the horizontal axis, and the plot yields points close to the
Line, then the estimated regression function gives accurate predictions of the values actually observed.
D) All of the above statements are true.
E) None of the above statements are true.
Unlock Deck
Unlock for access to all 77 flashcards in this deck.
Unlock Deck
k this deck
22
A multiple regression model has
A) One independent variable.
B) Two dependent variables
C) Two or more dependent variables.
D) Two or more independent variables.
E) One independent variable and one independent variable.
A) One independent variable.
B) Two dependent variables
C) Two or more dependent variables.
D) Two or more independent variables.
E) One independent variable and one independent variable.
Unlock Deck
Unlock for access to all 77 flashcards in this deck.
Unlock Deck
k this deck
23
If a data set on at least five predictors is available, regressions involving all possible subsets of the predictors involve at least __________different models
Unlock Deck
Unlock for access to all 77 flashcards in this deck.
Unlock Deck
k this deck
24
A multiple regression model with k predictors will include __________ regression parameters, because will always be included.
will always be included. Unlock Deck
Unlock for access to all 77 flashcards in this deck.
Unlock Deck
k this deck
25
Which of the following statements are not true?
A) If a particular standardized residual is 1.5, then the residual itself is 3 estimated standard deviations larger than what would be expected from fitting the correct model.
B) Plotting the fitted or predicted values
On the vertical axis versus the actual values on the horizontal axis is a diagnostic plot that can be used for assessing model validity and usefulness.
C) A normal probability plot of the standardized residuals is a basic plot that man statisticians recommend for an assessment of model validity and usefulness.
D) All of the above statements are true.
E) None of the above statements are true.
Unlock Deck
Unlock for access to all 77 flashcards in this deck.
Unlock Deck
k this deck
26
Which of the following statements are not true?
A) To balance the cost of using more parameters against the gain in the coefficient of multiple determination
, many statisticians use the adjusted
)
B) It is always true
Whenever
For any kth-degree polynomial regression model.
C) It is always true
>
Whenever
For any kth -degree polynomial regression model.
D) All of the above statements are true.
E) None of the above statements are true
Unlock Deck
Unlock for access to all 77 flashcards in this deck.
Unlock Deck
k this deck
27
Which of the following statements are true?
A) The function
Is intrinsically linear.
B) The reciprocal function
Can be linearized by the transformation
)
C) For an exponential function relationship
, only y is transformed to achieve linearity.
D) All of the above statements are true.
E) None of the above statements are true.
A) The function
Is intrinsically linear.
B) The reciprocal function
Can be linearized by the transformation
)
C) For an exponential function relationship
, only y is transformed to achieve linearity.
D) All of the above statements are true.
E) None of the above statements are true.
Unlock Deck
Unlock for access to all 77 flashcards in this deck.
Unlock Deck
k this deck
28
Which of the following statements are true?
A) The kth-degree polynomial model
With K large is quite unrealistic in virtually all applications, and in most applications k =2 (quadratic) or k =3 (cubic) is appropriate.
B) The objective of regression analysis is to find a model that is both simple (relatively few parameters) and provides a good fit to the data.
C) A higher-degree polynomial may not specify a better model than a lower-degree model despite its higher coefficient of multiple determination
Value.
D) All of the above statements are true.
E) None of the above statements are true.
Unlock Deck
Unlock for access to all 77 flashcards in this deck.
Unlock Deck
k this deck
29
In many multiple regression data sets, the predictors are highly interdependent. When the sample values can be predicted very well from the other predictor values, for at least one predictor, the data is said to exhibit __________.
are highly interdependent. When the sample values can be predicted very well from the other predictor values, for at least one predictor, the data is said to exhibit __________. Unlock Deck
Unlock for access to all 77 flashcards in this deck.
Unlock Deck
k this deck
30
Which of the following statements are not true?
A) The function
Is intrinsically linear.
B) Intrinsically linear functions lead directly to probabilistic models which, though not linear in x as a function, have parameters whose values are easily estimated using ordinary least squares.
C) The multiplicative exponential model
Is intrinsically linear probabilistic model.
D) All of the above statements are true.
E) None of the above statements are true.
Unlock Deck
Unlock for access to all 77 flashcards in this deck.
Unlock Deck
k this deck
31
Quite frequently, residual plots as well as other plots of the data will suggest some difficulties or abnormality in the data. Which of the following statements are not considered difficulties?
A) A nonlinear probabilistic relationship between x and y is appropriate.
B) The variance of the error term
(and of Y ) is a constant
)
C) The error term
Does not have a normal distribution.
D) The selected model fits the data well except for very few discrepant or outlying data values, which may have greatly influenced the choice of the best-fit function.
E) One or more relevant independent variables have been omitted from the model.
Unlock Deck
Unlock for access to all 77 flashcards in this deck.
Unlock Deck
k this deck
32
When the numbers of predictors is too large to allow for an explicit or implicit examination of all possible subsets, several alternative selection procedures generally will identify good models. The simplest such procedure is the __________, known as BE method.
Unlock Deck
Unlock for access to all 77 flashcards in this deck.
Unlock Deck
k this deck
33
In multiple regression models, the error term is assumed to have:
A) a mean of 1.
B) a standard deviation of 1.
C) a variance of 0.
D) negative values.
E) normal distribution.
A) a mean of 1.
B) a standard deviation of 1.
C) a variance of 0.
D) negative values.
E) normal distribution.
Unlock Deck
Unlock for access to all 77 flashcards in this deck.
Unlock Deck
k this deck
34
Which of the following statements are not true?
A) The exponential function
Is intrinsically linear.
B) The power function
Can be linearized by the transformations
And
)
C) The function
Is intrinsically linear.
D) All of the above statements are true.
E) None of the above statements are true.
A) The exponential function
Is intrinsically linear.
B) The power function
Can be linearized by the transformations
And
)
C) The function
Is intrinsically linear.
D) All of the above statements are true.
E) None of the above statements are true.
Unlock Deck
Unlock for access to all 77 flashcards in this deck.
Unlock Deck
k this deck
35
The coefficient of multiple determination R is
A) SSE/SST
B) SST/SSE
C) 1-SSE/SST
D) 1-SST/SSE
E) ( SSE + SST ) / 2
A) SSE/SST
B) SST/SSE
C) 1-SSE/SST
D) 1-SST/SSE
E) ( SSE + SST ) / 2
Unlock Deck
Unlock for access to all 77 flashcards in this deck.
Unlock Deck
k this deck
36
Inferences concerning a single parameter in a multiple regression model with 5 predictors and 25 observations are based on a standardized variable T which has a t distribution with ___________ degrees of freedom.
in a multiple regression model with 5 predictors and 25 observations are based on a standardized variable T which has a t distribution with ___________ degrees of freedom. Unlock Deck
Unlock for access to all 77 flashcards in this deck.
Unlock Deck
k this deck
37
Incorporating a categorical variable with 5 possible categories into a multiple regression model requires the use of __________ dummy variables.
Unlock Deck
Unlock for access to all 77 flashcards in this deck.
Unlock Deck
k this deck
38
Which of the following statements are not true?
A) In analyzing transformed data, one should keep in mind that if a transformation on y has been made and one wishes to use the standardized formulas to test hypothesis or construct confidence intervals, the transformed error term
Should be at least approximately normally distributed.
B) When y is transformed, the
Coefficient of determination value from the resulting regression refers to variation in the
's explained by the original (non-transformed) regression model.
C) The additive exponential and power models,
And
, respectively, are not intrinsically linear.
D) When the transformed model satisfies all required assumptions, the method of least squares yields best estimates of the transformed parameters. However, estimates of the original parameters may not be best in any sense, though they will be reasonable.
E) All of the above statements are true.
Unlock Deck
Unlock for access to all 77 flashcards in this deck.
Unlock Deck
k this deck
39
Which of the following statements are true?
A) One way to study the fit of a model is to superimpose a graph of the best-fit function on the scatter plot of the data.
B) An effective approach to assessment of model adequacy is to compute the fitted or predicted values
And the residuals
, then plot various functions of these computed quantities, and examine the plots either to confirm our choice of model or for indications that the model is not appropriate.
C) Multiple regression analysis involves building models for relating the dependent variable y to two or more independent variables.
D) All of the above statements are true.
E) None of the above statements are true.
Unlock Deck
Unlock for access to all 77 flashcards in this deck.
Unlock Deck
k this deck
40
If is the error sum of squares computed from a model with k predictors and n observations, then the mean squared error for the model is = __________/__________.
is the error sum of squares computed from a model with k predictors and n observations, then the mean squared error for the model is = __________/__________. Unlock Deck
Unlock for access to all 77 flashcards in this deck.
Unlock Deck
k this deck
41
Which of the following statements are true?
A) The proportion of total variation explained by the multiple regression model is
; the coefficient of multiple determination.
B) The coefficient of multiple determination
Is often adjusted for the number of parameters (k+1) in the model by the formula
C) With multivariate data, there is no preliminary picture analogous to a scatter plot to indicate whether a particular multiple regression model will be judged useful.
D) The model utility test in multiple regression involves testing
Versus
(i = 1, 2, ……, k)
E) All of the above statements are true.
Unlock Deck
Unlock for access to all 77 flashcards in this deck.
Unlock Deck
k this deck
42
In multiple regression analysis with n observations and k predictors (or equivalently k+1 parameters), inferences concerning a single parameter are based on the standardized variable , which has a t-distribution with degrees of freedom equal to
A) n-k+1
B) n-k
C) n-k-1
D) n+k-1
E) n+k+1
, which has a t-distribution with degrees of freedom equal toA) n-k+1
B) n-k
C) n-k-1
D) n+k-1
E) n+k+1
Unlock Deck
Unlock for access to all 77 flashcards in this deck.
Unlock Deck
k this deck
43
For a multiple regression model, , and , then the proportion of the total variation in the observed 's that is not explained by the model is
A) .76
B) .24
C) 310
D) 190
E) .52
A) .76
B) .24
C) 310
D) 190
E) .52
Unlock Deck
Unlock for access to all 77 flashcards in this deck.
Unlock Deck
k this deck
44
Which of the following statements are not true?
A) The model utility F test is appropriate for testing whether there is useful information about the dependent variable in any of the k predictors (i.e., whether
))
B) If we let
Be the sum of squared residuals for the full multiple regression model with k predictors and
Be the corresponding sum for the reduced model with l predictors (l < k), then
)
C) The standardized residuals in multiple regression result from dividing each residual by its estimated standard deviation; the formula for these standard deviations is substantially more complicated than in the case of simple linear regression.
D) All of the above statements are true.
E) None of the above statements are true.
Unlock Deck
Unlock for access to all 77 flashcards in this deck.
Unlock Deck
k this deck
45
Incorporating a categorical variable with 4 possible categories into a multiple regression model requires the use of
A) 4 indicator variables
B) 3 indicator variables
C) 2 indicator variables
D) 1 indicator variable
E) no indicator variables at all
A) 4 indicator variables
B) 3 indicator variables
C) 2 indicator variables
D) 1 indicator variable
E) no indicator variables at all
Unlock Deck
Unlock for access to all 77 flashcards in this deck.
Unlock Deck
k this deck
46
Which of the following statements are true?
A) In general, it is not only permissible for some independent or predictor variables to the mathematical functions of others, but also of often highly desirable in the sense that the resulting model may be much more successful in explaining variation in y than any model without such predictors.
B) Polynomial regression is indeed a specific case of multiple regression.
C) The coefficient
In the multiple regression model
Is interpreted as the expected change in Y with a 1-unit increase in
, when
Are held fixed.
D) All of the above statements are true.
E) None of the above statements are true.
Unlock Deck
Unlock for access to all 77 flashcards in this deck.
Unlock Deck
k this deck
47
For the quadratic model with regression function , the parameters characterize the behavior of the function near
A) x = 2.0
B) x = 1.5
C) x = 1.0
D) x = .05
E) x = 0.0
A) x = 2.0
B) x = 1.5
C) x = 1.0
D) x = .05
E) x = 0.0
Unlock Deck
Unlock for access to all 77 flashcards in this deck.
Unlock Deck
k this deck
48
If the value of the coefficient of multiple determination is .80 for a quadratic regression model, and that n = 11, then the adjusted value is
A) .75
B) .80
C) .85
D) .90
E) .95
A) .75
B) .80
C) .85
D) .90
E) .95
Unlock Deck
Unlock for access to all 77 flashcards in this deck.
Unlock Deck
k this deck
49
Suppose the variables x=commuting distance and y=commuting time are related according to the simple linear regression model with
a. If n=5 observations are made at the x values
calculate the standard deviations of the five corresponding residuals.
b. Repeat part (a) for
c. What do the results of parts (a) and (b) imply about the deviation of the estimated line from the observation made at the largest sampled x value?
a. If n=5 observations are made at the x values
calculate the standard deviations of the five corresponding residuals.
b. Repeat part (a) for
c. What do the results of parts (a) and (b) imply about the deviation of the estimated line from the observation made at the largest sampled x value?
Unlock Deck
Unlock for access to all 77 flashcards in this deck.
Unlock Deck
k this deck
50
For the case of two independent variables and , which of the following statements are not true?
A)
Is the first-order no-interaction model
B)
Is the second-order no interaction model
C)
Is the model with first-order predictors and interaction
D)
Is the complete second-order or full quadratic model is
E) All of the above statements are true.
A)
Is the first-order no-interaction model
B)
Is the second-order no interaction model
C)
Is the model with first-order predictors and interaction
D)
Is the complete second-order or full quadratic model is
E) All of the above statements are true.
Unlock Deck
Unlock for access to all 77 flashcards in this deck.
Unlock Deck
k this deck
51
Which of the following statements are not true?
A) In multiple regression, the objective is to build a probabilistic model that relates a dependent variable y to more than one independent or predictor variable.
B)
, where E (
) = 0 and V(
) =
Is the equation of the general additive multiple regression model.
C) The coefficient
In the multiple regression model
Is
Interpreted as the expected change in Y when
Is held constant (fixed).
D) All of the above statements are true.
E) None of the above statements are true.
Unlock Deck
Unlock for access to all 77 flashcards in this deck.
Unlock Deck
k this deck
52
A first-order no-interaction model has the form . As increases by 1-unit, while holding fixed, then y will be expected to
A) increase by 10
B) increase by 5
C) increase by 3
D) decrease by 3
E) decrease by 6
A) increase by 10
B) increase by 5
C) increase by 3
D) decrease by 3
E) decrease by 6
Unlock Deck
Unlock for access to all 77 flashcards in this deck.
Unlock Deck
k this deck
53
Which of the following statements are true?
A) The idea behind the stepwise procedure is that with forward selection, a single variable may be more strongly related to y than either of two or more other variables individually, but the combination of those variables may make the single variable subsequently redundant.
B) When the predictors
Are highly interdependent, the data is said to exhibit multicollinearity.
C) There is unfortunately no consensus among statisticians as to what remedies are appropriate when sever multicollinearity is present. One possibility involves continuing to use a model that includes all the predictors but estimating parameters by using something other than least squares.
D) All of the above statements are true.
E) None of the above statements are true.
Unlock Deck
Unlock for access to all 77 flashcards in this deck.
Unlock Deck
k this deck
54
Which of the following statements are not true?
A)
, the coefficient of multiple determination for a k-predictor model, will virtually always increase as k does, and can never decrease.
B) We are not interested in the number of predictors k that maximizes
, the coefficient of multiple determination for a k-predictor model. Instead, we wish to identify a small k for which
Is nearly as large as
For all predictors in the model.
C)
Is the mean squared error for a k-predictor model.
D) All of the above statements are true.
E) None of the above statements are true.
Unlock Deck
Unlock for access to all 77 flashcards in this deck.
Unlock Deck
k this deck
55
Which of the following statements are not true?
A) Often theoretical considerations suggest a nonlinear relation between a dependent variable and two or more independent variables, whereas on other occasions, diagnostic plots indicate that some type of nonlinear function should be used.
B) The logistic regression model is used to relate a dichotomous variable y to a single prediction. Unfortunately, this model cannot be extended to incorporate more than one predictor.
C) A multiple regression model with k predictors includes k+1 regression parameters
's, because
Will always be included.
D) All of the above statements are true.
E) None of the above statements are true.
Unlock Deck
Unlock for access to all 77 flashcards in this deck.
Unlock Deck
k this deck
56
Which of the following statements are true?
A) The forward selection method, an alternative to the backward elimination method, starts with no predictors in the model and consider fitting in turn the model with only
, only
,…)., and finally only
)
B) The stepwise procedure most widely used is a combination of forward selection (FS) method and backward elimination (BE) method.
C) The stepwise procedure starts by adding variables to the model, but after each addition it examines those variables previously entered to see whether any is a candidate for elimination.
D) All of the above statements are true.
E) None of the above statements are true.
Unlock Deck
Unlock for access to all 77 flashcards in this deck.
Unlock Deck
k this deck
57
The adjusted coefficient of multiple determination is adjusted for
A) The value of the error term
B) The number of dependent variables in the model
C) The number of parameters in the model
D) The number of outliers
E) The level of significance
A) The value of the error term
B) The number of dependent variables in the model
C) The number of parameters in the model
D) The number of outliers
E) The level of significance
Unlock Deck
Unlock for access to all 77 flashcards in this deck.
Unlock Deck
k this deck
58
Which of the following statements are not true?
A) The way to incorporate a qualitative (categorical) variable with three possible categories into a regression model is to define a single-numerical variable with coded values such as 0, 1, and 2 corresponding to the three categories.
B) Incorporating a categorical variable with c possible categories into a multiple regression model requires the use of c-1 indicator variables.
C) The positive square root of the coefficient of multiple determination is called the multiple correlation coefficient R.
D) All of the above statements are true.
E) None of the above statements are true.
Unlock Deck
Unlock for access to all 77 flashcards in this deck.
Unlock Deck
k this deck
59
Which of the following statements are not true?
A) Generally speaking, when a subset of k predictors (k < m) is used to fit a model, the
Estimators
Will be unbiased for
, and
Will also be
Unbiased estimator for the true E(Y).
B) When the number of predictors is too large to allow for explicit or implicit examination
Of all possible subsets, several alternative selection procedures generally will identify good models.
C) The backward elimination method starts with the model in which all predictors under
Considerations are used.
D) All of the above statements are true.
E) None of the above statements are true.
Unlock Deck
Unlock for access to all 77 flashcards in this deck.
Unlock Deck
k this deck
60
A multiple regression model has the form , where the dependent variable Y represents (in $1,000), represents unit price (in dollars), and represents advertisement (in dollars). As increases by $1, while holding fixed, then sales are expected to
A) increase by $7
B) increase by $13
C) decrease by $4
D) decrease by $4,000
E) remain the same
A) increase by $7
B) increase by $13
C) decrease by $4
D) decrease by $4,000
E) remain the same
Unlock Deck
Unlock for access to all 77 flashcards in this deck.
Unlock Deck
k this deck
61
It is important to find characteristics of the production process that produce tortilla chips with an appealing texture. The following data on x = frying time (sec) and y = moisture content (%) are obtained:
a. Construct a scatter plot of y versus x and comment.
b. Construct a scatter plot of the (In(x), In(y)) pairs and comment.
c. What probabilistic relationship between x and y is suggested by the linear pattern in the plot of part (b)?
d. Predict the value of moisture content when frying time is 20 in a way that conveys information about reliability and precision.
Unlock Deck
Unlock for access to all 77 flashcards in this deck.
Unlock Deck
k this deck
62
A trucking company considered a multiple regression model for relating the dependent variable y=total daily travel time for one of its drivers (hours) to the predictors =distance traveled (miles) and the number of deliveries made. Suppose that the model equation is
a. What is the mean value of travel time when distance traveled is 50 miles and three deliveries are made?
b. How would interpret
the coefficient of the predictor
? What is the interpretation of
c. If
hour, what is the probability that travel time will be at most 6 hours when three deliveries are made and the distance traveled is 50 miles?
=distance traveled (miles) and the number of deliveries made. Suppose that the model equation is a. What is the mean value of travel time when distance traveled is 50 miles and three deliveries are made?
b. How would interpret
the coefficient of the predictor
? What is the interpretation of
c. If
hour, what is the probability that travel time will be at most 6 hours when three deliveries are made and the distance traveled is 50 miles?
Unlock Deck
Unlock for access to all 77 flashcards in this deck.
Unlock Deck
k this deck
63
Answer the following questions.
a. Show that
when the
are the residuals from a simple linear regression.
b. Are the residuals from a simple linear regression independent of one another, positively correlated, or negatively correlated? Explain.
c. Show that
for the residuals from a simple linear regression. [This result along with part (a) shows that there are two linear restrictions on the
, resulting in a loss of 2 df when the squared residuals are used to estimate
]
Unlock Deck
Unlock for access to all 77 flashcards in this deck.
Unlock Deck
k this deck
64
Suppose that the expected value of thermal conductivity y is a linear function of where x is lamellar thickness.
a. Estimate the parameters of the regression function and the regression function itself.
b. Predict the value of thermal conductivity when lamellar thickness is 500 angstroms.
where x is lamellar thickness. a. Estimate the parameters of the regression function and the regression function itself.
b. Predict the value of thermal conductivity when lamellar thickness is 500 angstroms.
Unlock Deck
Unlock for access to all 77 flashcards in this deck.
Unlock Deck
k this deck
65
An investigation of the influence of sodium benzoate concentration on the critical minimum pH necessary for the inhibition of Fe yielded the accompanying data, which suggests that expected critical minimum pH is linearly related to the natural logarithm of concentrate:
a. What is the implied probabilistic model, and what are the estimates of the model parameters?
b. What critical minimum pH would you predict for a concentration of 1.0? Obtain a 95% PI for critical minimum pH when concentration is 1.0.
a. What is the implied probabilistic model, and what are the estimates of the model parameters?
b. What critical minimum pH would you predict for a concentration of 1.0? Obtain a 95% PI for critical minimum pH when concentration is 1.0.
Unlock Deck
Unlock for access to all 77 flashcards in this deck.
Unlock Deck
k this deck
66
The viscosity (y) of an oil was measured by a cone and plate viscometer at six different cone speeds (x). It was assumed that a quadratic regression model was appropriate, and the estimated regression function resulting from the n=6 observations was
a. Estimate
, the expected viscosity when speed is 75 rpm.
b. What viscosity would you predict for a cone speed of 60 rpm.
c. If
and
compute SSE
d. From part ( c ),
Using SSE computed in part ( c ), what is the computed value of
e. If the estimated standard deviation of
at level .01.
a. Estimate
, the expected viscosity when speed is 75 rpm.
b. What viscosity would you predict for a cone speed of 60 rpm.
c. If
and
compute SSE
d. From part ( c ),
Using SSE computed in part ( c ), what is the computed value of
e. If the estimated standard deviation of
at level .01.
Unlock Deck
Unlock for access to all 77 flashcards in this deck.
Unlock Deck
k this deck
67
In the accompanying table, we give the smallest SSE for each number of predictors k (k = 1,2,3,4) for a regression problem in which y=cumulative heat of hardening in cement, =% tricalcium aluminate, = % tricalcium silicate, = % aluminum ferrate, and = % dicalcium silicate. In addition, n=13, and SST=2715.16.
a. Use the criteria discussed in the text to recommend the use of a particular regression model.
b. Would forward selection result in the best two-predictor model? Explain.
=% tricalcium aluminate, = % tricalcium silicate, = % aluminum ferrate, and = % dicalcium silicate. In addition, n=13, and SST=2715.16. a. Use the criteria discussed in the text to recommend the use of a particular regression model.
b. Would forward selection result in the best two-predictor model? Explain.
Unlock Deck
Unlock for access to all 77 flashcards in this deck.
Unlock Deck
k this deck
68
Wear resistance of certain nuclear reactor components made of Zircaloy-2 is partly determined by properties of the oxide layer. The following data appears in a study that proposed a new nondestructive testing method to monitor thickness of the layer. The variables are x =oxide-layer thickness ( and y =eddy-current respond (arbitrary units). The equation of the least squares line is =20.6 - .047x. Calculate and plot the residuals against x and then comment on the appropriateness of the simple linear regression model.
and y =eddy-current respond (arbitrary units). The equation of the least squares line is =20.6 - .047x. Calculate and plot the residuals against x and then comment on the appropriateness of the simple linear regression model. Unlock Deck
Unlock for access to all 77 flashcards in this deck.
Unlock Deck
k this deck
69
Let y = sales at a fast food outlet (1000's of $), number of competing outlets within a 1-mile radius, the population within a 1-mile radius (1000's of people), and be an indicator variable that equals 1 if the outlet has a drive-up window and 0 otherwise. Suppose that the true regression model is
a. What is the mean value of sales when the number of competing outlets is 2, there are 8000 people within a 1-mile radius, and outlet has a drive-up window?
b. What is the mean value of sales for an outlet without a drive-up window that has three competing outlets and 5000 people within a 1-mile radius?
c. Interpret
number of competing outlets within a 1-mile radius, the population within a 1-mile radius (1000's of people), and be an indicator variable that equals 1 if the outlet has a drive-up window and 0 otherwise. Suppose that the true regression model is a. What is the mean value of sales when the number of competing outlets is 2, there are 8000 people within a 1-mile radius, and outlet has a drive-up window?
b. What is the mean value of sales for an outlet without a drive-up window that has three competing outlets and 5000 people within a 1-mile radius?
c. Interpret
Unlock Deck
Unlock for access to all 77 flashcards in this deck.
Unlock Deck
k this deck
70
In each of the following cases, decide whether the given function is intrinsically linear. If so, identify and then explain how a random error term can be introduced to yield an intrinsically linear probabilistic model.
a.
b.
c.
(a Gompertz curve)
d.
and then explain how a random error term can be introduced to yield an intrinsically linear probabilistic model. a.
b.
c.
(a Gompertz curve)
d.
Unlock Deck
Unlock for access to all 77 flashcards in this deck.
Unlock Deck
k this deck
71
A multiple regression model with four independent variables to study accuracy in reading liquid crystal displays was used. The variables were
y = error percentage for subjects reading a four-digit liquid crystal display = level of backlight (ranging from 0 to 122 ) = character subtense (ranging from ) = viewing angle (ranging from ) =level of ambient light (ranging from 20 to 1500 lux)
The model fit to data was The resulting estimated coefficient were
a. Calculate an estimate of expected error percentage when
b. Estimate the mean error percentage associated with a backlight level of 20, character subtense of .5, viewing angle of 10, and ambient light level of 30.
c. What is the estimated expected change in error percentage when the level of ambient light is increased by 1 unit while all other variables are fixed at the values given in part (a)? Answer for a 100-unit increase in ambient light level.
d. Explain why the answers in part ( c ) do not depend on the fixed values of
Under what conditions would there be such a dependence?
e. The estimated model was based on n=30 observations, with SST=39.2 and SSE=20.0. Calculate and interpret the coefficient of multiple determination, and then carry out the model utility test using
y = error percentage for subjects reading a four-digit liquid crystal display
= level of backlight (ranging from 0 to 122 ) = character subtense (ranging from ) = viewing angle (ranging from ) =level of ambient light (ranging from 20 to 1500 lux)The model fit to data was
The resulting estimated coefficient were a. Calculate an estimate of expected error percentage when
b. Estimate the mean error percentage associated with a backlight level of 20, character subtense of .5, viewing angle of 10, and ambient light level of 30.
c. What is the estimated expected change in error percentage when the level of ambient light is increased by 1 unit while all other variables are fixed at the values given in part (a)? Answer for a 100-unit increase in ambient light level.
d. Explain why the answers in part ( c ) do not depend on the fixed values of
Under what conditions would there be such a dependence?
e. The estimated model was based on n=30 observations, with SST=39.2 and SSE=20.0. Calculate and interpret the coefficient of multiple determination, and then carry out the model utility test using
Unlock Deck
Unlock for access to all 77 flashcards in this deck.
Unlock Deck
k this deck
72
Answer the following questions.
a. Could a linear regression result in residuals 25, -25, 7, 19, -6, 11, and 17? Why or why not?
b. Could a linear regression result in residuals 25, -25, 7, 19, -6, -10, and 4 corresponding to x values 4, -3, 9, 13, -13, -19, and 26? Why or why not?
a. Could a linear regression result in residuals 25, -25, 7, 19, -6, 11, and 17? Why or why not?
b. Could a linear regression result in residuals 25, -25, 7, 19, -6, -10, and 4 corresponding to x values 4, -3, 9, 13, -13, -19, and 26? Why or why not?
Unlock Deck
Unlock for access to all 77 flashcards in this deck.
Unlock Deck
k this deck
73
Cardiorespiratory fitness is widely recognized as a major component of overall physical well-being. Direct measurement of maximal oxygen uptake is the single best measure of such fitness, but direct measurement is time-consuming and expensive. It is therefore desirable to have a prediction equation for in terms of easily obtained quantities. Consider the variables Here is one possible model, for male students: , and
a. Interpret
.
b. What is the expected value of
when weight 75 kg. age is 20 yr, walk time is 15 minutes, and heart rate is 140 b/m?
c. What is the probability that
will be between 1.00 and 2.60 for a single observation made when the values of the predictors are as stated in part (b)?
is the single best measure of such fitness, but direct measurement is time-consuming and expensive. It is therefore desirable to have a prediction equation for in terms of easily obtained quantities. Consider the variables Here is one possible model, for male students: , and a. Interpret
.
b. What is the expected value of
when weight 75 kg. age is 20 yr, walk time is 15 minutes, and heart rate is 140 b/m?
c. What is the probability that
will be between 1.00 and 2.60 for a single observation made when the values of the predictors are as stated in part (b)?
Unlock Deck
Unlock for access to all 77 flashcards in this deck.
Unlock Deck
k this deck
74
A study reported data on y-tensile strength (MPa), = slab thickness (cm), = load (kg), = age at loading (days), and = time under test (days) resulting from stress tests of n=9 reinforced concrete slabs. The results of applying the BE elimination method of variable selection are summarized in the accompanying tabular format. Explain what occurred at each step of the procedure.
= slab thickness (cm), = load (kg), = age at loading (days), and = time under test (days) resulting from stress tests of n=9 reinforced concrete slabs. The results of applying the BE elimination method of variable selection are summarized in the accompanying tabular format. Explain what occurred at each step of the procedure. Unlock Deck
Unlock for access to all 77 flashcards in this deck.
Unlock Deck
k this deck
75
The following data resulted from an experiment to assess the potential of unburnt colliery spoil as a medium for plant growth. The variables are x=acid extractable cations and y=exchangeable acidity/total cation exchange capacity. Standardizing the independent variable x to obtain and fitting the regression function yielded the accompanying computer output.
a. Estimate
.
b. Compute the value of the coefficient of multiple determination.
c. What is the estimated regression function
using the unstandardized variable x?
d. What is the estimated standard deviation of
computed in part ( c )?
e. Carry out a test using the standardized estimates to decide whether the quadratic term should be retained in the model. Repeat using the unstandardized estimates. Do your conclusions differ?
Standardizing the independent variable x to obtain and fitting the regression function yielded the accompanying computer output. a. Estimate
.
b. Compute the value of the coefficient of multiple determination.
c. What is the estimated regression function
using the unstandardized variable x?
d. What is the estimated standard deviation of
computed in part ( c )?
e. Carry out a test using the standardized estimates to decide whether the quadratic term should be retained in the model. Repeat using the unstandardized estimates. Do your conclusions differ?
Unlock Deck
Unlock for access to all 77 flashcards in this deck.
Unlock Deck
k this deck
76
Consider the following data on mass rate of burning x and flame length y:
a. Estimate the parameters of a power function model.
b. Assume that the power function is an appropriate model, test
using a level .05 test.
c. Test the null hypothesis that states that the median flame length when burning rate is 5.0 is twice the median flame length when burning rate is 2.5 against the alternative that this is not the case.
Unlock Deck
Unlock for access to all 77 flashcards in this deck.
Unlock Deck
k this deck
77
A study reports the accompanying data on discharge amount ( ), flow area ( ), and slope of the water surface (b, in m/m) obtained at a number of floodplain stations. The study proposed a multiplicative power model .
a. Use an appropriate transformation to make the model linear and then estimate the regression parameters for the transformed model. Finally, estimate
(the parameters of the original model). What would be your prediction of discharge amount when flow area is 10 and slope is .01?
b. Without actually doing any analysis, how would you fit a multiplicative exponential model
?
c. After the transformation to linearity in part (a), a 95% CI for the value of the transformed regression function when a = 3.3 and b = .0046 was obtained from computer output as (.217, 1.755). Obtain a 95% CI for
when a = 3.3 and b = .0046.
), flow area ( ), and slope of the water surface (b, in m/m) obtained at a number of floodplain stations. The study proposed a multiplicative power model . a. Use an appropriate transformation to make the model linear and then estimate the regression parameters for the transformed model. Finally, estimate
(the parameters of the original model). What would be your prediction of discharge amount when flow area is 10 and slope is .01?
b. Without actually doing any analysis, how would you fit a multiplicative exponential model
?
c. After the transformation to linearity in part (a), a 95% CI for the value of the transformed regression function when a = 3.3 and b = .0046 was obtained from computer output as (.217, 1.755). Obtain a 95% CI for
when a = 3.3 and b = .0046.
Unlock Deck
Unlock for access to all 77 flashcards in this deck.
Unlock Deck
k this deck
Unlock Deck
Unlock for access to all 77 flashcards in this deck.


