Deck 7: Statistical Intervals Based on a Single Sample
Full screen (f)
Question
The formula used to construct approximately  confidence interval for a population proportion p when the sample size n is large enough
 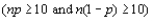 is given by __________, where
  is the sample proportion, and
confidence interval for a population proportion p when the sample size n is large enough is given by __________, where is the sample proportion, and Question
The chi-squared critical value,  , denotes the number on the measurement axis such that __________ of the area under the chi-squared curve with __________ degrees of freedom lies to the __________ of
  .
.
, denotes the number on the measurement axis such that __________ of the area under the chi-squared curve with __________ degrees of freedom lies to the __________ of . Question
Let  be a random sample from a normal distribution with mean
  and variance
  . Then the random variable
  has a __________ probability distribution with __________ degrees of freedom.
be a random sample from a normal distribution with mean and variance . Then the random variable has a __________ probability distribution with __________ degrees of freedom. Question
The area under a t-density curve between the critical values  is __________.
is __________. Question
Let  be a random sample from a population having a mean
  and standard deviation
  . Provided that n is large, the Central Limit Theorem (CLT) implies that
  is __________ distributed.
be a random sample from a population having a mean and standard deviation . Provided that n is large, the Central Limit Theorem (CLT) implies that is __________ distributed. Question
When  is the mean of a random sample of size n (n is small) from a normal population with mean
  , the random variable
 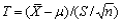 has a probability distribution called t-distribution with n-1 __________.
is the mean of a random sample of size n (n is small) from a normal population with mean , the random variable has a probability distribution called t-distribution with n-1 __________. Question
A random sample of 50 observations produced a mean value of 55 and standard deviation of 6.25. The 95% confidence interval for the population mean  is between __________ and __________. (two decimal places)
is between __________ and __________. (two decimal places) Question
A large-sample lower confidence bound for the population mean  __________.
__________. Question
Question
Question
If you want to develop a 99% confidence interval for the mean  of a normal population, when the standard deviation
  is known, the confidence level is __________.
of a normal population, when the standard deviation is known, the confidence level is __________. Question
The standard normal random variable 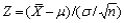 has a mean value of __________ and standard deviation of __________.
has a mean value of __________ and standard deviation of __________. Question
If a confidence level of 90% is used to construct a confidence interval for the mean  of a normal population when the value of the standard deviation
  is known, the z critical value is __________.
of a normal population when the value of the standard deviation is known, the z critical value is __________. Question
The ability of a confidence interval to contain the value of the population mean  is described by the __________.
is described by the __________. Question
Question
If the random sample  is taken from a normal distribution with mean value
  and standard deviation
  , then regardless of the sample size n, the sample mean
  is distributed with expected value __________ and standard deviation __________.
is taken from a normal distribution with mean value and standard deviation , then regardless of the sample size n, the sample mean is distributed with expected value __________ and standard deviation __________. Question
When  is the mean of a random sample of size n (n is large) from a normal population with mean
  , the random variable
 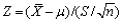 has approximately a __________ distribution with mean value of __________ and standard deviation of __________.
is the mean of a random sample of size n (n is large) from a normal population with mean , the random variable has approximately a __________ distribution with mean value of __________ and standard deviation of __________. Question
Question
The formula used to construct a 95% confidence interval for the mean  of a normal population when the value of the standard deviation
  is known is given by __________.
of a normal population when the value of the standard deviation is known is given by __________. Question
Let  denote the density function curve for a t-distribution with
  degrees of freedom. As
  __________, the spread of the corresponding
  curve decreases.
denote the density function curve for a t-distribution with degrees of freedom. As __________, the spread of the corresponding curve decreases. Question
Question
The area under a chi-squared curve with 10 degrees of freedom, which is captured between the two critical values  is __________.
is __________. Question
Question
Question
Question
Question
Question
Question
Question
Question
Question
Question
Question
Question
Question
Question
Question
Question
Question
Question
Question
Question
A more extensive tabulation of t critical values than what appears in your text shows that for the t distribution with 20 df, the areas to the right of the values .687, .860, and 1.064 are .25, .20, and .15, respectively. What is the confidence level for each of the following three confidence intervals for the mean  of a normal population distribution? Which of the three intervals would you recommend be used, and why?
a.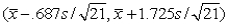
b.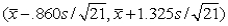
c.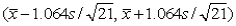
of a normal population distribution? Which of the three intervals would you recommend be used, and why? a.
b.
c.
Question
By how much must the sample size n be increased if the width of the CI  is to be halved? If the sample size is increased by a factor of 25, what effect will this have on the width of the interval? Justify your assertions.
is to be halved? If the sample size is increased by a factor of 25, what effect will this have on the width of the interval? Justify your assertions. Question
Question
A study of the ability of individuals to walk in a straight line reported that accompanying data on cadence (strides per seconds) for a sample of n - 20 randomly selected healthy men:  A normal probability plot gives substantial support to the assumption that the population distribution of cadence is approximately normal. A descriptive summary of the data from MINITAB follows.
a. Calculate and interpret a 95% confidence interval for a population mean cadence.
b. Calculate and interpret a 95% prediction interval for the cadence of a single individual randomly selected from this population.
c. Calculate an interval that includes at least 99% of the cadences in the population distribution using a confidence level of 95%.
A normal probability plot gives substantial support to the assumption that the population distribution of cadence is approximately normal. A descriptive summary of the data from MINITAB follows. a. Calculate and interpret a 95% confidence interval for a population mean cadence.
b. Calculate and interpret a 95% prediction interval for the cadence of a single individual randomly selected from this population.
c. Calculate an interval that includes at least 99% of the cadences in the population distribution using a confidence level of 95%.
Question
A random sample of 100 lightning flashes in a certain region resulted in a sample average radar echo duration of .81 sec and a sample standard deviation of .34 sec. Calculate a 99% (two-sided) confidence interval for the true average echo duration  , and interpret the resulting interval.
, and interpret the resulting interval. Question
Question
Question
The results of a Wagner turbidity test performed on 15 samples of standard Ottawa testing sand were (in microamperes) 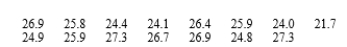
a. Is it plausible that this sample was selected from a normal population distribution?
b. Calculate an upper confidence bound with confidence level 90% for the population standard deviation of turbidity.
a. Is it plausible that this sample was selected from a normal population distribution?
b. Calculate an upper confidence bound with confidence level 90% for the population standard deviation of turbidity.
Question
Determine the following:
a. The 90th percentile of the chi-squared distribution with
= 12.
b. The 10th percentile of the chi-squared distribution with
= 12.
c.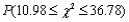
where
is a chi-squared rv with
= 22.
d.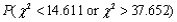
where
is a chi-squared rv with
= 25
a. The 90th percentile of the chi-squared distribution with
= 12.
b. The 10th percentile of the chi-squared distribution with
= 12.
c.
where
is a chi-squared rv with
= 22.
d.
where
is a chi-squared rv with
= 25
Question
Question
A CI is desired for the true average stray-load loss  (watts) for a certain type of induction motor when the line current is held at 10 amps for a speed of 1500 rpm. Assume that stray-load loss is normally distributed with
  = 3.0.
a. Compute a 95% CI for
when n = 25 and
= 60.
b. Compute a 95% CI for
when n = 100 and
= 60.
c. Compute a 99% CI for
when n = 100 and
= 60.
d. Compute an 82% CI for
when n = 100 and
= 60.
e. How large must n be if the width of the 99% interval for
is to be 1.0?
(watts) for a certain type of induction motor when the line current is held at 10 amps for a speed of 1500 rpm. Assume that stray-load loss is normally distributed with = 3.0. a. Compute a 95% CI for
when n = 25 and
= 60.
b. Compute a 95% CI for
when n = 100 and
= 60.
c. Compute a 99% CI for
when n = 100 and
= 60.
d. Compute an 82% CI for
when n = 100 and
= 60.
e. How large must n be if the width of the 99% interval for
is to be 1.0?
Question
The amount of lateral expansion (mils) was determined for a sample of n = 9 pulsed-power gas metal arc welds used in LNG ship containment tanks. The resulting sample standard deviation was s = 2.80 mils. Assuming normality, derive a 95% CI for  and for
  .
.
and for . Question
Consider the 1000 95% confidence intervals (CI) for  that a statistical consultant will obtain for various clients. Suppose the data sets on which the intervals are based are selected independently of one another. How many of these 1000 intervals do you expect to capture the corresponding value of
  ? What is the probability that between 950 and 970 of these intervals contain the corresponding value of
  ? (Hint: Let Y = the number among the 1000 intervals that contain
  . What kind of random variable is Y?).
that a statistical consultant will obtain for various clients. Suppose the data sets on which the intervals are based are selected independently of one another. How many of these 1000 intervals do you expect to capture the corresponding value of ? What is the probability that between 950 and 970 of these intervals contain the corresponding value of ? (Hint: Let Y = the number among the 1000 intervals that contain . What kind of random variable is Y?). Question
Suppose that a random sample of 50 bottles of a particular brand of cough syrup is selected, and the alcohol content of each bottle is determined. Let  denote the average alcohol content for the population of all bottles of the brand under study. Suppose that the resulting 95% confidence interval is (8.0, 9.6).
a. Would a 90% confidence interval calculated from this same sample have been narrower or wider than the given interval? Explain your reasoning.
b. Consider the following statement: There is a 95% chance that
is between 8 and 9.6. Is this statement correct? Why or why not?
c. Consider the following statement: We can be highly confident that 95% of all bottles of this type of cough syrup have an alcohol content that is between 8.0 and 9.6. Is this statement correct? Why or why not?
d. Consider the following statement: If the process of selecting a sample of size 50 and then computing the corresponding 955 interval ire repeated 100 times, 95 of the resulting intervals will include
. Is this statement correct? Why or why not?
denote the average alcohol content for the population of all bottles of the brand under study. Suppose that the resulting 95% confidence interval is (8.0, 9.6). a. Would a 90% confidence interval calculated from this same sample have been narrower or wider than the given interval? Explain your reasoning.
b. Consider the following statement: There is a 95% chance that
is between 8 and 9.6. Is this statement correct? Why or why not?
c. Consider the following statement: We can be highly confident that 95% of all bottles of this type of cough syrup have an alcohol content that is between 8.0 and 9.6. Is this statement correct? Why or why not?
d. Consider the following statement: If the process of selecting a sample of size 50 and then computing the corresponding 955 interval ire repeated 100 times, 95 of the resulting intervals will include
. Is this statement correct? Why or why not?
Question
Determine the confidence level for each of the following large-sample one-sided confidence bounds:
a. Upper bound:

b. Lower bound:
c. Upper bound:
a. Upper bound:
b. Lower bound:
c. Upper bound:
Question
Question
The superintendent of a large school district, having once had a course in probability and statistics, believes that the number of teachers absent on any given day has a Poisson distribution with parameter  . Use the accompanying data on absences for 50 days to derive a large-sample CI for
  . [Hint: The mean and variance of a Poisson variable both equal
  , so
, so  has approximately a standard normal distribution. Now proceed as in the derivation of the interval for p by making a probability statement (with probability 1 -
  ) and solving the resulting inequalities for
  .
. 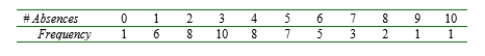
. Use the accompanying data on absences for 50 days to derive a large-sample CI for . [Hint: The mean and variance of a Poisson variable both equal , so has approximately a standard normal distribution. Now proceed as in the derivation of the interval for p by making a probability statement (with probability 1 - ) and solving the resulting inequalities for . 
Unlock Deck
Sign up to unlock the cards in this deck!
Unlock Deck
Unlock Deck
1/59
Play
Full screen (f)
Deck 7: Statistical Intervals Based on a Single Sample
1
The formula used to construct approximately confidence interval for a population proportion p when the sample size n is large enough is given by __________, where is the sample proportion, and
confidence interval for a population proportion p when the sample size n is large enough is given by __________, where is the sample proportion, and 
2
The chi-squared critical value, , denotes the number on the measurement axis such that __________ of the area under the chi-squared curve with __________ degrees of freedom lies to the __________ of .
, denotes the number on the measurement axis such that __________ of the area under the chi-squared curve with __________ degrees of freedom lies to the __________ of . right
right 3
Let be a random sample from a normal distribution with mean and variance . Then the random variable has a __________ probability distribution with __________ degrees of freedom.
be a random sample from a normal distribution with mean and variance . Then the random variable has a __________ probability distribution with __________ degrees of freedom.chi-squared 
4
The area under a t-density curve between the critical values is __________.
is __________. Unlock Deck
Unlock for access to all 59 flashcards in this deck.
Unlock Deck
k this deck
5
Let be a random sample from a population having a mean and standard deviation . Provided that n is large, the Central Limit Theorem (CLT) implies that is __________ distributed.
be a random sample from a population having a mean and standard deviation . Provided that n is large, the Central Limit Theorem (CLT) implies that is __________ distributed. Unlock Deck
Unlock for access to all 59 flashcards in this deck.
Unlock Deck
k this deck
6
When is the mean of a random sample of size n (n is small) from a normal population with mean , the random variable has a probability distribution called t-distribution with n-1 __________.
is the mean of a random sample of size n (n is small) from a normal population with mean , the random variable has a probability distribution called t-distribution with n-1 __________. Unlock Deck
Unlock for access to all 59 flashcards in this deck.
Unlock Deck
k this deck
7
A random sample of 50 observations produced a mean value of 55 and standard deviation of 6.25. The 95% confidence interval for the population mean is between __________ and __________. (two decimal places)
is between __________ and __________. (two decimal places) Unlock Deck
Unlock for access to all 59 flashcards in this deck.
Unlock Deck
k this deck
8
A large-sample lower confidence bound for the population mean __________.
__________. Unlock Deck
Unlock for access to all 59 flashcards in this deck.
Unlock Deck
k this deck
9
The z curve is often called the t curve with degrees of freedom equal to __________.
Unlock Deck
Unlock for access to all 59 flashcards in this deck.
Unlock Deck
k this deck
10
If we think of the width of the confidence interval as specifying its precision or accuracy, then the confidence level (or reliability) of the interval is __________ related to its precision.
Unlock Deck
Unlock for access to all 59 flashcards in this deck.
Unlock Deck
k this deck
11
If you want to develop a 99% confidence interval for the mean of a normal population, when the standard deviation is known, the confidence level is __________.
of a normal population, when the standard deviation is known, the confidence level is __________. Unlock Deck
Unlock for access to all 59 flashcards in this deck.
Unlock Deck
k this deck
12
The standard normal random variable has a mean value of __________ and standard deviation of __________.
has a mean value of __________ and standard deviation of __________. Unlock Deck
Unlock for access to all 59 flashcards in this deck.
Unlock Deck
k this deck
13
If a confidence level of 90% is used to construct a confidence interval for the mean of a normal population when the value of the standard deviation is known, the z critical value is __________.
of a normal population when the value of the standard deviation is known, the z critical value is __________. Unlock Deck
Unlock for access to all 59 flashcards in this deck.
Unlock Deck
k this deck
14
The ability of a confidence interval to contain the value of the population mean is described by the __________.
is described by the __________. Unlock Deck
Unlock for access to all 59 flashcards in this deck.
Unlock Deck
k this deck
15
The 90th percentile of a chi-squared distribution with 15 degrees of freedom is equal to __________.
Unlock Deck
Unlock for access to all 59 flashcards in this deck.
Unlock Deck
k this deck
16
If the random sample is taken from a normal distribution with mean value and standard deviation , then regardless of the sample size n, the sample mean is distributed with expected value __________ and standard deviation __________.
is taken from a normal distribution with mean value and standard deviation , then regardless of the sample size n, the sample mean is distributed with expected value __________ and standard deviation __________. Unlock Deck
Unlock for access to all 59 flashcards in this deck.
Unlock Deck
k this deck
17
When is the mean of a random sample of size n (n is large) from a normal population with mean , the random variable has approximately a __________ distribution with mean value of __________ and standard deviation of __________.
is the mean of a random sample of size n (n is large) from a normal population with mean , the random variable has approximately a __________ distribution with mean value of __________ and standard deviation of __________. Unlock Deck
Unlock for access to all 59 flashcards in this deck.
Unlock Deck
k this deck
18
The 5th percentile of a chi-squared distribution with 10 degrees of freedom is equal to __________.
Unlock Deck
Unlock for access to all 59 flashcards in this deck.
Unlock Deck
k this deck
19
The formula used to construct a 95% confidence interval for the mean of a normal population when the value of the standard deviation is known is given by __________.
of a normal population when the value of the standard deviation is known is given by __________. Unlock Deck
Unlock for access to all 59 flashcards in this deck.
Unlock Deck
k this deck
20
Let denote the density function curve for a t-distribution with degrees of freedom. As __________, the spread of the corresponding curve decreases.
denote the density function curve for a t-distribution with degrees of freedom. As __________, the spread of the corresponding curve decreases. Unlock Deck
Unlock for access to all 59 flashcards in this deck.
Unlock Deck
k this deck
21
Which of the following statements are not true?
A) Provided that the sample size n is large, the standardized variable
Is approximately normally distributed, while the variable
Is not.
B) The formula
Is a large-sample confidence interval for
With confidence level approximately
)
C) Generally speaking, n >40 will be sufficient to justify the use of the formula
As a large-sample confidence interval for
)
D) None of the above statements are true.
E) All of the above statements are true.
Unlock Deck
Unlock for access to all 59 flashcards in this deck.
Unlock Deck
k this deck
22
The area under a chi-squared curve with 10 degrees of freedom, which is captured between the two critical values is __________.
is __________. Unlock Deck
Unlock for access to all 59 flashcards in this deck.
Unlock Deck
k this deck
23
Which of the following statements are not true?
A) The notation
Is often used to denote the number on the measurement axis for which the area under the t-curve with \v
Degrees of freedom to the left of
Is
, where
Is called a t critical value.
B) The number of degrees of freedom for a t- variable is the number of freely determined deviations
On which the estimated standard deviation in the denominator of
Is based.
C) A larger value of degrees of freedom
Implies a t-distribution with smaller spread.
D) All of the above statements are true.
E) None of the above statements are true.
Unlock Deck
Unlock for access to all 59 flashcards in this deck.
Unlock Deck
k this deck
24
Which of the following statements are not true if denotes the density function curve for a t-distribution with degrees of freedom?
A) The t-distribution is governed by
Only.
B) Each
Curve is bell-shaped and centered around 0.
C) Each
Curve is less spread out than the standard normal z curve.
D) As
Increases, the spread of the corresponding
Curve decreases.
E) None of the above answers are true.
A) The t-distribution is governed by
Only.
B) Each
Curve is bell-shaped and centered around 0.
C) Each
Curve is less spread out than the standard normal z curve.
D) As
Increases, the spread of the corresponding
Curve decreases.
E) None of the above answers are true.
Unlock Deck
Unlock for access to all 59 flashcards in this deck.
Unlock Deck
k this deck
25
If the width of a confidence interval for is too wide when the population standard deviation is known, which one of the following is the best action to reduce the interval width?
A) Increase the confidence level
B) Reduce the population standard deviation
C) Increase the population mean
D) Increase the sample size n
E) None of the above answers are correct.
A) Increase the confidence level
B) Reduce the population standard deviation
C) Increase the population mean
D) Increase the sample size n
E) None of the above answers are correct.
Unlock Deck
Unlock for access to all 59 flashcards in this deck.
Unlock Deck
k this deck
26
Which of the following statements are not true?
A) A correct interpretation of a
Confidence interval for the mean
Relies on the long-run frequency interpretation of probability.
B) It is correct to write a statement such as
C) The probability is .95 that the random interval
Includes or covers the true value of
)
D) The interval
Is a 90% confidence interval for the mean
)
E) None of the above statements are true.
Unlock Deck
Unlock for access to all 59 flashcards in this deck.
Unlock Deck
k this deck
27
A random sample of 100 observations produced a sample proportion of .25. An approximate 90% confidence interval for the population proportion p is
A) .248 and .252
B) .179 and .321
C) .423 and .567
D) .246 and .254
E) None of the above answers are correct.
A) .248 and .252
B) .179 and .321
C) .423 and .567
D) .246 and .254
E) None of the above answers are correct.
Unlock Deck
Unlock for access to all 59 flashcards in this deck.
Unlock Deck
k this deck
28
Suppose that an investigator believes that virtually all values in the population are between 38 and 70. The appropriate sample size for estimating the true population mean within 2 units with 95% confidence level is approximately
A) 61
B) 62
C) 15
D) 16
E) None of the above answers are correct.
A) 61
B) 62
C) 15
D) 16
E) None of the above answers are correct.
Unlock Deck
Unlock for access to all 59 flashcards in this deck.
Unlock Deck
k this deck
29
Which of the following statements are not true in developing a confidence interval for the population mean
A) The width of the confidence interval becomes narrower when the sample mean increases.
B) The width of the confidence interval becomes wider when the sample mean increases.
C) The width of the confidence interval becomes narrower when the sample size n increases.
D) All of the above statements are true.
E) None of the above statements are true.
Unlock Deck
Unlock for access to all 59 flashcards in this deck.
Unlock Deck
k this deck
30
Which of the following statements are true?
A) A confidence interval is always calculated by first selecting a confidence level, which is a measure of the degree of reliability of the interval.
B) A confidence level of 95% implies that 95% of all samples would give an interval that includes the parameter being estimated, and only 5% of all samples would yield an erroneous interval.
C) Information about the precision of an interval estimate is conveyed by the width of the interval.
D) The higher the confidence level, the more strongly we believe that the value of the parameter being estimated lies within the interval.
E) All of the above statements are true.
Unlock Deck
Unlock for access to all 59 flashcards in this deck.
Unlock Deck
k this deck
31
A 99% confidence interval for the population mean is determined to be (65.32 to 73.54). If the confidence level is reduced to 90%, the 90% confidence interval for
A) becomes wider
B) becomes narrower
C) remains unchanged
D) None of the above answers are correct.
A) becomes wider
B) becomes narrower
C) remains unchanged
D) None of the above answers are correct.
Unlock Deck
Unlock for access to all 59 flashcards in this deck.
Unlock Deck
k this deck
32
If one wants to develop a 90% confidence interval for the mean of a normal population, when the standard deviation is known, the confidence level is
A) .10
B) .45
C) .90
D) 1.645
A) .10
B) .45
C) .90
D) 1.645
Unlock Deck
Unlock for access to all 59 flashcards in this deck.
Unlock Deck
k this deck
33
In developing a confidence interval for the population mean , a sample of 50 observations was used, and the confidence interval was 15.24 1.20. Had the sample size been 200 instead of 50, the confidence interval would have been
A) 7.62
1)20
B) 15.24
)30
C) 15.24
)60
D) 3.81
1)20
E) None of the above answers are correct.
A) 7.62
1)20
B) 15.24
)30
C) 15.24
)60
D) 3.81
1)20
E) None of the above answers are correct.
Unlock Deck
Unlock for access to all 59 flashcards in this deck.
Unlock Deck
k this deck
34
A random sample of 10 observations was selected from a normal population distribution. The sample mean and sample standard deviations were 20 and 3.2, respectively. A 95% prediction interval for a single observation selected from the same population is
A) 20
6)152
B) 20
4)244
C) 20
7)962
D) 20
7)592
E) None of the above answers are correct.
A) 20
6)152
B) 20
4)244
C) 20
7)962
D) 20
7)592
E) None of the above answers are correct.
Unlock Deck
Unlock for access to all 59 flashcards in this deck.
Unlock Deck
k this deck
35
Which of the following statements are true?
A) The interval
Is random, while its width is not random.
B) The interval
Is not random, while its width is random.
C) The interval
Is random, while its width is not random.
D) The interval
Is not random, while its width is random.
E) None of the above statements are true.
A) The interval
Is random, while its width is not random.
B) The interval
Is not random, while its width is random.
C) The interval
Is random, while its width is not random.
D) The interval
Is not random, while its width is random.
E) None of the above statements are true.
Unlock Deck
Unlock for access to all 59 flashcards in this deck.
Unlock Deck
k this deck
36
A 99% confidence interval for the mean of a normal population when the standard deviation is known is found to be 98.6 to 118.4. If the confidence level is reduced to .95, the confidence interval for
A) becomes wider
B) becomes narrower
C) remains unchanged
D) None of the above answers are correct.
A) becomes wider
B) becomes narrower
C) remains unchanged
D) None of the above answers are correct.
Unlock Deck
Unlock for access to all 59 flashcards in this deck.
Unlock Deck
k this deck
37
Which of the following statements are true when is the mean of a random sample of size n from a normal distribution with mean ?
A) The random variable
Has approximately a standard normal distribution for large n.
B) The random variable
Has a t-distribution with n-1 degrees of freedom for small n.
C) The normal distribution is governed by two parameters, the mean
And the standard deviation
)
D) A t-distribution is governed by only one parameter, called the number of degrees of freedom.
E) All of the above answers are true.
Unlock Deck
Unlock for access to all 59 flashcards in this deck.
Unlock Deck
k this deck
38
A random sample of 64 observations produced a mean value of 82 and standard deviation of 5.5. The 90% confidence interval for the population mean is between
A) 81.86 and 82.14
B) 80.65 and 83.35
C) 80.87 and 83.13
D) 81.31 and 82.69
E) None of the above answers are correct.
A) 81.86 and 82.14
B) 80.65 and 83.35
C) 80.87 and 83.13
D) 81.31 and 82.69
E) None of the above answers are correct.
Unlock Deck
Unlock for access to all 59 flashcards in this deck.
Unlock Deck
k this deck
39
Which of the following statements are true?
A) The price paid for using a high confidence level to construct a confidence interval is that the interval width becomes wider.
B) The only 100% confidence interval for the mean
Is
)
C) If we wish to estimate the mean
Of a normal population when the value of the standard deviation
Is known, and be within an amount B with
Confidence, the formula for determining the necessary sample size n is
)
D) All of the above statements are true.
E) None of the above statements are true.
Unlock Deck
Unlock for access to all 59 flashcards in this deck.
Unlock Deck
k this deck
40
Which of the following expressions are true about a large-sample upper confidence bound for the population mean ?
A)
B)
C)
D)
E) None of the above statements are true.
A)
B)
C)
D)
E) None of the above statements are true.
Unlock Deck
Unlock for access to all 59 flashcards in this deck.
Unlock Deck
k this deck
41
The lower limit of a 95% confidence interval for the variance of a normal population using a sample of size n and variance value is given by:
A)
B)
C)
D)
E) None of the above answers are correct.
A)
B)
C)
D)
E) None of the above answers are correct.
Unlock Deck
Unlock for access to all 59 flashcards in this deck.
Unlock Deck
k this deck
42
Which of the following statements are false about the chi-squared distribution with degrees of freedom?
A) It is a discrete probability distribution with a single parameter
)
B) It is positively skewed (long upper tail)
C) It becomes more symmetric as
Increases.
D) All of the above statements are true.
E) All of the above statements are false.
A) It is a discrete probability distribution with a single parameter
)
B) It is positively skewed (long upper tail)
C) It becomes more symmetric as
Increases.
D) All of the above statements are true.
E) All of the above statements are false.
Unlock Deck
Unlock for access to all 59 flashcards in this deck.
Unlock Deck
k this deck
43
A more extensive tabulation of t critical values than what appears in your text shows that for the t distribution with 20 df, the areas to the right of the values .687, .860, and 1.064 are .25, .20, and .15, respectively. What is the confidence level for each of the following three confidence intervals for the mean of a normal population distribution? Which of the three intervals would you recommend be used, and why?
a.
b.
c.
of a normal population distribution? Which of the three intervals would you recommend be used, and why? a.
b.
c.
Unlock Deck
Unlock for access to all 59 flashcards in this deck.
Unlock Deck
k this deck
44
By how much must the sample size n be increased if the width of the CI is to be halved? If the sample size is increased by a factor of 25, what effect will this have on the width of the interval? Justify your assertions.
is to be halved? If the sample size is increased by a factor of 25, what effect will this have on the width of the interval? Justify your assertions. Unlock Deck
Unlock for access to all 59 flashcards in this deck.
Unlock Deck
k this deck
45
It was reported that, in a sample of 507 adult Americans, only 142 correctly described the Bill of Rights as the first ten amendments to the U.S. Constitution. Calculate a (two-sided) confidence interval using a 99% confidence level for the proportion of all U. S. adults that could give a correct description of the Bill of Rights.
Unlock Deck
Unlock for access to all 59 flashcards in this deck.
Unlock Deck
k this deck
46
A study of the ability of individuals to walk in a straight line reported that accompanying data on cadence (strides per seconds) for a sample of n - 20 randomly selected healthy men: A normal probability plot gives substantial support to the assumption that the population distribution of cadence is approximately normal. A descriptive summary of the data from MINITAB follows.
a. Calculate and interpret a 95% confidence interval for a population mean cadence.
b. Calculate and interpret a 95% prediction interval for the cadence of a single individual randomly selected from this population.
c. Calculate an interval that includes at least 99% of the cadences in the population distribution using a confidence level of 95%.
A normal probability plot gives substantial support to the assumption that the population distribution of cadence is approximately normal. A descriptive summary of the data from MINITAB follows. a. Calculate and interpret a 95% confidence interval for a population mean cadence.
b. Calculate and interpret a 95% prediction interval for the cadence of a single individual randomly selected from this population.
c. Calculate an interval that includes at least 99% of the cadences in the population distribution using a confidence level of 95%.
Unlock Deck
Unlock for access to all 59 flashcards in this deck.
Unlock Deck
k this deck
47
A random sample of 100 lightning flashes in a certain region resulted in a sample average radar echo duration of .81 sec and a sample standard deviation of .34 sec. Calculate a 99% (two-sided) confidence interval for the true average echo duration , and interpret the resulting interval.
, and interpret the resulting interval. Unlock Deck
Unlock for access to all 59 flashcards in this deck.
Unlock Deck
k this deck
48
A sample of 14 joint specimens of a particular type gave a sample mean proportional limit stress of 8.50 MPa and a sample standard deviation of .80 MPa.
a. Calculate and interpret a 95% lower confidence bound for the true average proportional limit stress of all such joints. What, if any, assumptions did you make about the distribution of proportional limit stress?
b. Calculate and interpret a 95% lower prediction bound for the proportional limit stress of a single joint of this type.
Unlock Deck
Unlock for access to all 59 flashcards in this deck.
Unlock Deck
k this deck
49
The upper limit of a 95% confidence interval for the variance of a normal population using a sample of size n and variance value is given by:
A)
B)
C)
D)
E) None of the above answers are correct.
A)
B)
C)
D)
E) None of the above answers are correct.
Unlock Deck
Unlock for access to all 59 flashcards in this deck.
Unlock Deck
k this deck
50
The results of a Wagner turbidity test performed on 15 samples of standard Ottawa testing sand were (in microamperes)
a. Is it plausible that this sample was selected from a normal population distribution?
b. Calculate an upper confidence bound with confidence level 90% for the population standard deviation of turbidity.
a. Is it plausible that this sample was selected from a normal population distribution?
b. Calculate an upper confidence bound with confidence level 90% for the population standard deviation of turbidity.
Unlock Deck
Unlock for access to all 59 flashcards in this deck.
Unlock Deck
k this deck
51
Determine the following:
a. The 90th percentile of the chi-squared distribution with
= 12.
b. The 10th percentile of the chi-squared distribution with
= 12.
c.
where
is a chi-squared rv with
= 22.
d.
where
is a chi-squared rv with
= 25
a. The 90th percentile of the chi-squared distribution with
= 12.
b. The 10th percentile of the chi-squared distribution with
= 12.
c.
where
is a chi-squared rv with
= 22.
d.
where
is a chi-squared rv with
= 25
Unlock Deck
Unlock for access to all 59 flashcards in this deck.
Unlock Deck
k this deck
52
A random sample of n = 8 E-glass fiber test specimens of a certain type yielded a sample mean interfacial shear yield stress of 30.5 and a sample standard deviation of 3.0. Assuming that interfacial shear yield stress is normally distributed, compute a 95% CI for true average stress.
Unlock Deck
Unlock for access to all 59 flashcards in this deck.
Unlock Deck
k this deck
53
A CI is desired for the true average stray-load loss (watts) for a certain type of induction motor when the line current is held at 10 amps for a speed of 1500 rpm. Assume that stray-load loss is normally distributed with = 3.0.
a. Compute a 95% CI for
when n = 25 and
= 60.
b. Compute a 95% CI for
when n = 100 and
= 60.
c. Compute a 99% CI for
when n = 100 and
= 60.
d. Compute an 82% CI for
when n = 100 and
= 60.
e. How large must n be if the width of the 99% interval for
is to be 1.0?
(watts) for a certain type of induction motor when the line current is held at 10 amps for a speed of 1500 rpm. Assume that stray-load loss is normally distributed with = 3.0. a. Compute a 95% CI for
when n = 25 and
= 60.
b. Compute a 95% CI for
when n = 100 and
= 60.
c. Compute a 99% CI for
when n = 100 and
= 60.
d. Compute an 82% CI for
when n = 100 and
= 60.
e. How large must n be if the width of the 99% interval for
is to be 1.0?
Unlock Deck
Unlock for access to all 59 flashcards in this deck.
Unlock Deck
k this deck
54
The amount of lateral expansion (mils) was determined for a sample of n = 9 pulsed-power gas metal arc welds used in LNG ship containment tanks. The resulting sample standard deviation was s = 2.80 mils. Assuming normality, derive a 95% CI for and for .
and for . Unlock Deck
Unlock for access to all 59 flashcards in this deck.
Unlock Deck
k this deck
55
Consider the 1000 95% confidence intervals (CI) for that a statistical consultant will obtain for various clients. Suppose the data sets on which the intervals are based are selected independently of one another. How many of these 1000 intervals do you expect to capture the corresponding value of ? What is the probability that between 950 and 970 of these intervals contain the corresponding value of ? (Hint: Let Y = the number among the 1000 intervals that contain . What kind of random variable is Y?).
that a statistical consultant will obtain for various clients. Suppose the data sets on which the intervals are based are selected independently of one another. How many of these 1000 intervals do you expect to capture the corresponding value of ? What is the probability that between 950 and 970 of these intervals contain the corresponding value of ? (Hint: Let Y = the number among the 1000 intervals that contain . What kind of random variable is Y?). Unlock Deck
Unlock for access to all 59 flashcards in this deck.
Unlock Deck
k this deck
56
Suppose that a random sample of 50 bottles of a particular brand of cough syrup is selected, and the alcohol content of each bottle is determined. Let denote the average alcohol content for the population of all bottles of the brand under study. Suppose that the resulting 95% confidence interval is (8.0, 9.6).
a. Would a 90% confidence interval calculated from this same sample have been narrower or wider than the given interval? Explain your reasoning.
b. Consider the following statement: There is a 95% chance that
is between 8 and 9.6. Is this statement correct? Why or why not?
c. Consider the following statement: We can be highly confident that 95% of all bottles of this type of cough syrup have an alcohol content that is between 8.0 and 9.6. Is this statement correct? Why or why not?
d. Consider the following statement: If the process of selecting a sample of size 50 and then computing the corresponding 955 interval ire repeated 100 times, 95 of the resulting intervals will include
. Is this statement correct? Why or why not?
denote the average alcohol content for the population of all bottles of the brand under study. Suppose that the resulting 95% confidence interval is (8.0, 9.6). a. Would a 90% confidence interval calculated from this same sample have been narrower or wider than the given interval? Explain your reasoning.
b. Consider the following statement: There is a 95% chance that
is between 8 and 9.6. Is this statement correct? Why or why not?
c. Consider the following statement: We can be highly confident that 95% of all bottles of this type of cough syrup have an alcohol content that is between 8.0 and 9.6. Is this statement correct? Why or why not?
d. Consider the following statement: If the process of selecting a sample of size 50 and then computing the corresponding 955 interval ire repeated 100 times, 95 of the resulting intervals will include
. Is this statement correct? Why or why not?
Unlock Deck
Unlock for access to all 59 flashcards in this deck.
Unlock Deck
k this deck
57
Determine the confidence level for each of the following large-sample one-sided confidence bounds:
a. Upper bound:
b. Lower bound:
c. Upper bound:
a. Upper bound:
b. Lower bound:
c. Upper bound:
Unlock Deck
Unlock for access to all 59 flashcards in this deck.
Unlock Deck
k this deck
58
Which of the following statements are true about the percentiles of a chi-squared distribution with 20 degrees of freedom?
A) The 5th percentile is 31.410
B) The 95th percentile is 10.851
C) The 10th percentile is 12.443
D) The 90th percentile is 37.566
E) All of the above statements are true.
A) The 5th percentile is 31.410
B) The 95th percentile is 10.851
C) The 10th percentile is 12.443
D) The 90th percentile is 37.566
E) All of the above statements are true.
Unlock Deck
Unlock for access to all 59 flashcards in this deck.
Unlock Deck
k this deck
59
The superintendent of a large school district, having once had a course in probability and statistics, believes that the number of teachers absent on any given day has a Poisson distribution with parameter . Use the accompanying data on absences for 50 days to derive a large-sample CI for . [Hint: The mean and variance of a Poisson variable both equal , so has approximately a standard normal distribution. Now proceed as in the derivation of the interval for p by making a probability statement (with probability 1 - ) and solving the resulting inequalities for .
. Use the accompanying data on absences for 50 days to derive a large-sample CI for . [Hint: The mean and variance of a Poisson variable both equal , so has approximately a standard normal distribution. Now proceed as in the derivation of the interval for p by making a probability statement (with probability 1 - ) and solving the resulting inequalities for . Unlock Deck
Unlock for access to all 59 flashcards in this deck.
Unlock Deck
k this deck
Unlock Deck
Unlock for access to all 59 flashcards in this deck.


