Deck 6: The Standard Deviation As a Ruler and the Normal Model
Full screen (f)
Question
Question
Question
Question
Question
Question
Question
Question
Question
Question
Question
Question
Question
Question
Question
Question
Question
Question
Question
Question
Question
Question
Question
Question
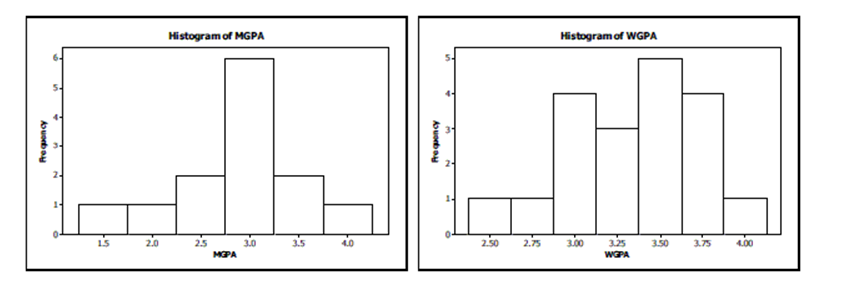
A random sample of 13 men and 19 women in a college class reported their grade point averages (GPAs). Here are histograms from the data:
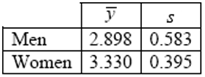
Summary statistics for these data are:
-A woman in the class says that she believes that college women tend to have higher GPAs than do college men. Does this sample support her claim? Test an appropriate hypothesis and state your conclusion.
Summary statistics for these data are:
-A woman in the class says that she believes that college women tend to have higher GPAs than do college men. Does this sample support her claim? Test an appropriate hypothesis and state your conclusion.
Question
Question
Question
Question
Question
Question
Question
Question
Question
Question
Question
Question
Question
Question
Question
Before you took this course, you probably heard many stories about Statistics courses. Oftentimes parents of students have had bad experiences with Statistics courses and pass on their anxieties to their children. To test whether actually taking AP* Statistics decreases students' anxieties about statistics, an AP* statistics instructor gave a test to rate student anxiety at the beginning and end of his course. Anxiety levels were measured on a scale of 0-10. Here are the data for 16 randomly chosen students from a class of 180 students: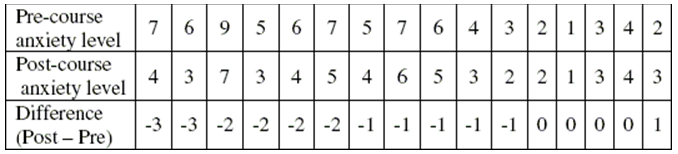
-Create and interpret a 90% confidence interval.
-Create and interpret a 90% confidence interval.
Question
Question
Question
Scrubbers A factory recently installed new pollution control equipment ("scrubbers") on its smokestacks in hopes of reducing air pollution levels at a nearby national park. Randomly timed measurements of sulfate levels (in micrograms per cubic meter) were taken before (Set C1) and after (Set C₂) the installation. We believe that measurements of sulfate levels are normally distributed. Write a complete conclusion about the effectiveness of these scrubbers based on the statistical software printout shown below. 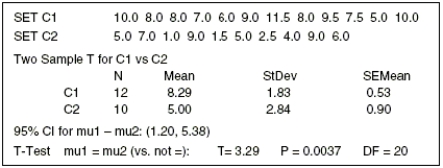
Question
Haircuts You need to find a new hair stylist and know that there are two terrific salons in your area, Hair by Charles and Curl Up & Dye. You want a really good haircut, but you do not want to pay too much for the cut. A random sample of costs for 10 different stylists was taken at each salon (each salon employs over 100 stylists).
a. Indicate what inference procedure you would use to see if there is a significant difference in the costs for haircuts at each salon. Check the appropriate assumptions and conditions and indicate whether you could or could not proceed. (Do not do the actual test.)
b. A friend tells you that he has heard that Curl Up & Dye is the more expensive salon.
i. Write hypotheses for your friend's claim.
ii. The following are computer outputs. Which output is the correct one to use for this test? Explain.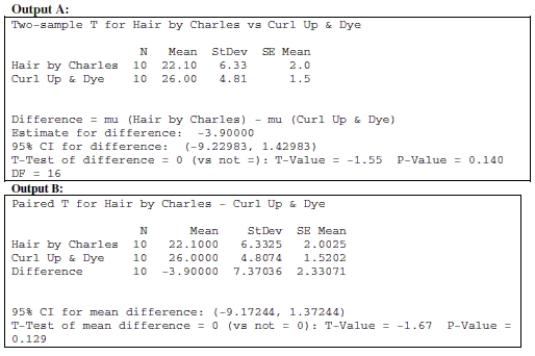
iii. Use the appropriate computer output to make a conclusion about the hypothesis test based on the data. Make sure to state your conclusion in context.
Question
Question
Question
Question
Gas mileage Hoping to improve the gas mileage of their cars, a car company has made an adjustment in the manufacturing process. Random samples of automobiles coming off the assembly line have been measured each week that the plant has been in operation. The data from before and after the manufacturing adjustments were made are in the table below. It is believed that measurements of gas mileage are normally distributed. Write a
complete conclusion about the manufacturing adjustments based on the statistical software
printout shown below.
complete conclusion about the manufacturing adjustments based on the statistical software
printout shown below.
Question
Question
Question
Question
Question
Question
Question
Question
Question
Question
Question
Question
Question
Question
Question
Question
Question
Question
Question
Question
Question
Question
Question
Question
Question
Question
Question

Unlock Deck
Sign up to unlock the cards in this deck!
Unlock Deck
Unlock Deck
1/74
Play
Full screen (f)
Deck 6: The Standard Deviation As a Ruler and the Normal Model
1
A survey question asked students "How many hours of TV do you watch per week?" Using their responses, we want to estimate the difference in mean hours between high school and middle school students. We should use a:
A) matched pairs t-interval
B) 1-sample t-interval
C) 1-proportion z-interval
D) 2-sample t-interval
E) 2-proportion z-interval
A) matched pairs t-interval
B) 1-sample t-interval
C) 1-proportion z-interval
D) 2-sample t-interval
E) 2-proportion z-interval
D
2
Feral cats tend to be lighter than domestic cats, mainly due to a lack of regular access to food. An animal shelter in Boston weighed a random sample of newly admitted stray cats over several weeks. They found that a 95% confidence interval for the mean weight (in pounds) of the cats was (8.6014, 9.9986). Which is true?
A) There is a 95% chance that feral cats weigh between 8.6014 and 9.9986 pounds.
B) We're 95% sure that the mean feral cat weight in Boston is between 8.6014 and 9.9986 pounds.
C) 95% of all samples would show a mean feral cat weight between 8.6014 and 9.9986 pounds.
D) 95% of the cats they checked weighed between 8.6014 and 9.9986 pounds.
E) 95% of all Boston stray cats weigh between 8.6014 and 9.9986 pounds.
B
3
A marketing company reviewing the length of television commercials monitored a random sample of commercials over several days. They found that a 95% confidence interval for the mean length (in seconds) of commercials aired daily was (23, 27). Which is true?
A) 95% of all the commercials aired were between 23 and 27 seconds a day.
B) We're 95% sure that the mean commercial length is between 23 and 27 seconds.
C) 95% of the commercials they checked were between 23 and 27 seconds long.
D) Commercials average between 23 and 27 seconds long on 95% of the days.
E) 95% of all samples would show mean commercial length between 23 and 27 seconds.
B
4
Company executives wish to estimate the dollar amount that customers spend in one shopping visit to their store. Initial tests were based on a small sample but now the executives double the sample size for a follow-up test. The main purpose of the larger sample is to...
A) reduce confounding due to other variables.
B) reduce response bias.
C) reduce non-response bias.
D) decrease the standard deviation of the sampling model.
E) decrease the variability in the population.
A) reduce confounding due to other variables.
B) reduce response bias.
C) reduce non-response bias.
D) decrease the standard deviation of the sampling model.
E) decrease the variability in the population.
Unlock Deck
Unlock for access to all 74 flashcards in this deck.
Unlock Deck
k this deck
5
A producer of a new diet supplement pill boasts that their product helps users lose more weight than the current leading brand. The provide evidence from a double-blind placebo controlled randomized clinical trial which tested the null hypothesis H₀: µnew - µold = 0 against the alternative HA: µnew - µold > 0 where µ represents the mean weight loss. Which of the following would be a Type I error?
A) Applying these results to all diet supplement pills, old and new.
B) Deciding that dieters on the new pill don't lose more weight, when in fact they do.
C) Deciding that dieters on the new pill don't lose more weight, when in fact they don't.
D) Deciding that dieters on the new pill lose more weight, when in fact they don't.
E) Deciding that dieters on the new pill lose more weight, when in fact they do.
Unlock Deck
Unlock for access to all 74 flashcards in this deck.
Unlock Deck
k this deck
6
A coffee house owner knows that customers pour different amounts of coffee into their cups. She samples cups from 10 customers she believes to be representative of the customers and weighs the cups, finding a mean of 12.5 ounces and standard deviation of 0.5 ounces. Assuming these cups of coffee can be considered a random sample of all cups of coffee which of the following formulas gives a 95% confidence interval for the mean weight of all cups of coffee?
A)
B)
C)
D)
E)
A)
B)
C)
D)
E)
Unlock Deck
Unlock for access to all 74 flashcards in this deck.
Unlock Deck
k this deck
7
The manager of a self-serve frozen yogurt shop, Purple Pear, knows that customers swirl different amounts of the creamy concoction into their cups. She samples cups from 10 costumers she believes to be representative of the customers and weighs the cups, finding a mean of 4.5 ounces and standard deviation of 0.25 ounces. Assuming these cups of frozen yogurt can be considered a random sample of all cups of frozen yogurt which of the following formulas gives a 95%
Confidence interval for the mean weight of all cups of frozen yogurt?
A)
B)
C)
D)
E)
Confidence interval for the mean weight of all cups of frozen yogurt?
A)
B)
C)
D)
E)
Unlock Deck
Unlock for access to all 74 flashcards in this deck.
Unlock Deck
k this deck
8
A random sample of 150 teachers in an inner-city school district found that 72% of them had volunteered time to a local charitable cause within the past 12 months. What is the standard error of the sample proportion?
A) 0.001
B) 0.016
C) 0.057
D) 0.069
E) 0.037
A) 0.001
B) 0.016
C) 0.057
D) 0.069
E) 0.037
Unlock Deck
Unlock for access to all 74 flashcards in this deck.
Unlock Deck
k this deck
9
An old myth claims that boys are better at math than girls. A high school guidance counselor collects the math grades from a random sample of 50 boys and another random sample of 50 girls. The guidance counselor then tested the hypothesis H₀: µ₁ - µ₂ = 0 against the one-tail alternative and found P = 0.35.Which is true?
A) The boys' grades are 35% higher than the girls' grades.
B) There's a 35% chance another study will give these same results.
C) There's a 35% chance that boys have higher math grades than girls.
D) None of these.
E) There's a 35% chance that there''s really no difference in math grades.
A) The boys' grades are 35% higher than the girls' grades.
B) There's a 35% chance another study will give these same results.
C) There's a 35% chance that boys have higher math grades than girls.
D) None of these.
E) There's a 35% chance that there''s really no difference in math grades.
Unlock Deck
Unlock for access to all 74 flashcards in this deck.
Unlock Deck
k this deck
10
A compensation specialist at a technology company wants to assess the competitiveness of the salaries at his firm. He needs to know the mean salary of the firm's employees. He checks all the employee salaries using company records, and he used his computer to create a 95% confidence interval based on a t-distribution. This procedure was not appropriate. Why?
A) Since these employees are from only one firm, the salaries may be skewed.
B) The entire population of employees was gathered so there is no reason to do inference.
C) At a given firm, employees are not randomly selected.
D) The CEO's salary is probably an outlier.
E) The population standard deviation is known, so he should have used a z-model.
Unlock Deck
Unlock for access to all 74 flashcards in this deck.
Unlock Deck
k this deck
11
Doctors at a technology research facility randomly assigned equal numbers of people to use computer keyboards in two rooms. In one room a group of people typed a manuscript using standard keyboards, while in the other room people typed the same manuscript using ergonomic keyboards to see if those people could type more words per minute. After collecting data for several days the researchers tested the hypothesis H₀: µ₁ - µ₂ = 0 against the one-tail alternative and found a P-value of 0.22. Which is true?
A) None of these.
B) The people using ergonomic keyboards type 22% more words per minute.
C) There's a 22% chance another experiment will give these same results.
D) There's a 22% chance that people using ergonomic keyboards type more words per minute.
E) There's a 22% chance that there's really no difference in typing speed.
Unlock Deck
Unlock for access to all 74 flashcards in this deck.
Unlock Deck
k this deck
12
A wildlife biologist wants to determine the mean weight of adult red squirrels. She captures 10 squirrels she believes to be representative of the species and weighs them, finding a mean of 12.32 grams and standard deviation of 1.88 gm. Assuming these squirrels can be considered a random sample of all red squirrels which of the following formulas gives a 95% confidence interval for the mean weight of all squirrels?
A)
B)
C)
D)
E)
A)
B)
C)
D)
E)
Unlock Deck
Unlock for access to all 74 flashcards in this deck.
Unlock Deck
k this deck
13
A professor was curious about her students' grade point averages (GPAs). She took a random sample of 15 students and found a mean GPA of 3.01 with a standard deviation of 0.534. Which of the following formulas gives a 99% confidence interval for the mean GPA of the professor's students?
A)
B)
C)
D)
E)
A)
B)
C)
D)
E)
Unlock Deck
Unlock for access to all 74 flashcards in this deck.
Unlock Deck
k this deck
14
A philosophy professor wants to find out whether the mean age of the men in his large lecture class is equal to the mean age of the women in his class. After collecting data from a random sample of his students, the professor tested the hypothesis H₀: µM - µW = 0 against the alternative HA: µM -
ΜW ×0. The P-value for the test was 0.003. Which is true?
A) There is a 0.3% chance that the mean ages for the men and women are different.
B) There is a 0.3% chance that the mean ages for the men and women are equal.
C) It is very unlikely that the professor would see results like these if the mean age of men was equal to the mean age of women.
D) There is a 0.3% chance that another sample will give these same results.
E) There is a 99.7% chance that another sample will give these same results.
Unlock Deck
Unlock for access to all 74 flashcards in this deck.
Unlock Deck
k this deck
15
Investigators at an agricultural research facility randomly assigned equal numbers of chickens to be housed in two rooms. In one room a group of chickens experienced normal day/night cycles, while in the other room lights were left on 24 hours a day to see if those chickens would lay more eggs. After collecting data for several days the researchers tested the hypothesis H₀: µ₁ - µ₂ = 0 against the one-tail alternative and found P = 0.22. Which is true?
A) None of these
B) The chickens in the lighted room averaged 0.22 more eggs per day
C) There's a 22% chance that chickens housed in a lighted room produce more eggs.
D) There's a 22% chance another experiment will give these same results.
E) There's a 22% chance that there's really no difference in egg production.
Unlock Deck
Unlock for access to all 74 flashcards in this deck.
Unlock Deck
k this deck
16
Absorption rates into the body are important considerations when manufacturing a generic version of a brand-name drug. A pharmacist read that the absorption rate into the body of a new generic drug (G) is the same as its brand-name counterpart (B). She has a researcher friend of hers run a small experiment to test H₀: µG - µB = 0 against the alternative HA: µG - µB ×0. Which of the following would be a Type I error?
A) Deciding that the absorption rates are the same, when in fact they are not.
B) Deciding that the absorption rates are different, when in fact they are not.
C) Deciding that the absorption rates are the same, when in fact they are.
D) The researcher cannot make a Type I error, since he has run an experiment.
E) Deciding that the absorption rates are different, when in fact they are.
Unlock Deck
Unlock for access to all 74 flashcards in this deck.
Unlock Deck
k this deck
17
Based on data from two very large independent samples, two students tested a hypothesis about equality of population means using a = 0.05. One student used a one-tail test and rejected the null hypothesis, but the other used a two-tail test and failed to reject the null hypothesis. Which of these might have been their calculated value of t?
A) 1.88
B) 2.66
C) 1.55
D) 2.22
E) 1.22
A) 1.88
B) 2.66
C) 1.55
D) 2.22
E) 1.22
Unlock Deck
Unlock for access to all 74 flashcards in this deck.
Unlock Deck
k this deck
18
A contact lens wearer read that the producer of a new contact lens boasts that their lenses are cheaper than contact lenses from another popular company. She collected some data, then tested the null hypothesis H₀: µold - µnew = 0 against the alternative HA: µold - µnew > 0. Which of the following would be a Type II error?
A) Deciding that the new lenses are cheaper, when in fact they really are.
B) Deciding that the new lenses are cheaper, when in fact they are not.
C) Deciding that the new lenses are not really cheaper, when in fact they are not.
D) Deciding that the new lenses are not really cheaper, when in fact they are.
E) Applying these results to all contact lenses, old and new.
Unlock Deck
Unlock for access to all 74 flashcards in this deck.
Unlock Deck
k this deck
19
A company checking the productivity of its assembly line monitored a random sample of workers for several days. They found that a 95% confidence interval for the mean number of items produced daily by each worker was (23,27). Which is true?
A) 95% of all the workers average between 23 and 27 items a day.
B) 95% of the workers sampled produced between 23 and 37 items a day.
C) We're 95% sure that the mean daily worker output is between 23 and 27 items.
D) Workers produce an average of 23 to 27 items on 95% of the days.
E) 95% of samples would show mean production between 23 and 27 items a day.
Unlock Deck
Unlock for access to all 74 flashcards in this deck.
Unlock Deck
k this deck
20
Based on data from two very large independent samples, two students tested a hypothesis about equality of population means using a = 0.05. One student used a one-tail test and rejected the null hypothesis, but the other used a two-tail test and failed to reject the null. Which of these might have been their calculated value of t?
A) 1.25
B) 2.25
C) 1.75
D) 1.50
E) 2.50
A) 1.25
B) 2.25
C) 1.75
D) 1.50
E) 2.50
Unlock Deck
Unlock for access to all 74 flashcards in this deck.
Unlock Deck
k this deck
21
Blood pressure Researchers developing new drugs must be concerned about possible side effects. They must check a new medication for arthritis to be sure that it does not cause an unsafe increase in blood pressure. They measure the blood pressures of a group of 12 subjects, then administer the drug and recheck the blood pressures one hour later. The
drug will be approved for use unless there is evidence that blood pressure has increased an average of more than 20 points. They will test a hypothesis using a = 0.05.
a. Write appropriate hypotheses (in words and in symbols).
b. In this context, which do you consider to be more serious - a Type I or a Type II error? Explain briefly.
c. After this experiment produced inconclusive results the researchers decided to test the drug again on another group of patients. Describe two changes they could make in their experiment to increase the power of their test, and explain the disadvantages of each.
Unlock Deck
Unlock for access to all 74 flashcards in this deck.
Unlock Deck
k this deck
22
One common method of evaluating the performance of a mutual fund is to compare its returns to those of a recognized benchmark such as an index of the returns on all securities of the type that the fund accumulates. The Janus Worldwide Fund considers its benchmark to be the MSCI World IndexSM. The table below depicts the annual returns (percent) for a recent ten-year period. Is this fund a good investment? That is, does this fund significantly outperform its benchmark?
-Explain clearly whether this data should be analyzed using a 2-sample t test approach or a match pairs t-test method.
-Explain clearly whether this data should be analyzed using a 2-sample t test approach or a match pairs t-test method.
Unlock Deck
Unlock for access to all 74 flashcards in this deck.
Unlock Deck
k this deck
23
Do the data indicate that anxiety levels about Statistics decreases after students take AP* Statistics? Test an appropriate hypothesis and state your conclusion.
Unlock Deck
Unlock for access to all 74 flashcards in this deck.
Unlock Deck
k this deck
24
A random sample of 13 men and 19 women in a college class reported their grade point averages (GPAs). Here are histograms from the data:
Summary statistics for these data are:
-A woman in the class says that she believes that college women tend to have higher GPAs than do college men. Does this sample support her claim? Test an appropriate hypothesis and state your conclusion.
Summary statistics for these data are:
-A woman in the class says that she believes that college women tend to have higher GPAs than do college men. Does this sample support her claim? Test an appropriate hypothesis and state your conclusion.
Unlock Deck
Unlock for access to all 74 flashcards in this deck.
Unlock Deck
k this deck
25
Starting Salaries A recruiting firm report on starting salaries states that starting salaries for finance majors are skewed to the right, with a nationwide mean of $58,993.
a. We collect starting salary data from a random sample of 50 recently graduated finance majors from a well- regarded business program at a large state university. Why is it okay to use these data for inference even though the population is skewed?
b. The standard deviation of the 50 salaries in our sample was $11,717. Specify the
sampling model (shape, center, spread) for the mean price of such samples.
c. This sample of randomly chosen salaries produced a 90% confidence interval for the mean starting salary for finance majors from this business program ($59347, $64903). Does this interval provide evidence that starting salaries are unusually high for graduates from
the business program at this university? Explain briefly.
d. Suppose we hope improve our estimate by choosing a new sample. How many starting salaries must we survey to have 90% confidence of estimating the mean starting salary to within $1000?
Unlock Deck
Unlock for access to all 74 flashcards in this deck.
Unlock Deck
k this deck
26
A teacher wants to see if two different forms of an exam are equivalent or if one of the exams is more difficult than the other. She has 120 students, which she randomly sorts into two groups of 60. The group that that takes exam A has a mean score of 78.1% with a standard deviation of 5.6%. Exam B scores an average of 74.8% with a standard deviation of 8.7%.
-Improving productivity A packing company considers hiring a national training consultant in hopes of improving productivity on the packing line. The national consultant agrees to work with 18 employees for one week as part of a trial before the packing company makes a decision about the training program. The training program will be implemented if the average product packed increases by more than 10 cases per day per employee. The packing company manager will test a hypothesis using a = 0.05.
a. Write appropriate hypotheses (in words and in symbols).
b. In this context, which do you consider to be more serious - a Type I or a Type II error? Explain briefly.
c. After this trial produced inconclusive results the manager decided to test the training program again with another group of employees. Describe two changes he could make in the trial to increase the power of the test, and explain the disadvantages of each.
Unlock Deck
Unlock for access to all 74 flashcards in this deck.
Unlock Deck
k this deck
27
Housing costs A government report on housing costs says that single-family home prices nationwide are skewed to the right, with a mean of $235,700.
a. We collect price data from a random sample of 50 homes in Orange County, California. Why is it okay to use these data for inference even though the population is skewed?
b. The standard deviation of the 50 homes in our sample was $25,500. Specify the sampling model (shape, center, spread) for the mean price of such samples.
c. This sample of randomly chosen homes produced a 90% confidence interval for the
mean price in Orange County of ($233,954, $246,046). Does this interval provide evidence
that single-family home prices are unusually high in this county? Explain briefly.
d. Suppose we hope to improve our estimate by choosing a new sample. How many home
prices must we survey to have 90% confidence of estimating the mean local price to within
$2000?
Unlock Deck
Unlock for access to all 74 flashcards in this deck.
Unlock Deck
k this deck
28
Family Incomes A government report on standard of living says that family incomes nationwide are skewed to the right, with a mean of $33,400.
a. We collect income data from a random sample of 50 local families. Why is it okay to use these data for inference even though the population is skewed?
b. The standard deviation of the 50 incomes in our sample was $25,530. Specify the sampling model (shape, center, spread) for the mean income of such samples.
c. This sample of randomly chosen families produced a 90% confidence interval for the
local mean family income of (32,882, 44,761). Does this interval provide evidence that family incomes are unusually high here? Explain briefly.
d. Suppose we hope to improve our estimate by choosing a new sample. How many families must we survey to have 90% confidence of estimating the mean local family income to within $2000?
Unlock Deck
Unlock for access to all 74 flashcards in this deck.
Unlock Deck
k this deck
29
A total of 23 Gossett High School students were admitted to State University. Of those students, 7 were offered athletic scholarships. The school's guidance counselor looked at their composite ACT scores (shown in the table), wondering if State U. might admit people with lower scores if they also were athletes. Assuming that this group of students is representative of students throughout the state, what do you think?
-Create and interpret a 90% confidence interval.
-Create and interpret a 90% confidence interval.
Unlock Deck
Unlock for access to all 74 flashcards in this deck.
Unlock Deck
k this deck
30
Too much TV? A father is concerned that his teenage son is watching too much television each day, since his son watches an average of 2 hours per day. His son says that his TV habits are no different than those of his friends. Since this father has taken a stats class, he knows that he can actually test to see whether or not his son is watching more TV than his peers. The father collects a random sample of television watching times from boys at his son's high school and gets the following data:
1.9 2.3 2.2 1.9 1.6 2.6 1.4 2.0 2.0 2.2
Is the father right? That is, is there evidence that other boys average less than 2 hours of television per day? Conduct a hypothesis test, making sure to state your conclusions in the context of the problem.
1.9 2.3 2.2 1.9 1.6 2.6 1.4 2.0 2.0 2.2
Is the father right? That is, is there evidence that other boys average less than 2 hours of television per day? Conduct a hypothesis test, making sure to state your conclusions in the context of the problem.
Unlock Deck
Unlock for access to all 74 flashcards in this deck.
Unlock Deck
k this deck
31
A professor at a large university believes that students take an average of 15 credit hours per term. A random sample of 24 students in her class of 250 students reported the following number of credit hours that they were taking:
-Does this sample indicate that students are taking more credit hours than the professor believes? Test an appropriate hypothesis and state your conclusion.
-Does this sample indicate that students are taking more credit hours than the professor believes? Test an appropriate hypothesis and state your conclusion.
Unlock Deck
Unlock for access to all 74 flashcards in this deck.
Unlock Deck
k this deck
32
Writing Scores A private high school is contemplating scheduling writing classes by gender. To assist in this decision, data of recent writing scores are collected and analyzed. It is believed that measurements of writing scores are normally distributed. Write a complete conclusion about writing scores based on the statistical software printout shown below.
Unlock Deck
Unlock for access to all 74 flashcards in this deck.
Unlock Deck
k this deck
33
Flight costs Every year Educational Services (ETS) selects readers for the Advanced Placement Exams. Recently the AP* Statistics exam has been graded in Lincoln, Nebraska. One objective of ETS is to achieve equity in grading by inviting teachers to be readers from all parts of the nation. However budgets are a consideration also. The accountants at ETS wonder if the flights from cities west of Lincoln are the same as flight costs from cities east of Lincoln. A random sample of the expense vouchers from last year was reviewed for the cost of airline tickets. Costs (in dollars) are shown in the table.
Indicate what inference procedure you would use to see if there is a significant difference in the costs of airline flights between the west and east coasts to Lincoln, Nebraska, then decide if it is okay to actually perform that inference procedure. (Check the appropriate assumptions and conditions and indicate whether you could or could not proceed. You do not have to do the actual test.)
Indicate what inference procedure you would use to see if there is a significant difference in the costs of airline flights between the west and east coasts to Lincoln, Nebraska, then decide if it is okay to actually perform that inference procedure. (Check the appropriate assumptions and conditions and indicate whether you could or could not proceed. You do not have to do the actual test.)
Unlock Deck
Unlock for access to all 74 flashcards in this deck.
Unlock Deck
k this deck
34
A soft drink company is conducting research to select a new design for the can. A random sample of participants has been selected. Instead of a typical taste test with two different sodas, they actually give each participant the same soda twice. One drink is served in a predominantly red can, the other in a predominantly blue can. The order is chosen randomly. Participants are asked to rate each drink on a scale of 1 to 10. Thus, the company wishes to test if the color of the can influences the rating. The ratings were recorded for
each participant. The data are shown in the table below. Does this sample indicate that there is a difference in the ratings? Test an appropriate hypothesis and state your conclusion.
each participant. The data are shown in the table below. Does this sample indicate that there is a difference in the ratings? Test an appropriate hypothesis and state your conclusion.
Unlock Deck
Unlock for access to all 74 flashcards in this deck.
Unlock Deck
k this deck
35
Game Wizard A friend of yours is constantly bragging that he performs exceptionally well at a popular video game since he scores an average of 1400 points. You think he is not all that hot. Having taken a statistics class, you know that you can actually test to see whether or not your friend scores higher than other players of the game. You collect a random sample of scores from other players at the local arcade and get the following data:
1375 1420 1250 1310 1450 1380 1390 1410 1290 1360
Is your friend right? That is, is there evidence that other players average less than 1400 points per game? Conduct a hypothesis test, making sure to state your conclusion in context of the problem.
1375 1420 1250 1310 1450 1380 1390 1410 1290 1360
Is your friend right? That is, is there evidence that other players average less than 1400 points per game? Conduct a hypothesis test, making sure to state your conclusion in context of the problem.
Unlock Deck
Unlock for access to all 74 flashcards in this deck.
Unlock Deck
k this deck
36
Improving Efficiency A distribution company considers hiring a national training consultant in hopes of improving efficiency in deliveries. The national consultant agrees to work with 30 drivers for one week as part of a trial before the manufacturing company makes a decision about the training program. The training program will be implemented if the average completed number of deliveries increases by more than 12 deliveries per day per driver. The distribution company manager will test a hypothesis using a = 0.02.
a. Write appropriate hypotheses (in words and in symbols).
b. In this context, which do you consider to be more serious - a Type I or a Type II error?
Explain briefly.
c. After this trial produced inconclusive results the manager decided to test the training
program again with another group of drivers. Describe two changes he could make in the trial to increase the power of the test, and explain the disadvantages of each.
Unlock Deck
Unlock for access to all 74 flashcards in this deck.
Unlock Deck
k this deck
37
Based on data from two very large independent samples, two students tested a hypothesis about equality of population means using a = 0.02. One student used a one-tail test and rejected the null hypothesis, but the other used a two-tail test and failed to reject the null hypothesis. Which of these might have been their calculated value of t?
A) 2.66
B) 1.88
C) 2.22
D) 1.22
E) 1.55
A) 2.66
B) 1.88
C) 2.22
D) 1.22
E) 1.55
Unlock Deck
Unlock for access to all 74 flashcards in this deck.
Unlock Deck
k this deck
38
Create and interpret a 95% confidence interval.
Unlock Deck
Unlock for access to all 74 flashcards in this deck.
Unlock Deck
k this deck
39
Before you took this course, you probably heard many stories about Statistics courses. Oftentimes parents of students have had bad experiences with Statistics courses and pass on their anxieties to their children. To test whether actually taking AP* Statistics decreases students' anxieties about statistics, an AP* statistics instructor gave a test to rate student anxiety at the beginning and end of his course. Anxiety levels were measured on a scale of 0-10. Here are the data for 16 randomly chosen students from a class of 180 students:
-Create and interpret a 90% confidence interval.
-Create and interpret a 90% confidence interval.
Unlock Deck
Unlock for access to all 74 flashcards in this deck.
Unlock Deck
k this deck
40
Insurance companies track life expectancy information to assist in determining the cost of life insurance policies. The insurance company knows that, last year, the life expectancy of its policyholders was 77 years. They want to know if their clients this year have a longer life expectancy, on average, so the company randomly samples some of the recently paid policies to see if the mean life expectancy of policyholders has increased. The insurance company will only change their premium structure if there is evidence that people who buy their policies are living longer than before.
-For more accurate cost determination, the insurance companies want to estimate the life expectancy to within one year with 95% confidence. How many randomly selected records would they need to have?
-For more accurate cost determination, the insurance companies want to estimate the life expectancy to within one year with 95% confidence. How many randomly selected records would they need to have?
Unlock Deck
Unlock for access to all 74 flashcards in this deck.
Unlock Deck
k this deck
41
Which statement correctly compares t-distributions to the Normal distribution?
I. t distributions are also mound shaped and symmetric.
II. t distributions are more spread out than the normal distribution.
III. As degrees of freedom increase, the variance of t distributions becomes larger.
A) I and III only
B) II only
C) I, II, and III
D) I and II only
E) I only
I. t distributions are also mound shaped and symmetric.
II. t distributions are more spread out than the normal distribution.
III. As degrees of freedom increase, the variance of t distributions becomes larger.
A) I and III only
B) II only
C) I, II, and III
D) I and II only
E) I only
Unlock Deck
Unlock for access to all 74 flashcards in this deck.
Unlock Deck
k this deck
42
Scrubbers A factory recently installed new pollution control equipment ("scrubbers") on its smokestacks in hopes of reducing air pollution levels at a nearby national park. Randomly timed measurements of sulfate levels (in micrograms per cubic meter) were taken before (Set C1) and after (Set C₂) the installation. We believe that measurements of sulfate levels are normally distributed. Write a complete conclusion about the effectiveness of these scrubbers based on the statistical software printout shown below.
Unlock Deck
Unlock for access to all 74 flashcards in this deck.
Unlock Deck
k this deck
43
Haircuts You need to find a new hair stylist and know that there are two terrific salons in your area, Hair by Charles and Curl Up & Dye. You want a really good haircut, but you do not want to pay too much for the cut. A random sample of costs for 10 different stylists was taken at each salon (each salon employs over 100 stylists).
a. Indicate what inference procedure you would use to see if there is a significant difference in the costs for haircuts at each salon. Check the appropriate assumptions and conditions and indicate whether you could or could not proceed. (Do not do the actual test.)
b. A friend tells you that he has heard that Curl Up & Dye is the more expensive salon.
i. Write hypotheses for your friend's claim.
ii. The following are computer outputs. Which output is the correct one to use for this test? Explain.
iii. Use the appropriate computer output to make a conclusion about the hypothesis test based on the data. Make sure to state your conclusion in context.
a. Indicate what inference procedure you would use to see if there is a significant difference in the costs for haircuts at each salon. Check the appropriate assumptions and conditions and indicate whether you could or could not proceed. (Do not do the actual test.)
b. A friend tells you that he has heard that Curl Up & Dye is the more expensive salon.
i. Write hypotheses for your friend's claim.
ii. The following are computer outputs. Which output is the correct one to use for this test? Explain.
iii. Use the appropriate computer output to make a conclusion about the hypothesis test based on the data. Make sure to state your conclusion in context.
Unlock Deck
Unlock for access to all 74 flashcards in this deck.
Unlock Deck
k this deck
44
Textbook authors must be careful that the reading level of their book is appropriate for the target audience. Some methods of assessing reading level require estimating the average word length. We've randomly chosen 20 words from a randomly selected page in Stats: Modeling the World and counted the number of letters in each word:
5, 5, 2, 11, 1, 5, 3, 8, 5, 4, 7, 2, 9, 4, 8, 10, 4, 5, 6, 6
-For a more definitive evaluation of reading level the editor wants to estimate the text's word length to within 0.5 letters with 98% confidence. How many randomly selected words does she need to use?
5, 5, 2, 11, 1, 5, 3, 8, 5, 4, 7, 2, 9, 4, 8, 10, 4, 5, 6, 6
-For a more definitive evaluation of reading level the editor wants to estimate the text's word length to within 0.5 letters with 98% confidence. How many randomly selected words does she need to use?
Unlock Deck
Unlock for access to all 74 flashcards in this deck.
Unlock Deck
k this deck
45
You could win a $1000 prize by tossing a coin in one of two games. To win Game A, you must get exactly 50% heads. To win Game B, you must get between 45% and 55% heads. Although which game you must play will be chosen randomly, then you may decide whether to toss the coin 20 times or 50 times. How many tosses would you choose to make?
A) 50 tosses for either.
B) 50 tosses for A, 20 tosses for B.
C) 20 tosses for either game.
D) It does not matter.
E) 20 tosses for A, 50 tosses for B.
A) 50 tosses for either.
B) 50 tosses for A, 20 tosses for B.
C) 20 tosses for either game.
D) It does not matter.
E) 20 tosses for A, 50 tosses for B.
Unlock Deck
Unlock for access to all 74 flashcards in this deck.
Unlock Deck
k this deck
46
Suppose that our editor was hoping that the book would have a mean word length of 6.5 letters. Does this sample indicate that the authors failed to meet this goal? Test an appropriate hypothesis and state your conclusion.
Unlock Deck
Unlock for access to all 74 flashcards in this deck.
Unlock Deck
k this deck
47
Gas mileage Hoping to improve the gas mileage of their cars, a car company has made an adjustment in the manufacturing process. Random samples of automobiles coming off the assembly line have been measured each week that the plant has been in operation. The data from before and after the manufacturing adjustments were made are in the table below. It is believed that measurements of gas mileage are normally distributed. Write a
complete conclusion about the manufacturing adjustments based on the statistical software
printout shown below.
complete conclusion about the manufacturing adjustments based on the statistical software
printout shown below.
Unlock Deck
Unlock for access to all 74 flashcards in this deck.
Unlock Deck
k this deck
48
Every year favorite songs compete to be on a Top 200 list based upon sales and rankings by the experts in the music industry. These songs have many characteristics, such as song length and beats per minute, which vary from category to category in the music industry. A disc jockey wondered if the number of beats per minute in songs classified as dance music were lower than the beats per minute in the songs that are ranked on a Top 200 list from 2001. A random sample of songs from each group was selected and the beats per minute are listed in the chart at the right. Does this sample indicate that songs classified as dance music have lower beats per minute than the songs ranked on a Top 200 list?
-Create and interpret a 90% confidence interval.
-Create and interpret a 90% confidence interval.
Unlock Deck
Unlock for access to all 74 flashcards in this deck.
Unlock Deck
k this deck
49
Test identification Suppose you were asked to analyze each of the situations described below. (NOTE: Do not do these problems!) For each, indicate which procedure you would use (pick the appropriate number from the list), the test statistic (z or t), and, if t, the number of degrees of freedom. A procedure may be used more than once.
1. proportion - 1 sample
2. difference of proportions - 2 samples
3. mean - 1 sample
4. difference of means - independent samples
5. mean of differences - matched pairs
a. A personal trainer would like to know if a newly designed bootcamp regimen will significantly build body mass index (BMI). In an effort to test this, the trainer recorded the BMI for 15 different clients prior to the bootcamp and after the bootcamp. The trainer assumes the BMI's are approximately normal. Does the bootcamp regimen as advertised? b. In a study to determine whether there is a difference between the average jail time black
and white offenders of minor drug possession are sentenced to, the law students randomly
selected 25 cases of each type that resulted in jail sentences during the previous year. A
90% confidence interval was created from the results.
c. A bank branch manager is interested in estimating the average wait time for customers in the teller line. The manager records the times for 40 randomly chosen customers.
Estimate the wait time with a 95% confidence interval.
d. A New York City mayoral candidate wants to assess his constituent's opinions on the controversial "Stop and Frisk" police tactics. A sample of voters from 2 boroughs (Queens and Brooklyn) is selected and asked if they approve of this policy. Do the approval rates
vary from each other?
e. Is there more gun violence in the summer heat than the winter cold? We get records of
the number of gunshot wounds in January and July in a random sample of 50 emergency rooms.
f. A board of directors of a local homeowner's association union organization wishes to amend the bylaws. A sample of the residents revealed 310 of 430 were in favor of the amendment. Does the board of directors have the required 75% majority?
Unlock Deck
Unlock for access to all 74 flashcards in this deck.
Unlock Deck
k this deck
50
Auto repairs An insurance company hopes to save money on repairs to autos involved in accidents. Two body shops in town seem to do most of the repairs, and the company wonders whether one of them is generally cheaper than the other. From their files of payments made during the past year they select a random sample of ten bills they paid at each repair shop. The data are shown in the table.
Indicate what inference procedure you would use to see if there is a significant difference in the costs of repairs done at these two body shops, then decide if it is okay to actually perform that inference procedure. (Check the appropriate assumptions and conditions and indicate whether you could or could not proceed. You do not have to do the actual test.)
Indicate what inference procedure you would use to see if there is a significant difference in the costs of repairs done at these two body shops, then decide if it is okay to actually perform that inference procedure. (Check the appropriate assumptions and conditions and indicate whether you could or could not proceed. You do not have to do the actual test.)
Unlock Deck
Unlock for access to all 74 flashcards in this deck.
Unlock Deck
k this deck
51
An elementary school principal wants to know the mean number of children in families whose children attend this school. He checks all the families using the school's registration records, and we use the computer to create a 95% confidence interval based on a t-distribution. This procedure was not appropriate. Why?
A) The recent record-setting family with twelve children is probably an outlier.
B) The entire population of families was gathered so there is no reason to do inference.
C) At a given school families are not randomly selected.
D) Since these families are from only one school, the family sizes may be skewed.
E) The population standard deviation is known, so he should have used a z-model.
Unlock Deck
Unlock for access to all 74 flashcards in this deck.
Unlock Deck
k this deck
52
Graduation tests Many states mandate tests that have to be passed in order for the students to graduate with a high school diploma. A local school superintendent believes that after-school tutoring will improve the scores of students in his district on the state's graduation test. A tutor agrees to work with 15 students for a month before the superintendent will approach the school board about implementing an after-school tutoring program. The after-school tutoring program will be implemented if student
scores increase by more than 20 points. The superintendent will test a hypothesis using a =
0.02 .
a. Write appropriate hypotheses (in words and in symbols).
b. In this context, which do you consider to be more serious - a Type I or a Type II error? Explain.
c. After this trial produced inconclusive results, the superintendent decided to test the
after-school tutoring program again with another group of students. Describe two changes he could make in the trial to increase the power of the test, and explain the disadvantages of each.
Unlock Deck
Unlock for access to all 74 flashcards in this deck.
Unlock Deck
k this deck
53
Vacation days The distribution of the number of vacation days per year offered by different U.S. companies is skewed to the right.
a. We collect data on the number of vacation days from a random sample of 60 companies across the United States. Why is it okay to use these data for inference even though the population is skewed?
b. The mean and standard deviation of the 60 companies in our sample were 22 days and 9 days, respectively. Specify the sampling model (shape, center, spread) for the mean
number of vacation days of such samples.
c. Find a 95% confidence interval for the mean number of vacation days offered by U.S.
companies.
d. Explain what "95% confidence" means in this context.
Unlock Deck
Unlock for access to all 74 flashcards in this deck.
Unlock Deck
k this deck
54
The average American sees 3.9 movies at the theater each year. A curious student polls 30 friends and family over the course of a week. He finds that his friends have seen an average of 4.5 movies with a standard deviation of 1.2 movies.
-Find and interpret a 95% confidence interval for this sample.
-Find and interpret a 95% confidence interval for this sample.
Unlock Deck
Unlock for access to all 74 flashcards in this deck.
Unlock Deck
k this deck
55
A professor at a large university believes that students take an average of 15 credit hours per term. A random sample of 24 students in her class of 250 students reported the following number of credit hours that they were taking:
-Find a 95% confidence interval for the number of credit hours taken by the students in the professor's class. Interpret your interval.
-Find a 95% confidence interval for the number of credit hours taken by the students in the professor's class. Interpret your interval.
Unlock Deck
Unlock for access to all 74 flashcards in this deck.
Unlock Deck
k this deck
56
Which of the following is true about Student's t-models?
I. They are unimodal, symmetric, and bell shaped.
II. They have fatter tails than the Normal model.
III. As the degrees of freedom increase, the t-models look more and more like the Normal.
A) I only
B) II and III
C) I, II, and III
D) I and II
E) I and III
I. They are unimodal, symmetric, and bell shaped.
II. They have fatter tails than the Normal model.
III. As the degrees of freedom increase, the t-models look more and more like the Normal.
A) I only
B) II and III
C) I, II, and III
D) I and II
E) I and III
Unlock Deck
Unlock for access to all 74 flashcards in this deck.
Unlock Deck
k this deck
57
The average American sees 3.9 movies at the theater each year. A curious student polls 30 friends and family over the course of a week. He finds that his friends have seen an average of 4.5 movies with a standard deviation of 1.2 movies.
-Does this sample provide evidence that people are attending the movies more often?
Provide a complete significance test to support your answer.
-Does this sample provide evidence that people are attending the movies more often?
Provide a complete significance test to support your answer.
Unlock Deck
Unlock for access to all 74 flashcards in this deck.
Unlock Deck
k this deck
58
Carry out the appropriate test and state your conclusion in context.
Unlock Deck
Unlock for access to all 74 flashcards in this deck.
Unlock Deck
k this deck
59
Every year favorite songs compete to be on a Top 200 list based upon sales and rankings by the experts in the music industry. These songs have many characteristics, such as song length and beats per minute, which vary from category to category in the music industry. A disc jockey wondered if the number of beats per minute in songs classified as dance music were lower than the beats per minute in the songs that are ranked on a Top 200 list from 2001. A random sample of songs from each group was selected and the beats per minute are listed in the chart at the right. Does this sample indicate that songs classified as dance music have lower beats per minute than the songs ranked on a Top 200 list?
-Test an appropriate hypothesis and state your conclusion.
-Test an appropriate hypothesis and state your conclusion.
Unlock Deck
Unlock for access to all 74 flashcards in this deck.
Unlock Deck
k this deck
60
Trainers need to estimate the level of fat in athletes to ensure good health. Initial tests were based on a small sample but now the trainers double the sample size for a follow-up test. The main purpose of the larger sample is to…
A) reduce confounding due to other variables.
B) reduce non-response bias.
C) reduce response bias.
D) decrease the standard deviation of the sampling model.
E) decrease the variability in the population.
A) reduce confounding due to other variables.
B) reduce non-response bias.
C) reduce response bias.
D) decrease the standard deviation of the sampling model.
E) decrease the variability in the population.
Unlock Deck
Unlock for access to all 74 flashcards in this deck.
Unlock Deck
k this deck
61
At one vehicle inspection station, 13 of 52 trucks and 11 of 88 cars failed the emissions test.Assuming these vehicles were representative of the cars and trucks in that area, what is theStandard error of the difference in the percentages of all cars and trucks that are not in compliance with air quality regulations?
A) 0.070
B) 0.095
C) 0.025
D) 0.049
E) 0.032
A) 0.070
B) 0.095
C) 0.025
D) 0.049
E) 0.032
Unlock Deck
Unlock for access to all 74 flashcards in this deck.
Unlock Deck
k this deck
62
The two samples whose statistics are given in the table are thought to come from populations with equal variances. What is the pooled estimate of the population standard deviation?
A) 5.46
B) 1.64
C) 5.59
D) 3.32
E) 5.50
A) 5.46
B) 1.64
C) 5.59
D) 3.32
E) 5.50
Unlock Deck
Unlock for access to all 74 flashcards in this deck.
Unlock Deck
k this deck
63
A survey asked people "On what percent of days do you get more than 30 minutes of vigorous exercise?" Using their responses we want to estimate the difference in exercise frequency between men and women. We should use a
A) 2-proportion z-interval
B) 1-proportion z-interval
C) 1-sample t-interval
D) 2-sample t-interval
E) matched pairs t-interval
A) 2-proportion z-interval
B) 1-proportion z-interval
C) 1-sample t-interval
D) 2-sample t-interval
E) matched pairs t-interval
Unlock Deck
Unlock for access to all 74 flashcards in this deck.
Unlock Deck
k this deck
64
Two agronomists analyzed the same data, testing the same null hypothesis about the proportion of tomato plants suffering from blight. One rejected the hypothesis but the other did not. Assuming neither made a mistake in calculations, which of these possible explanations could account for this apparent discrepancy?
I. One agronomist wrote a one-tailed alternative hypothesis, but the other used 2 tails.
II. They wrote identical hypotheses, but the one who rejected the null used a higher a-level. III. They wrote identical hypotheses, but the one who rejected the null used a lower a-level.
A) II only
B) I only
C) III only
D) I or III
E) I or II
Unlock Deck
Unlock for access to all 74 flashcards in this deck.
Unlock Deck
k this deck
65
At one SAT test site students taking the test for a second time volunteered to inhale supplemental oxygen for 10 minutes before the test. In fact, some received oxygen, but others (randomly assigned) were given just normal air. Test results showed that 42 of 66 students who breathed
Oxygen improved their SAT scores, compared to only 35 of 63 students who did not get the oxygen. Which procedure should we use to see if there is evidence that breathing extra oxygen can help
Test-takers think more clearly?
A) matched pairs t-test
B) 2-sample t-test
C) 2-proportion z-test
D) 1-proportion z-test
E) 1-sample t-test
Unlock Deck
Unlock for access to all 74 flashcards in this deck.
Unlock Deck
k this deck
66
A researcher found that a 98% confidence interval for the mean hours per week spent studying by college students was (13, 17). Which is true?
I. There is a 98% chance that the mean hours per week spent studying by college students is between 13 and 17 hours.
II. 98% of college students study between 13 and 17 hours a week.
III. Students average between 13 and 17 hours per week studying on 98% of the weeks.
A) II only
B) none
C) I and III
D) I only
E) III only
Unlock Deck
Unlock for access to all 74 flashcards in this deck.
Unlock Deck
k this deck
67
The two samples whose statistics are given in the table are thought to come from populations with equal variances. What is the pooled estimate of the population standard deviation?
A) 3.56
B) 3.52
C) 3.50
D) 1.87
E) 5.00
A) 3.56
B) 3.52
C) 3.50
D) 1.87
E) 5.00
Unlock Deck
Unlock for access to all 74 flashcards in this deck.
Unlock Deck
k this deck
68
The two samples whose statistics are given in the table are thought to come from populations with equal variances. What is the pooled estimate of the population standard deviation?
A) 10
B) 7.22
C) 7.14
D) 2.65
E) 7
A) 10
B) 7.22
C) 7.14
D) 2.65
E) 7
Unlock Deck
Unlock for access to all 74 flashcards in this deck.
Unlock Deck
k this deck
69
We want to know the mean winning score at the US Open golf championship. An internet search gives us all the scores for the history of that tournament, and we create a 95% confidence interval based on a t-distribution. This procedure was not appropriate. Why?
A) The entire population of scores was gathered so there is no reason to do inference.
B) Tiger Woods' recent record-setting score is probably an outlier.
C) Since these are the best players in the world, the scores are probably skewed.
D) The population standard deviation is known, so we should have used a z-model.
E) In big golf tournaments the players are not randomly selected.
Unlock Deck
Unlock for access to all 74 flashcards in this deck.
Unlock Deck
k this deck
70
Which statement correctly compares t-distributions to the normal distribution?
I. t distributions are also unimodal, mound shaped and symmetric.
II. t distributions have more spread than the normal distribution.
III. As degrees of freedom decrease, the variance of t distributions becomes smaller.
A) I only
B) I and II only
C) II only
D) I and III only
E) I, II, and III
I. t distributions are also unimodal, mound shaped and symmetric.
II. t distributions have more spread than the normal distribution.
III. As degrees of freedom decrease, the variance of t distributions becomes smaller.
A) I only
B) I and II only
C) II only
D) I and III only
E) I, II, and III
Unlock Deck
Unlock for access to all 74 flashcards in this deck.
Unlock Deck
k this deck
71
Which of the statements correctly compares t-distributions to the normal distribution?
I. t distributions are also mound shaped and symmetric.
II. t distributions have less spread than the normal distribution.
III. As degrees of freedom increase, the variance of t distributions becomes smaller.
A) I, II, and III
B) II only
C) I only
D) I and II only
E) I and III only
I. t distributions are also mound shaped and symmetric.
II. t distributions have less spread than the normal distribution.
III. As degrees of freedom increase, the variance of t distributions becomes smaller.
A) I, II, and III
B) II only
C) I only
D) I and II only
E) I and III only
Unlock Deck
Unlock for access to all 74 flashcards in this deck.
Unlock Deck
k this deck
72
A random sample of 120 college seniors found that 30% of them had been offered jobs. What is the standard error of the sample proportion?
A) 0.042
B) 0.046
C) 0.458
D) 0.028
E) 0.082
A) 0.042
B) 0.046
C) 0.458
D) 0.028
E) 0.082
Unlock Deck
Unlock for access to all 74 flashcards in this deck.
Unlock Deck
k this deck
73
A random sample of 120 classrooms at a large university found that 70% of them had been cleaned properly. What is the standard error of the sample proportion?
A) 0.042
B) 0.028
C) 0.458
D) 0.082
E) 0.046
A) 0.042
B) 0.028
C) 0.458
D) 0.082
E) 0.046
Unlock Deck
Unlock for access to all 74 flashcards in this deck.
Unlock Deck
k this deck
74
Food inspectors need to estimate the level of contaminants in food products packaged at a certain factory. Initial tests were based on a small sample but now the inspectors double the sample size for a follow-up test. The main purpose of the larger sample is to
A) reduce confounding due to other variables.
B) decrease the variability in the population.
C) reduce non-response bias.
D) decrease the standard deviation of the sampling model.
E) reduce response bias.
A) reduce confounding due to other variables.
B) decrease the variability in the population.
C) reduce non-response bias.
D) decrease the standard deviation of the sampling model.
E) reduce response bias.
Unlock Deck
Unlock for access to all 74 flashcards in this deck.
Unlock Deck
k this deck
Unlock Deck
Unlock for access to all 74 flashcards in this deck.


