Deck 1: Introduction to Data
Full screen (f)
Question
Question
Question
Question
Question
Question
In a survey, high school graduates were asked "Did you play sports in high school?" The response was electronically recorded as a "1" for yes and a "0" for no. This is an example of . 
A)Coded categorical data
B)Unstacked numerical data
C)Random sample
D)None of these
A)Coded categorical data
B)Unstacked numerical data
C)Random sample
D)None of these
Question
Researches want to find out which U. S. movie has the most positive audience reaction for the current week. As they exited a randomly selected movie theater, movie- goers were asked to give the movie they had just viewed a letter grade of A, B, C, D, or F. In this scenario, the movie- goers are an example of a . 
A)Population
B)Sample
C)Variable
A)Population
B)Sample
C)Variable
Question
Question
Question
Question
Question
Question
Question
Question
Question
Question
Question
Question
Question
A group of adults was given a new high protein breakfast bar then asked to record their level of alertness just before lunchtime. In this example, is the treatment variable and  is the outcome variable.

A)The group of adults; alertness level
B)Alertness level; the breakfast bar
C)The breakfast bar; lunchtime
D)The breakfast bar; alertness level
is the outcome variable.A)The group of adults; alertness level
B)Alertness level; the breakfast bar
C)The breakfast bar; lunchtime
D)The breakfast bar; alertness level
Question
Question
The two- way table below shows the survey results when sixty adults were asked whether they had made a clothing purchase in the last thirty days.

What percentage of the sample had not made a clothing purchase in the past thirty days?
A)35%
B)50%
C)65%
D)33%
What percentage of the sample had not made a clothing purchase in the past thirty days?
A)35%
B)50%
C)65%
D)33%
Question
Question
Question
Question
Question
Question
Question
In a survey, married couples were asked, "Do you have children?" The response was electronically recorded as a "1" for yes and a "0" for no. This is an example of . 
A)Unstacked numerical data
B)Random sample
C)Coded categorical data
D)None of these
A)Unstacked numerical data
B)Random sample
C)Coded categorical data
D)None of these
Question
The two- way table below shows teenage driver gender and whether or not the respondent had texted at least once while driving during the last thirty days.
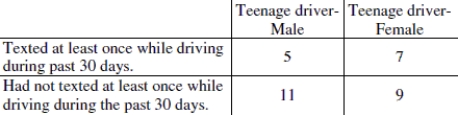
What percentage of the sample were female drivers?
A)78%
B)50%
C)28.3%
D)62.5%
What percentage of the sample were female drivers?
A)78%
B)50%
C)28.3%
D)62.5%
Question
Question
Question
The two- way table below shows the survey results when sixty adults were asked whether they had made a clothing purchase in the last thirty days.
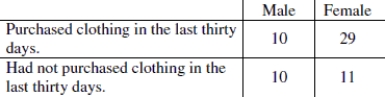
Of the adult males surveyed, what percentage had made a clothing purchase in the last thirty days?
A)35%
B)50%
C)65%
D)33%
Of the adult males surveyed, what percentage had made a clothing purchase in the last thirty days?
A)35%
B)50%
C)65%
D)33%
Question
A group of college students was given a new energy drink then asked to record their level of alertness at midday. In this example, is the treatment variable and  is the outcome variable.

A)The energy drink; alertness level
B)Alertness level; the energy drink
C)The energy drink; midday
D)The group of college students; alertness level
is the outcome variable.A)The energy drink; alertness level
B)Alertness level; the energy drink
C)The energy drink; midday
D)The group of college students; alertness level
Question
Question
Question
The two- way table below shows teenage driver gender and whether or not the respondent had texted at least once while driving during the last thirty days.

What percentage of the sample had texted at least once while driving in the past thirty days?
A)37.5%
B)43.75%
C)62.5%
D)50%
What percentage of the sample had texted at least once while driving in the past thirty days?
A)37.5%
B)43.75%
C)62.5%
D)50%
Question
Question
Question
Question
Question
Question
Question
Question
Question
Question
Answer the question using the following table showing fatal injury counts by four major categories from 2004- 2009 for Michigan Residents. The table shows total counts for all ages and both sexes.
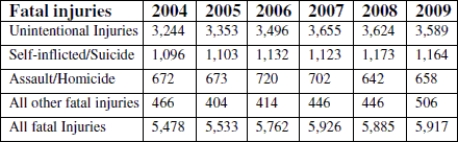
Was this data collected using an observational study or a controlled experiment?
Was this data collected using an observational study or a controlled experiment?
Question
Question
Question
Question
Question
Question
Question
Question
Question
Answer the question using the following table showing fatal injury counts by four major categories from 2004 Michigan Residents. The table shows total counts for all ages and both sexes.

Write a statement comparing the rate of fatal injuries that were self- inflicted or suicide from 2005 to 2006. Why is it important to compare rates and not total numbers?
Write a statement comparing the rate of fatal injuries that were self- inflicted or suicide from 2005 to 2006. Why is it important to compare rates and not total numbers?
Question
Question
Question
Question

Unlock Deck
Sign up to unlock the cards in this deck!
Unlock Deck
Unlock Deck
1/60
Play
Full screen (f)
Deck 1: Introduction to Data
1
Which of the following measurements is likely to have the least variation?
A)The individual heights of children, measured in inches, in a randomly selected class of sixth grade students.
B)The individual mass measured in grams of quarters in a randomly selected ten dollar roll of quarters.
C)The individual weights in ounces of oranges in a randomly selected five- pound bag of oranges at the market.
The individual mass measured in grams of quarters in a randomly selected ten dollar roll of quarters.
2
A two- way table is useful for summarizing and comparing what?
A)A numerical variable and categorical variable that may be related.
B)Two categorical variables that may be related.
C)Two numerical variables that may be related.
A)A numerical variable and categorical variable that may be related.
B)Two categorical variables that may be related.
C)Two numerical variables that may be related.
Two categorical variables that may be related.
3
The average number of hours spent completing statistics homework for a randomly selected group of statistics students is an example of what type of variable?
A)Categorical variable
B)Numerical variable
C)Neither
A)Categorical variable
B)Numerical variable
C)Neither
Numerical variable
4
The obesity rates of elementary age children living in urban areas are compared to those living in rural areas to see whether children in urban settings have higher obesity rates.
A)Controlled experiment
B)Observational study
A)Controlled experiment
B)Observational study
Unlock Deck
Unlock for access to all 60 flashcards in this deck.
Unlock Deck
k this deck
5
A group of cancer patients is divided into two groups. One group is given a new drug to fight the side effects of chemotherapy and the other group is given a placebo. After three months they are asked to respond to a questionnaire about the frequency and severity of their side effects to see whether the new drug improved the overall negative side effects of chemotherapy.
A)Controlled experiment
B)Observational study
A)Controlled experiment
B)Observational study
Unlock Deck
Unlock for access to all 60 flashcards in this deck.
Unlock Deck
k this deck
6
In a survey, high school graduates were asked "Did you play sports in high school?" The response was electronically recorded as a "1" for yes and a "0" for no. This is an example of .
A)Coded categorical data
B)Unstacked numerical data
C)Random sample
D)None of these
A)Coded categorical data
B)Unstacked numerical data
C)Random sample
D)None of these
Unlock Deck
Unlock for access to all 60 flashcards in this deck.
Unlock Deck
k this deck
7
Researches want to find out which U. S. movie has the most positive audience reaction for the current week. As they exited a randomly selected movie theater, movie- goers were asked to give the movie they had just viewed a letter grade of A, B, C, D, or F. In this scenario, the movie- goers are an example of a .
A)Population
B)Sample
C)Variable
A)Population
B)Sample
C)Variable
Unlock Deck
Unlock for access to all 60 flashcards in this deck.
Unlock Deck
k this deck
8
Which of the following is not an example of data?
A)A chart showing the number of mailboxes per city block for a map of 10 city blocks.
B)A list of the length of the 25 most popular pop songs of the year.
C)A list showing the amount of money collected at an annual charity raffle for the past 10 years.
D)All of these are examples of data
A)A chart showing the number of mailboxes per city block for a map of 10 city blocks.
B)A list of the length of the 25 most popular pop songs of the year.
C)A list showing the amount of money collected at an annual charity raffle for the past 10 years.
D)All of these are examples of data
Unlock Deck
Unlock for access to all 60 flashcards in this deck.
Unlock Deck
k this deck
9
A state senator's comments about the dangers of global warming are an example of what type of variable?
A)Numerical variable
B)Categorical variable
C)Neither
A)Numerical variable
B)Categorical variable
C)Neither
Unlock Deck
Unlock for access to all 60 flashcards in this deck.
Unlock Deck
k this deck
10
Consider the following statement: "Researched conducted a large observational study and determined that children who participated in school music programs scored higher on math exams in later grades than those who did not." Suppose that upon hearing this a politician states that all children should participate in school music programs. What is wrong with the politician's statement?
A)The politician confused correlation with causation.
B)This study exhibits bias.
C)The controlled experiment was not double- blinded.
D)There was a placebo effect.
A)The politician confused correlation with causation.
B)This study exhibits bias.
C)The controlled experiment was not double- blinded.
D)There was a placebo effect.
Unlock Deck
Unlock for access to all 60 flashcards in this deck.
Unlock Deck
k this deck
11
The gender of a sample of adults was recorded, and then they were asked whether they had used a postage stamp in the last thirty days. A good way to organize this categorical data is in a
A)Unstacked data table.
B)Scatterplot.
C)Two- way table.
D)None of these
A)Unstacked data table.
B)Scatterplot.
C)Two- way table.
D)None of these
Unlock Deck
Unlock for access to all 60 flashcards in this deck.
Unlock Deck
k this deck
12
"People with diabetes are at higher risk for certain cancers than those without the blood sugar disease, suggests a new study based on a telephone survey of nearly 400,000 adults."
A)Observational study
B)Controlled experiment
A)Observational study
B)Controlled experiment
Unlock Deck
Unlock for access to all 60 flashcards in this deck.
Unlock Deck
k this deck
13
Which of the following measurements is likely to have the most variation?
A)The individual weights in ounces of potatoes in a randomly selected crate of potatoes.
B)The individual weights in ounces of tennis balls in a randomly selected can of tennis balls.
C)The volume of individual pop cans measured in fluid ounces from a randomly selected twenty- four pack.
A)The individual weights in ounces of potatoes in a randomly selected crate of potatoes.
B)The individual weights in ounces of tennis balls in a randomly selected can of tennis balls.
C)The volume of individual pop cans measured in fluid ounces from a randomly selected twenty- four pack.
Unlock Deck
Unlock for access to all 60 flashcards in this deck.
Unlock Deck
k this deck
14
The average gas mileage of the top selling mini- vans for each U. S. car manufacturer is an example of what type of variable?
A)Categorical variable
B)Numerical variable
C)Neither
A)Categorical variable
B)Numerical variable
C)Neither
Unlock Deck
Unlock for access to all 60 flashcards in this deck.
Unlock Deck
k this deck
15
A group of students is divided into two groups. One group is a given a new chewable vitamin and the other group is given a placebo. After six months they are asked to fill out a questionnaire and given a health exam to see whether the new vitamin has health benefits that are better than a placebo.
A)Controlled experiment
B)Observational study
A)Controlled experiment
B)Observational study
Unlock Deck
Unlock for access to all 60 flashcards in this deck.
Unlock Deck
k this deck
16
In a sample of 775 senior citizens, approximately 67% said that they had seen a television commercial for life insurance. About how many senior citizens is this?
A)256
B)519
C)Not enough information available.
D)67
A)256
B)519
C)Not enough information available.
D)67
Unlock Deck
Unlock for access to all 60 flashcards in this deck.
Unlock Deck
k this deck
17
Marital status of each member of a randomly selected group of adults is an example of what type of variable?
A)Categorical variable
B)Numerical variable
C)Neither
A)Categorical variable
B)Numerical variable
C)Neither
Unlock Deck
Unlock for access to all 60 flashcards in this deck.
Unlock Deck
k this deck
18
The number of parents who attended parent teacher conferences at a local elementary school is an example of what type of variable?
A)Categorical variable
B)Numerical variable
C)Neither
A)Categorical variable
B)Numerical variable
C)Neither
Unlock Deck
Unlock for access to all 60 flashcards in this deck.
Unlock Deck
k this deck
19
A group of students is divided into two groups. One group listens to classical music while taking a math test and the other group takes the test in silence. The average test scores of the two groups are compared to see whether listening to music during a math test has an effect on scores.
A)Controlled experiment
B)Observational study
A)Controlled experiment
B)Observational study
Unlock Deck
Unlock for access to all 60 flashcards in this deck.
Unlock Deck
k this deck
20
A group of adults was given a new high protein breakfast bar then asked to record their level of alertness just before lunchtime. In this example, is the treatment variable and is the outcome variable.
A)The group of adults; alertness level
B)Alertness level; the breakfast bar
C)The breakfast bar; lunchtime
D)The breakfast bar; alertness level
is the outcome variable.A)The group of adults; alertness level
B)Alertness level; the breakfast bar
C)The breakfast bar; lunchtime
D)The breakfast bar; alertness level
Unlock Deck
Unlock for access to all 60 flashcards in this deck.
Unlock Deck
k this deck
21
Choose the best answer to complete the statement: "In a statistical context, the term variable is used. . ."
A)because, like algebra, a statistical variable stands in for some unknown numerical value.
B)because it describes a characteristic of the population which is never known.
C)because it is too difficult to get certain information from each member of a population.
D)because there is variability in the information gathered from the members of a sample or population.
Unlock Deck
Unlock for access to all 60 flashcards in this deck.
Unlock Deck
k this deck
22
The two- way table below shows the survey results when sixty adults were asked whether they had made a clothing purchase in the last thirty days.
What percentage of the sample had not made a clothing purchase in the past thirty days?
A)35%
B)50%
C)65%
D)33%
What percentage of the sample had not made a clothing purchase in the past thirty days?
A)35%
B)50%
C)65%
D)33%
Unlock Deck
Unlock for access to all 60 flashcards in this deck.
Unlock Deck
k this deck
23
What is the approximate percentage of study participants who are women in this study who said that they prefer to drive a SUV to driving a compact car?
A)16.7%
B)61.9%
C)26.9%
A)16.7%
B)61.9%
C)26.9%
Unlock Deck
Unlock for access to all 60 flashcards in this deck.
Unlock Deck
k this deck
24
Consider the following statement "My child was bullied on the school bus and so was my neighbors child, so obviously, bullying is a big problem on school buses and something needs to be done about it!" What is wrong with this statement?
A)The person making the statement confused correlation with causation.
B)The statement exhibits bias.
C)The statement is anecdotal.
D)None of these-- the statement is valid.
A)The person making the statement confused correlation with causation.
B)The statement exhibits bias.
C)The statement is anecdotal.
D)None of these-- the statement is valid.
Unlock Deck
Unlock for access to all 60 flashcards in this deck.
Unlock Deck
k this deck
25
The deacons at a local church surveyed the congregation to find out if members would be willing to fund a new construction project. In this example, what is the population of interest?
A)The deacons
B)The survey respondents
C)The congregation
D)None of these
A)The deacons
B)The survey respondents
C)The congregation
D)None of these
Unlock Deck
Unlock for access to all 60 flashcards in this deck.
Unlock Deck
k this deck
26
Consider the following statement, "Babies who breastfeed are less likely to grow into children with behavioral problems by the time they reach age 5 than those who receive formula milk." Which of the following is a plausible confounding variable in this study?
A)Mothers social- economic status
B)The age at which breastfeeding ends
C)The quality of the formula milk
D)All of these
E)None of these
A)Mothers social- economic status
B)The age at which breastfeeding ends
C)The quality of the formula milk
D)All of these
E)None of these
Unlock Deck
Unlock for access to all 60 flashcards in this deck.
Unlock Deck
k this deck
27
The ethnicity of the individual respondents in a political poll of a randomly selected group of adults is an example of what type of variable?
A)Categorical variable
B)Numerical variable
C)Neither
A)Categorical variable
B)Numerical variable
C)Neither
Unlock Deck
Unlock for access to all 60 flashcards in this deck.
Unlock Deck
k this deck
28
What is the approximate percentage of men in this study who prefer to rent a movie on DVD?
A)5%
B)36%
C)13.8%
A)5%
B)36%
C)13.8%
Unlock Deck
Unlock for access to all 60 flashcards in this deck.
Unlock Deck
k this deck
29
In a survey, married couples were asked, "Do you have children?" The response was electronically recorded as a "1" for yes and a "0" for no. This is an example of .
A)Unstacked numerical data
B)Random sample
C)Coded categorical data
D)None of these
A)Unstacked numerical data
B)Random sample
C)Coded categorical data
D)None of these
Unlock Deck
Unlock for access to all 60 flashcards in this deck.
Unlock Deck
k this deck
30
The two- way table below shows teenage driver gender and whether or not the respondent had texted at least once while driving during the last thirty days.
What percentage of the sample were female drivers?
A)78%
B)50%
C)28.3%
D)62.5%
What percentage of the sample were female drivers?
A)78%
B)50%
C)28.3%
D)62.5%
Unlock Deck
Unlock for access to all 60 flashcards in this deck.
Unlock Deck
k this deck
31
Which of the following is not an example of data?
A)A list of the number of cars that are stopped at stop sign at a busy intersection. The number of cars waiting is recorded every 15 minutes for 8 hours.
B)A chart showing the number of goals scored per game for a NHL hockey team during one whole season.
C)A list of receipt totals from one day at a national department store.
D)All of these are examples of data.
Unlock Deck
Unlock for access to all 60 flashcards in this deck.
Unlock Deck
k this deck
32
Suppose you are presented with a dataset containing the ages of 50 randomly selected adults and the amount of money they spent at a certain grocery store on a certain day. Which of following questions do not need to be asked about the dataset?
A)Who collected the data?
B)Were the names of respondents recorded so that they could be contacted later if necessary?
C)How was the data collected?
D)Why was the data collected?
A)Who collected the data?
B)Were the names of respondents recorded so that they could be contacted later if necessary?
C)How was the data collected?
D)Why was the data collected?
Unlock Deck
Unlock for access to all 60 flashcards in this deck.
Unlock Deck
k this deck
33
The two- way table below shows the survey results when sixty adults were asked whether they had made a clothing purchase in the last thirty days.
Of the adult males surveyed, what percentage had made a clothing purchase in the last thirty days?
A)35%
B)50%
C)65%
D)33%
Of the adult males surveyed, what percentage had made a clothing purchase in the last thirty days?
A)35%
B)50%
C)65%
D)33%
Unlock Deck
Unlock for access to all 60 flashcards in this deck.
Unlock Deck
k this deck
34
A group of college students was given a new energy drink then asked to record their level of alertness at midday. In this example, is the treatment variable and is the outcome variable.
A)The energy drink; alertness level
B)Alertness level; the energy drink
C)The energy drink; midday
D)The group of college students; alertness level
is the outcome variable.A)The energy drink; alertness level
B)Alertness level; the energy drink
C)The energy drink; midday
D)The group of college students; alertness level
Unlock Deck
Unlock for access to all 60 flashcards in this deck.
Unlock Deck
k this deck
35
What is the approximate percentage of study participants who are women?
A)61.9%
B)16.7%
C)Not enough information available
D)26.9%
A)61.9%
B)16.7%
C)Not enough information available
D)26.9%
Unlock Deck
Unlock for access to all 60 flashcards in this deck.
Unlock Deck
k this deck
36
What is the approximate percentage of women who participated in this study?
A)7.8%
B)41%
C)63.9%
D)Not enough information available
A)7.8%
B)41%
C)63.9%
D)Not enough information available
Unlock Deck
Unlock for access to all 60 flashcards in this deck.
Unlock Deck
k this deck
37
The two- way table below shows teenage driver gender and whether or not the respondent had texted at least once while driving during the last thirty days.
What percentage of the sample had texted at least once while driving in the past thirty days?
A)37.5%
B)43.75%
C)62.5%
D)50%
What percentage of the sample had texted at least once while driving in the past thirty days?
A)37.5%
B)43.75%
C)62.5%
D)50%
Unlock Deck
Unlock for access to all 60 flashcards in this deck.
Unlock Deck
k this deck
38
The smoking rates of teens in urban areas are compared to those living in rural areas to see whether teens living in rural settings have higher rates of smoking.
A)Controlled experiment
B)Observational study
A)Controlled experiment
B)Observational study
Unlock Deck
Unlock for access to all 60 flashcards in this deck.
Unlock Deck
k this deck
39
Consider the following statement, "In a nationwide study, children on an all- organic diet are more alert in school than those not on an all- organic diet." Which of the following is a plausible confounding variable in this study?
A)Parents' social- economic status
B)School start times
C)The quality of the non- organic diet
D)All of these
E)None of these
A)Parents' social- economic status
B)School start times
C)The quality of the non- organic diet
D)All of these
E)None of these
Unlock Deck
Unlock for access to all 60 flashcards in this deck.
Unlock Deck
k this deck
40
In a sample of 800 first- year college students, 72% said that they check their Facebook page at least three times a day. How many students is this?
A)576
B)72
C)224
D)Not enough information available.
A)576
B)72
C)224
D)Not enough information available.
Unlock Deck
Unlock for access to all 60 flashcards in this deck.
Unlock Deck
k this deck
41
Explain the difference between an observational study and an anecdote. Be sure to provide an example of each.
Unlock Deck
Unlock for access to all 60 flashcards in this deck.
Unlock Deck
k this deck
42
Use the following description of a controlled experiment:
Two similar kindergarten classrooms, each containing 20- 25 students, have agreed to participate in a study to see if incorporating math manipulatives into the teacher's lesson improves understanding of new concepts in geometry, like recognizing shapes and similarities in shapes. The teacher in one classroom gives a standard lesson without the use of manipulatives then gives a three- question quiz about the new geometry concepts that were taught. The teacher in the second classroom gives a geometry lesson that incorporates the use of math manipulatives. The same three- question quiz is given and the scores of the two classrooms are compared to see whether the use of math manipulatives improved quiz scores.
Which features of a well- designed control experiment does this study have? Which features are missing?
Unlock Deck
Unlock for access to all 60 flashcards in this deck.
Unlock Deck
k this deck
43
Identify the sample and the population it is most likely intended to represent: The manager at a bicycle store asks 30 customers if they would be interested in participating in a weekly group ride.
Unlock Deck
Unlock for access to all 60 flashcards in this deck.
Unlock Deck
k this deck
44
In a study of National Hockey League statistics, the data of Stanley cups wins per team and the number of
fights on the ice during Stanley cup play- off games was compared. It is found that there is a positive correlation between the number of fights on the ice of a NHL team and the number of Stanley cup wins for that team. That is, NHL teams with more fights on the ice tend to have more Stanley cups. A sportscaster makes the following statement: "If a team wants to win a Stanley cup the players should start as many fights on the ice as possible." What is wrong with the sportscaster's statement?
fights on the ice during Stanley cup play- off games was compared. It is found that there is a positive correlation between the number of fights on the ice of a NHL team and the number of Stanley cup wins for that team. That is, NHL teams with more fights on the ice tend to have more Stanley cups. A sportscaster makes the following statement: "If a team wants to win a Stanley cup the players should start as many fights on the ice as possible." What is wrong with the sportscaster's statement?
Unlock Deck
Unlock for access to all 60 flashcards in this deck.
Unlock Deck
k this deck
45
What is the rate of fatal injuries caused by Assault/Homicide in 2008?
Unlock Deck
Unlock for access to all 60 flashcards in this deck.
Unlock Deck
k this deck
46
Explain what a categorical variable is and give an example of a categorical variable.
Unlock Deck
Unlock for access to all 60 flashcards in this deck.
Unlock Deck
k this deck
47
Answer the question using the following table showing fatal injury counts by four major categories from 2004- 2009 for Michigan Residents. The table shows total counts for all ages and both sexes.
Was this data collected using an observational study or a controlled experiment?
Was this data collected using an observational study or a controlled experiment?
Unlock Deck
Unlock for access to all 60 flashcards in this deck.
Unlock Deck
k this deck
48
Name two of the four key features of a well- designed controlled experiment. When is it important to have a well- designed controlled experiment?
Unlock Deck
Unlock for access to all 60 flashcards in this deck.
Unlock Deck
k this deck
49
How many men are in this sample? What percent of the sample are men? Round to the nearest whole percent.
Unlock Deck
Unlock for access to all 60 flashcards in this deck.
Unlock Deck
k this deck
50
Time Magazine online posted an article that claims that a long work commute (45 minutes or more)is harmful to overall well- being and can contribute to obesity, stress, and loneliness ? HYPERLINK "http://www.healthland.time.com/2011)" ?(www.healthland.time.com/2011). ?Is this more likely to be an observational study or a controlled experiment? Why? Can the reader conclude that taking a job with a long commute will result in poorer health?
Unlock Deck
Unlock for access to all 60 flashcards in this deck.
Unlock Deck
k this deck
51
Identify the sample and the population it is most likely intended to represent.
Unlock Deck
Unlock for access to all 60 flashcards in this deck.
Unlock Deck
k this deck
52
Explain what a numerical variable is and give an example of a numerical variable.
Unlock Deck
Unlock for access to all 60 flashcards in this deck.
Unlock Deck
k this deck
53
Consider the statement "Data are numbers in context." Consider a randomly selected group of newborn babies born in a large city. Describe one possible type of numerical data that could be reported about this group that might be of interest to obstetricians.
Unlock Deck
Unlock for access to all 60 flashcards in this deck.
Unlock Deck
k this deck
54
A sticker on a new car advertises that it gets 34 miles per gallon, but cautions that results may vary. Explain what variation means in this context.
Unlock Deck
Unlock for access to all 60 flashcards in this deck.
Unlock Deck
k this deck
55
Based on this sample, are women more or less likely to oppose the helmet law than men?
Unlock Deck
Unlock for access to all 60 flashcards in this deck.
Unlock Deck
k this deck
56
Answer the question using the following table showing fatal injury counts by four major categories from 2004 Michigan Residents. The table shows total counts for all ages and both sexes.
Write a statement comparing the rate of fatal injuries that were self- inflicted or suicide from 2005 to 2006. Why is it important to compare rates and not total numbers?
Write a statement comparing the rate of fatal injuries that were self- inflicted or suicide from 2005 to 2006. Why is it important to compare rates and not total numbers?
Unlock Deck
Unlock for access to all 60 flashcards in this deck.
Unlock Deck
k this deck
57
Use the following description of a controlled experiment:
Two similar kindergarten classrooms, each containing 20- 25 students, have agreed to participate in a study to see if incorporating math manipulatives into the teacher's lesson improves understanding of new concepts in geometry, like recognizing shapes and similarities in shapes. The teacher in one classroom gives a standard lesson without the use of manipulatives then gives a three- question quiz about the new geometry concepts that were taught. The teacher in the second classroom gives a geometry lesson that incorporates the use of math manipulatives. The same three- question quiz is given and the scores of the two classrooms are compared to see whether the use of math manipulatives improved quiz scores.
In this study, what is the treatment variable and the response variable?
Unlock Deck
Unlock for access to all 60 flashcards in this deck.
Unlock Deck
k this deck
58
Overall, what percentage of the sample supports the helmet law? Round to the nearest whole percent.
Unlock Deck
Unlock for access to all 60 flashcards in this deck.
Unlock Deck
k this deck
59
If possible, answer the following questions about the context of this study:
a. What are the objects of interest?
b. What variables are being measured?
c. How were the variables measured?
d. Who collected the data?
e. How did they collect the data?
a. What are the objects of interest?
b. What variables are being measured?
c. How were the variables measured?
d. Who collected the data?
e. How did they collect the data?
Unlock Deck
Unlock for access to all 60 flashcards in this deck.
Unlock Deck
k this deck
60
Among the women surveyed, what percent support the helmet law? Round to the nearest whole percent.
Unlock Deck
Unlock for access to all 60 flashcards in this deck.
Unlock Deck
k this deck
Unlock Deck
Unlock for access to all 60 flashcards in this deck.


