Deck 8: Introduction to Statistical Quality Control
Full screen (f)
Question
Question
Question
Question
Question
Question
Question
Question
Question
Question
Question
Question
For a process that is in control,a quantitative sample statistic will run randomly between ________.
A)μ ± 3σ
B) ±
± 
C)μ ± σ
D) ± sx
± sx
A)μ ± 3σ
B)
± C)μ ± σ
D)
± sx Question
Question
Question
Question
Question
Question
Question
Question
Question
Find the control limits for the R-chart with  = 7 and sample size of 7.
A)LCL = 2.622 and UCL = 66.378
B)LCL = 0 and UCL = 14.028
C)LCL = 0.532 and UCL = 13.468
D)LCL = 27.5 and UCL = 41.5
= 7 and sample size of 7.A)LCL = 2.622 and UCL = 66.378
B)LCL = 0 and UCL = 14.028
C)LCL = 0.532 and UCL = 13.468
D)LCL = 27.5 and UCL = 41.5
Question
Find the control limits for the  -chart with
  = 4.96,
  = 0.0285,and sample size of 5.
A)LCL = 4.939 and UCL = 4.981
B)LCL = 4.944 and UCL = 4.976
C)LCL = 4.796 and UCL = 5.124
D)The sample size is too small to determine control limits.
-chart with = 4.96, = 0.0285,and sample size of 5.A)LCL = 4.939 and UCL = 4.981
B)LCL = 4.944 and UCL = 4.976
C)LCL = 4.796 and UCL = 5.124
D)The sample size is too small to determine control limits.
Question
Find the control limits for the  -chart with
  = 0.45,
  = 0.02,and sample size of 15.
A)The R is too small to determine control limits.
B)LCL = 0.445 and UCL = 0.455
C)LCL = 0.446 and UCL = 0.454
D)LCL = 0.443 and UCL = 0.457
-chart with = 0.45, = 0.02,and sample size of 15.A)The R is too small to determine control limits.
B)LCL = 0.445 and UCL = 0.455
C)LCL = 0.446 and UCL = 0.454
D)LCL = 0.443 and UCL = 0.457
Question
Question
The  -chart is used to monitor the ________ for variables data over time.
A)centering of the process output
B)range of the process output
C)strength of the process output
D)variability of the process output
-chart is used to monitor the ________ for variables data over time.A)centering of the process output
B)range of the process output
C)strength of the process output
D)variability of the process output
Question
The  -chart monitors the centering of process output for variables data over time by plotting the ________.
A)range of each sample
B)standard deviation of each sample
C)sum of each sample
D)mean of each sample
-chart monitors the centering of process output for variables data over time by plotting the ________.A)range of each sample
B)standard deviation of each sample
C)sum of each sample
D)mean of each sample
Question
Question
Question
Find the control limits for the R-chart with  = 0.0285 and sample size of 5.
A)LCL = 0 and UCL = 0.065
B)LCL = 0 and UCL = 0.060
C)LCL = 0.021 and UCL = 0.065
D)The sample size is too small to determine control limits.
= 0.0285 and sample size of 5.A)LCL = 0 and UCL = 0.065
B)LCL = 0 and UCL = 0.060
C)LCL = 0.021 and UCL = 0.065
D)The sample size is too small to determine control limits.
Question
A table of values can be used to help calculate R-chart control limits because the constants have been determined from the sampling distribution of R so that ________.
A)D4 =
=  - 3sR and D3
 =
=  + 3sR
+ 3sR
B)D4 =
=  + 3sR and D3
 =
=  - 3sR
- 3sR
C)D4 =
=  - sR and D3
 =
=  + sR
+ sR
D)D =
=  ± A2R.
A)D4
= - 3sR and D3 = + 3sRB)D4
= + 3sR and D3 = - 3sRC)D4
= - sR and D3 = + sRD)D
= ± A2R. Question
The control limits for the  -chart are found by using ________.
A) ± 3R
± 3R
B) ± A
± A 

C) ± R
± R
D) ± 3sx
± 3sx
-chart are found by using ________.A)
± 3RB)
± A C)
± RD)
± 3sx Question
Find the control limits for the  -chart with
  = 34.5,
  = 7,and sample size of 12.
A)LCL = 32.505 and UCL = 36.495
B)LCL = -49.5 and UCL = 118.5
C)LCL = 34.302 and UCL = 34.698
D)LCL = 32.638 and UCL = 36.362
-chart with = 34.5, = 7,and sample size of 12.A)LCL = 32.505 and UCL = 36.495
B)LCL = -49.5 and UCL = 118.5
C)LCL = 34.302 and UCL = 34.698
D)LCL = 32.638 and UCL = 36.362
Question
Question
Find the control limits for the R-chart with  = 27 and sample size of 12.
A)LCL = 0.283 and UCL = 1.717
B)LCL = 7.641 and UCL = 46.359
C)LCL = 6.912 and UCL = 47.088
D)LCL = 3.396 and UCL = 20.604
= 27 and sample size of 12.A)LCL = 0.283 and UCL = 1.717
B)LCL = 7.641 and UCL = 46.359
C)LCL = 6.912 and UCL = 47.088
D)LCL = 3.396 and UCL = 20.604
Question
Find the control limits for the  -chart with
  = 0.08,
  = 0.01,and sample size of 10.
A)The R is too small to determine control limits.
B)LCL = 0.077 and UCL = 0.083
C)LCL = 0.769 and UCL = 0.831
D)LCL = 0.797 and UCL = 0.803
-chart with = 0.08, = 0.01,and sample size of 10.A)The R is too small to determine control limits.
B)LCL = 0.077 and UCL = 0.083
C)LCL = 0.769 and UCL = 0.831
D)LCL = 0.797 and UCL = 0.803
Question
Question
Question
Find the control limits for the  -chart with
  = 239,
  = 17,and sample size of 9.
A)LCL = 233.27 and UCL = 244.73
B)LCL = 232.66 and UCL = 245.34
C)LCL = 235.87 and UCL = 242.13
D)LCL = 234.302 and UCL = 234.698
-chart with = 239, = 17,and sample size of 9.A)LCL = 233.27 and UCL = 244.73
B)LCL = 232.66 and UCL = 245.34
C)LCL = 235.87 and UCL = 242.13
D)LCL = 234.302 and UCL = 234.698
Question
Question
Question
Find the control limits for a p-chart with  = 0.54 found from thirty-five samples each of size 250.
A)LCL = 0.57 and UCL = 0.51
B)LCL = 0.45 and UCL = 0.63
C)LCL = 0.48 and UCL = 0.60
D)LCL = 0 and UCL = 0.03
= 0.54 found from thirty-five samples each of size 250.A)LCL = 0.57 and UCL = 0.51
B)LCL = 0.45 and UCL = 0.63
C)LCL = 0.48 and UCL = 0.60
D)LCL = 0 and UCL = 0.03
Question
Question
Question
Question
Question
Find the control limits for a p-chart with  = 0.75 and s = 0.06.
A)LCL = 0.39 and UCL = 0.75
B)LCL = 0.69 and UCL = 0.81
C)LCL = 0.57 and UCL = 0.93
D)LCL = 0 and UCL = 0.06
= 0.75 and s = 0.06.A)LCL = 0.39 and UCL = 0.75
B)LCL = 0.69 and UCL = 0.81
C)LCL = 0.57 and UCL = 0.93
D)LCL = 0 and UCL = 0.06
Question
Question
The control limits for p-charts are found using ________.
A) ± s
± s
B) ± 3s
± 3s
C) ± 3p
± 3p
D) ± 3x
± 3x
A)
± sB)
± 3sC)
± 3pD)
± 3x Question
Question
Question
Question
The formula for finding the standard deviation for a p-chart using a variable sample size is ________.
A)s =
B)s =
C)s =
D)s =
A)s =
B)s =
C)s =
D)s =
Question
Question
The most common control chart for attributes (qualitative data)is the ________.
A) -chart
B)PHStat chart
C)p-chart
D) -chart
A)
-chartB)PHStat chart
C)p-chart
D)
-chart Question
Question
Question
Find the control limits for the R-chart with  = 0.005 and sample size of 11.
A)The R is too small to determine control limits.
B)LCL = 0.0011 and UCL = 0.0089
C)LCL = 0.0056 and UCL = 0.044
D)LCL = 0.0013 and UCL = 0.0087
= 0.005 and sample size of 11.A)The R is too small to determine control limits.
B)LCL = 0.0011 and UCL = 0.0089
C)LCL = 0.0056 and UCL = 0.044
D)LCL = 0.0013 and UCL = 0.0087
Question
The formula for finding the standard deviation for a p-chart using a constant sample size is ________.
A)s =
B)s =
C)s =
D)s =
A)s =
B)s =
C)s =
D)s =
Question
Find the control limits for the R-chart with  = 0.02 and sample size of 15.
A)LCL = 0.007 and UCL = 0.033
B)LCL = 0.004 and UCL = 0.004
C)LCL = 0.003 and UCL = 0.007
D)The R is too small to determine control limits.
= 0.02 and sample size of 15.A)LCL = 0.007 and UCL = 0.033
B)LCL = 0.004 and UCL = 0.004
C)LCL = 0.003 and UCL = 0.007
D)The R is too small to determine control limits.
Question
Question
Question
Question
Question
Question
Question
Find the control limits for a p-chart with  = 0.022 obtained from fifty samples each of size 150.
A)LCL = -0.01 and UCL = 0.06
B)LCL = 0.19 and UCL = 0.25
C)LCL = -0.07 and UCL = 0.37
D)LCL = 0 and UCL = 0.06
= 0.022 obtained from fifty samples each of size 150.A)LCL = -0.01 and UCL = 0.06
B)LCL = 0.19 and UCL = 0.25
C)LCL = -0.07 and UCL = 0.37
D)LCL = 0 and UCL = 0.06
Question
Question
Question
Question
The process capability index is calculated by ________.
A)
B)
C)
D)
A)
B)
C)
D)
Question
Question
Find the control limits for a p-chart with  = 0.36 found from ten samples of size 126,forty-two samples of size 124,and thirteen samples of size 135.
A)LCL = 0.232 and UCL = 0.488
B)LCL = 0.091 and UCL = 0.093
C)LCL = 0.390 and UCL = 0.494
D)LCL = 0 and UCL = 0.488
= 0.36 found from ten samples of size 126,forty-two samples of size 124,and thirteen samples of size 135.A)LCL = 0.232 and UCL = 0.488
B)LCL = 0.091 and UCL = 0.093
C)LCL = 0.390 and UCL = 0.494
D)LCL = 0 and UCL = 0.488
Question
Question
Question
Question
Question
Question
Question
Find the control limits for a p-chart using the below information: 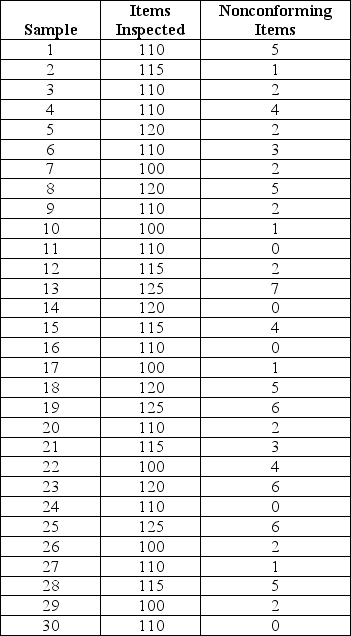
A)LCL = 0.019 and UCL = 0.069
B)LCL = 0 and UCL = 0.016
C)LCL = 0.004 and UCL = 0.20
D)LCL = 0 and UCL = 0.069
A)LCL = 0.019 and UCL = 0.069
B)LCL = 0 and UCL = 0.016
C)LCL = 0.004 and UCL = 0.20
D)LCL = 0 and UCL = 0.069
Question

Unlock Deck
Sign up to unlock the cards in this deck!
Unlock Deck
Unlock Deck
1/101
Play
Full screen (f)
Deck 8: Introduction to Statistical Quality Control
1
Control charts were first used by Dr.Walter Shewhart at Bell Laboratories to make a distinction between ________.
A)process attributes and process variables
B)a process in control and one that is stable
C)common causes of variation and special causes of variation
D)machined parts and die cut parts
A)process attributes and process variables
B)a process in control and one that is stable
C)common causes of variation and special causes of variation
D)machined parts and die cut parts
common causes of variation and special causes of variation
2
Statistical process control (SPC)provides a means of identifying ________.
A)common causes of variation
B)the process variables
C)the process attributes
D)special causes as well as telling us when the process is in control and should be left alone.
A)common causes of variation
B)the process variables
C)the process attributes
D)special causes as well as telling us when the process is in control and should be left alone.
special causes as well as telling us when the process is in control and should be left alone.
3
A process is considered to be under control when ________.
A)only special causes of variation are present
B)only process attributes are present
C)only process variables are present
D)only common causes of variation are present
A)only special causes of variation are present
B)only process attributes are present
C)only process variables are present
D)only common causes of variation are present
only common causes of variation are present
4
A process is considered to be under control when all of the following are true except ________.
A)only special causes of variation are present
B)variation in the distribution of output is due to common causes
C)only common causes of variation are present
D)the process output is stable and predictable
A)only special causes of variation are present
B)variation in the distribution of output is due to common causes
C)only common causes of variation are present
D)the process output is stable and predictable
Unlock Deck
Unlock for access to all 101 flashcards in this deck.
Unlock Deck
k this deck
5
Which of the following are two important tools in helping to achieve process quality?
A)standard normal distribution and histogram
B)common causes of variation and special causes of variation
C)statistical process control and process capability analysis
D)confidence interval for the mean and discrete probability distribution
A)standard normal distribution and histogram
B)common causes of variation and special causes of variation
C)statistical process control and process capability analysis
D)confidence interval for the mean and discrete probability distribution
Unlock Deck
Unlock for access to all 101 flashcards in this deck.
Unlock Deck
k this deck
6
Which of the following is an example of quality control attributes?
A)the weight of a carton of cereal
B)number of defective pieces in a shipment of parts
C)inside diameter of drilled hole
D)the time between an order and its delivery
A)the weight of a carton of cereal
B)number of defective pieces in a shipment of parts
C)inside diameter of drilled hole
D)the time between an order and its delivery
Unlock Deck
Unlock for access to all 101 flashcards in this deck.
Unlock Deck
k this deck
7
All of the following are historical facts about process quality control except ________.
A)replaced by computer animation in the 2010s
B)pioneered by Western Electric Company in the 1920s
C)mainstay of Japanese manufacturing in the 1950s
D)began to be widely used in the United States in the 1980s
A)replaced by computer animation in the 2010s
B)pioneered by Western Electric Company in the 1920s
C)mainstay of Japanese manufacturing in the 1950s
D)began to be widely used in the United States in the 1980s
Unlock Deck
Unlock for access to all 101 flashcards in this deck.
Unlock Deck
k this deck
8
Control limits are chosen statistically so that there is a high probability that sample statistics will fall randomly between ________.
A)the lower control limit and the upper control limit if the process is out of control
B)the lower process specification limit and higher process specification limit if the process is in control
C)the lower control limit and the upper control limit if the process is in control
D)the lower process specification limit and higher process specification limit if the process is out of control
Unlock Deck
Unlock for access to all 101 flashcards in this deck.
Unlock Deck
k this deck
9
The common causes of variation are the ________.
A)variations in the measurement systems of a process alone
B)variations resulted from many small differences in the factors of a process,taken together
C)variations that can be explained
D)variations caused by any one of the factors of a process
A)variations in the measurement systems of a process alone
B)variations resulted from many small differences in the factors of a process,taken together
C)variations that can be explained
D)variations caused by any one of the factors of a process
Unlock Deck
Unlock for access to all 101 flashcards in this deck.
Unlock Deck
k this deck
10
A run chart is a line chart in which ________.
A)the dependent variable is time and the independent variable is the value of some sample statistic
B)the independent variable is time and the dependent variable is the value of some sample statistic
C)the independent and the dependent variables are the same
D)the independent variable is the overall production costs and the dependent variable is time
Unlock Deck
Unlock for access to all 101 flashcards in this deck.
Unlock Deck
k this deck
11
A process is considered out of control when ________.
A)special causes of variation are present
B)common causes of variation are present
C)process attributes are present
D)process variables are present
A)special causes of variation are present
B)common causes of variation are present
C)process attributes are present
D)process variables are present
Unlock Deck
Unlock for access to all 101 flashcards in this deck.
Unlock Deck
k this deck
12
For a process that is in control,a quantitative sample statistic will run randomly between ________.
A)μ ± 3σ
B) ±
C)μ ± σ
D) ± sx
A)μ ± 3σ
B)
± C)μ ± σ
D)
± sx Unlock Deck
Unlock for access to all 101 flashcards in this deck.
Unlock Deck
k this deck
13
When data is collected for statistical quality control purposes,it is important to record the data,the time the data were collected,the measuring instruments that were used,who collected the data,and any other important information such as lot numbers,machine numbers and the like because ________.
A)it is required by the Federal Trade Commission
B)this type of data can be used to justify our job
C)this will ensure the process is in statistical control
D)the source of quality problems can be traced more easily
A)it is required by the Federal Trade Commission
B)this type of data can be used to justify our job
C)this will ensure the process is in statistical control
D)the source of quality problems can be traced more easily
Unlock Deck
Unlock for access to all 101 flashcards in this deck.
Unlock Deck
k this deck
14
A control chart is a run chart that has two additional horizontal lines called ________.
A)production specifications
B)legal limits
C)control limits
D)process statistics
A)production specifications
B)legal limits
C)control limits
D)process statistics
Unlock Deck
Unlock for access to all 101 flashcards in this deck.
Unlock Deck
k this deck
15
Quality control measures that come from counting are called ________.
A)variables
B)attributes
C)statistics
D)processes
A)variables
B)attributes
C)statistics
D)processes
Unlock Deck
Unlock for access to all 101 flashcards in this deck.
Unlock Deck
k this deck
16
The special causes of variation ________.
A)cannot be identified
B)cannot be eliminated
C)cannot be explained
D)can be identified and either eliminated or at least explained
A)cannot be identified
B)cannot be eliminated
C)cannot be explained
D)can be identified and either eliminated or at least explained
Unlock Deck
Unlock for access to all 101 flashcards in this deck.
Unlock Deck
k this deck
17
Which of the following is an example of quality control variables?
A)percent of customers rating a service a 5 on a ten-point scale
B)number of defective pieces in a shipment of parts
C)the time between an order and its delivery
D)the number of errors on an invoice
A)percent of customers rating a service a 5 on a ten-point scale
B)number of defective pieces in a shipment of parts
C)the time between an order and its delivery
D)the number of errors on an invoice
Unlock Deck
Unlock for access to all 101 flashcards in this deck.
Unlock Deck
k this deck
18
We would expect ________ percent of sample means will lay within ± 3 standard errors of the mean when the process is in control.
A)68.3
B)95.4
C)99.7
D)100
A)68.3
B)95.4
C)99.7
D)100
Unlock Deck
Unlock for access to all 101 flashcards in this deck.
Unlock Deck
k this deck
19
Quality control measures that are based on a continuous measurement system are called ________.
A)processes
B)attributes
C)variables
D)statistics
A)processes
B)attributes
C)variables
D)statistics
Unlock Deck
Unlock for access to all 101 flashcards in this deck.
Unlock Deck
k this deck
20
Quality control methods help employees do all of the following except ________.
A)manage product performance to achieve design tolerances
B)learn everything possible about a production process
C)ensure that customers receive error-free,consistent service
D)monitor production operations to ensure output conforms to specifications
A)manage product performance to achieve design tolerances
B)learn everything possible about a production process
C)ensure that customers receive error-free,consistent service
D)monitor production operations to ensure output conforms to specifications
Unlock Deck
Unlock for access to all 101 flashcards in this deck.
Unlock Deck
k this deck
21
Find the control limits for the R-chart with = 7 and sample size of 7.
A)LCL = 2.622 and UCL = 66.378
B)LCL = 0 and UCL = 14.028
C)LCL = 0.532 and UCL = 13.468
D)LCL = 27.5 and UCL = 41.5
= 7 and sample size of 7.A)LCL = 2.622 and UCL = 66.378
B)LCL = 0 and UCL = 14.028
C)LCL = 0.532 and UCL = 13.468
D)LCL = 27.5 and UCL = 41.5
Unlock Deck
Unlock for access to all 101 flashcards in this deck.
Unlock Deck
k this deck
22
Find the control limits for the -chart with = 4.96, = 0.0285,and sample size of 5.
A)LCL = 4.939 and UCL = 4.981
B)LCL = 4.944 and UCL = 4.976
C)LCL = 4.796 and UCL = 5.124
D)The sample size is too small to determine control limits.
-chart with = 4.96, = 0.0285,and sample size of 5.A)LCL = 4.939 and UCL = 4.981
B)LCL = 4.944 and UCL = 4.976
C)LCL = 4.796 and UCL = 5.124
D)The sample size is too small to determine control limits.
Unlock Deck
Unlock for access to all 101 flashcards in this deck.
Unlock Deck
k this deck
23
Find the control limits for the -chart with = 0.45, = 0.02,and sample size of 15.
A)The R is too small to determine control limits.
B)LCL = 0.445 and UCL = 0.455
C)LCL = 0.446 and UCL = 0.454
D)LCL = 0.443 and UCL = 0.457
-chart with = 0.45, = 0.02,and sample size of 15.A)The R is too small to determine control limits.
B)LCL = 0.445 and UCL = 0.455
C)LCL = 0.446 and UCL = 0.454
D)LCL = 0.443 and UCL = 0.457
Unlock Deck
Unlock for access to all 101 flashcards in this deck.
Unlock Deck
k this deck
24
Permissible variation in a process variable as defined by a nominal specification and tolerance will fall between ________.
A)the lower control limit and the upper control limit
B)the worst process output and the best process output
C)the common causes of variation and the special causes of variation
D)the lower specification limit and the upper specification limit
A)the lower control limit and the upper control limit
B)the worst process output and the best process output
C)the common causes of variation and the special causes of variation
D)the lower specification limit and the upper specification limit
Unlock Deck
Unlock for access to all 101 flashcards in this deck.
Unlock Deck
k this deck
25
The -chart is used to monitor the ________ for variables data over time.
A)centering of the process output
B)range of the process output
C)strength of the process output
D)variability of the process output
-chart is used to monitor the ________ for variables data over time.A)centering of the process output
B)range of the process output
C)strength of the process output
D)variability of the process output
Unlock Deck
Unlock for access to all 101 flashcards in this deck.
Unlock Deck
k this deck
26
The -chart monitors the centering of process output for variables data over time by plotting the ________.
A)range of each sample
B)standard deviation of each sample
C)sum of each sample
D)mean of each sample
-chart monitors the centering of process output for variables data over time by plotting the ________.A)range of each sample
B)standard deviation of each sample
C)sum of each sample
D)mean of each sample
Unlock Deck
Unlock for access to all 101 flashcards in this deck.
Unlock Deck
k this deck
27
The R-chart monitors the variability in the data over time by plotting the ________.
A)mean of each sample
B)range of each sample
C)sum of each sample
D)size of each sample
A)mean of each sample
B)range of each sample
C)sum of each sample
D)size of each sample
Unlock Deck
Unlock for access to all 101 flashcards in this deck.
Unlock Deck
k this deck
28
Control limits are based on ________.
A)past process performance
B)legal requirements
C)product specifications
D)ethical standards
A)past process performance
B)legal requirements
C)product specifications
D)ethical standards
Unlock Deck
Unlock for access to all 101 flashcards in this deck.
Unlock Deck
k this deck
29
Find the control limits for the R-chart with = 0.0285 and sample size of 5.
A)LCL = 0 and UCL = 0.065
B)LCL = 0 and UCL = 0.060
C)LCL = 0.021 and UCL = 0.065
D)The sample size is too small to determine control limits.
= 0.0285 and sample size of 5.A)LCL = 0 and UCL = 0.065
B)LCL = 0 and UCL = 0.060
C)LCL = 0.021 and UCL = 0.065
D)The sample size is too small to determine control limits.
Unlock Deck
Unlock for access to all 101 flashcards in this deck.
Unlock Deck
k this deck
30
A table of values can be used to help calculate R-chart control limits because the constants have been determined from the sampling distribution of R so that ________.
A)D4 = - 3sR and D3
= + 3sR
B)D4 = + 3sR and D3
= - 3sR
C)D4 = - sR and D3
= + sR
D)D = ± A2R.
A)D4
= - 3sR and D3 = + 3sRB)D4
= + 3sR and D3 = - 3sRC)D4
= - sR and D3 = + sRD)D
= ± A2R. Unlock Deck
Unlock for access to all 101 flashcards in this deck.
Unlock Deck
k this deck
31
The control limits for the -chart are found by using ________.
A) ± 3R
B) ± A
C) ± R
D) ± 3sx
-chart are found by using ________.A)
± 3RB)
± A C)
± RD)
± 3sx Unlock Deck
Unlock for access to all 101 flashcards in this deck.
Unlock Deck
k this deck
32
Find the control limits for the -chart with = 34.5, = 7,and sample size of 12.
A)LCL = 32.505 and UCL = 36.495
B)LCL = -49.5 and UCL = 118.5
C)LCL = 34.302 and UCL = 34.698
D)LCL = 32.638 and UCL = 36.362
-chart with = 34.5, = 7,and sample size of 12.A)LCL = 32.505 and UCL = 36.495
B)LCL = -49.5 and UCL = 118.5
C)LCL = 34.302 and UCL = 34.698
D)LCL = 32.638 and UCL = 36.362
Unlock Deck
Unlock for access to all 101 flashcards in this deck.
Unlock Deck
k this deck
33
To construct and use any control chart,first ________.
A)gather one sample data from a production process
B)gather all the data from a production process
C)gather at least 25 to 30 samples of data of a fixed sample size n from a production process
D)gather exactly 50% of the data from a production process
A)gather one sample data from a production process
B)gather all the data from a production process
C)gather at least 25 to 30 samples of data of a fixed sample size n from a production process
D)gather exactly 50% of the data from a production process
Unlock Deck
Unlock for access to all 101 flashcards in this deck.
Unlock Deck
k this deck
34
Find the control limits for the R-chart with = 27 and sample size of 12.
A)LCL = 0.283 and UCL = 1.717
B)LCL = 7.641 and UCL = 46.359
C)LCL = 6.912 and UCL = 47.088
D)LCL = 3.396 and UCL = 20.604
= 27 and sample size of 12.A)LCL = 0.283 and UCL = 1.717
B)LCL = 7.641 and UCL = 46.359
C)LCL = 6.912 and UCL = 47.088
D)LCL = 3.396 and UCL = 20.604
Unlock Deck
Unlock for access to all 101 flashcards in this deck.
Unlock Deck
k this deck
35
Find the control limits for the -chart with = 0.08, = 0.01,and sample size of 10.
A)The R is too small to determine control limits.
B)LCL = 0.077 and UCL = 0.083
C)LCL = 0.769 and UCL = 0.831
D)LCL = 0.797 and UCL = 0.803
-chart with = 0.08, = 0.01,and sample size of 10.A)The R is too small to determine control limits.
B)LCL = 0.077 and UCL = 0.083
C)LCL = 0.769 and UCL = 0.831
D)LCL = 0.797 and UCL = 0.803
Unlock Deck
Unlock for access to all 101 flashcards in this deck.
Unlock Deck
k this deck
36
R-charts are ________ if the calculations are done manually by a process worker on the factory floor.
A)more accurate than charts based on the standard deviation
B)more useful than x-charts
C)the only way to determine if a process is under control
D)easy to construct and use
A)more accurate than charts based on the standard deviation
B)more useful than x-charts
C)the only way to determine if a process is under control
D)easy to construct and use
Unlock Deck
Unlock for access to all 101 flashcards in this deck.
Unlock Deck
k this deck
37
The R-chart monitors the ________.
A)manageability of the process
B)strength of the process
C)centering of the process
D)uniformity of the process
A)manageability of the process
B)strength of the process
C)centering of the process
D)uniformity of the process
Unlock Deck
Unlock for access to all 101 flashcards in this deck.
Unlock Deck
k this deck
38
Find the control limits for the -chart with = 239, = 17,and sample size of 9.
A)LCL = 233.27 and UCL = 244.73
B)LCL = 232.66 and UCL = 245.34
C)LCL = 235.87 and UCL = 242.13
D)LCL = 234.302 and UCL = 234.698
-chart with = 239, = 17,and sample size of 9.A)LCL = 233.27 and UCL = 244.73
B)LCL = 232.66 and UCL = 245.34
C)LCL = 235.87 and UCL = 242.13
D)LCL = 234.302 and UCL = 234.698
Unlock Deck
Unlock for access to all 101 flashcards in this deck.
Unlock Deck
k this deck
39
The nominal specification is the ________.
A)expected value
B)target value
C)minimum value
D)maximum value
A)expected value
B)target value
C)minimum value
D)maximum value
Unlock Deck
Unlock for access to all 101 flashcards in this deck.
Unlock Deck
k this deck
40
The more uniform or consistent a process is performing will be seen by ________.
A)a larger value for the range
B)a predictable value for the range
C)a smaller value for the range
D)an infinite value for the range
A)a larger value for the range
B)a predictable value for the range
C)a smaller value for the range
D)an infinite value for the range
Unlock Deck
Unlock for access to all 101 flashcards in this deck.
Unlock Deck
k this deck
41
Find the control limits for a p-chart with = 0.54 found from thirty-five samples each of size 250.
A)LCL = 0.57 and UCL = 0.51
B)LCL = 0.45 and UCL = 0.63
C)LCL = 0.48 and UCL = 0.60
D)LCL = 0 and UCL = 0.03
= 0.54 found from thirty-five samples each of size 250.A)LCL = 0.57 and UCL = 0.51
B)LCL = 0.45 and UCL = 0.63
C)LCL = 0.48 and UCL = 0.60
D)LCL = 0 and UCL = 0.03
Unlock Deck
Unlock for access to all 101 flashcards in this deck.
Unlock Deck
k this deck
42
For constructing a p-chart,it is recommended that ________.
A)a minimum of 100 samples be taken,each with a minimum sample size of 25
B)a minimum of 10 samples be taken,each with a minimum sample size of 30
C)a minimum of 1776 samples be taken,each with a minimum sample size of 74
D)a minimum of 25 samples be taken,each with a minimum sample size of 100
A)a minimum of 100 samples be taken,each with a minimum sample size of 25
B)a minimum of 10 samples be taken,each with a minimum sample size of 30
C)a minimum of 1776 samples be taken,each with a minimum sample size of 74
D)a minimum of 25 samples be taken,each with a minimum sample size of 100
Unlock Deck
Unlock for access to all 101 flashcards in this deck.
Unlock Deck
k this deck
43
What is the standard deviation if a proportion of 0.44 is found from twenty samples of size 116,twenty samples of size 114,and three samples of size 112?
A)0.130
B)0.164
C)0.103
D)0.046
A)0.130
B)0.164
C)0.103
D)0.046
Unlock Deck
Unlock for access to all 101 flashcards in this deck.
Unlock Deck
k this deck
44
What is the standard deviation if the proportion of nonconforming is obtained to be 0.19 from 100 samples of size 136?
A)0.065
B)0.034
C)0.066
D)0.001
A)0.065
B)0.034
C)0.066
D)0.001
Unlock Deck
Unlock for access to all 101 flashcards in this deck.
Unlock Deck
k this deck
45
What is the standard deviation if a proportion of 0.094 is found from 25 samples each of size 200?
A)0.0637
B)0.0653
C)0.0004
D)0.0206
A)0.0637
B)0.0653
C)0.0004
D)0.0206
Unlock Deck
Unlock for access to all 101 flashcards in this deck.
Unlock Deck
k this deck
46
Find the control limits for a p-chart with = 0.75 and s = 0.06.
A)LCL = 0.39 and UCL = 0.75
B)LCL = 0.69 and UCL = 0.81
C)LCL = 0.57 and UCL = 0.93
D)LCL = 0 and UCL = 0.06
= 0.75 and s = 0.06.A)LCL = 0.39 and UCL = 0.75
B)LCL = 0.69 and UCL = 0.81
C)LCL = 0.57 and UCL = 0.93
D)LCL = 0 and UCL = 0.06
Unlock Deck
Unlock for access to all 101 flashcards in this deck.
Unlock Deck
k this deck
47
What is the standard deviation if a proportion of 0.44 of nonconforming items is found from 30 samples of fixed size 110?
A)0.150
B)0.002
C)0.157
D)0.047
A)0.150
B)0.002
C)0.157
D)0.047
Unlock Deck
Unlock for access to all 101 flashcards in this deck.
Unlock Deck
k this deck
48
The control limits for p-charts are found using ________.
A) ± s
B) ± 3s
C) ± 3p
D) ± 3x
A)
± sB)
± 3sC)
± 3pD)
± 3x Unlock Deck
Unlock for access to all 101 flashcards in this deck.
Unlock Deck
k this deck
49
Whenever the calculated LCL for a p-chart is negative,use ________.
A)that value for the LCL because being negative is not a problem
B)the UCL - 1 instead
C)zero since the fraction nonconforming can never be negative
D)zero because a negative LCL is too confusing to use
A)that value for the LCL because being negative is not a problem
B)the UCL - 1 instead
C)zero since the fraction nonconforming can never be negative
D)zero because a negative LCL is too confusing to use
Unlock Deck
Unlock for access to all 101 flashcards in this deck.
Unlock Deck
k this deck
50
Which of the following is an example of common types of out-of-control conditions?
A)attributes
B)variables
C)presence of variation in measurement systems
D)cycles
A)attributes
B)variables
C)presence of variation in measurement systems
D)cycles
Unlock Deck
Unlock for access to all 101 flashcards in this deck.
Unlock Deck
k this deck
51
A p-chart is used to monitor ________.
A)the standard deviation for nonconforming items
B)the proportion of nonconforming items
C)the number of nonconforming items
D)the product specifications
A)the standard deviation for nonconforming items
B)the proportion of nonconforming items
C)the number of nonconforming items
D)the product specifications
Unlock Deck
Unlock for access to all 101 flashcards in this deck.
Unlock Deck
k this deck
52
The formula for finding the standard deviation for a p-chart using a variable sample size is ________.
A)s =
B)s =
C)s =
D)s =
A)s =
B)s =
C)s =
D)s =
Unlock Deck
Unlock for access to all 101 flashcards in this deck.
Unlock Deck
k this deck
53
What is the standard deviation if the average fraction nonconforming of 0.83 is found from samples of constant size 100?
A)0.038
B)0.069
C)0.050
D)0.049
A)0.038
B)0.069
C)0.050
D)0.049
Unlock Deck
Unlock for access to all 101 flashcards in this deck.
Unlock Deck
k this deck
54
The most common control chart for attributes (qualitative data)is the ________.
A) -chart
B)PHStat chart
C)p-chart
D) -chart
A)
-chartB)PHStat chart
C)p-chart
D)
-chart Unlock Deck
Unlock for access to all 101 flashcards in this deck.
Unlock Deck
k this deck
55
What is the standard deviation if the proportion is 0.18 found from ten samples each of size 100,twelve samples each of size 128,fifteen samples each of size 120,and eight samples each of size 125?
A)0.077
B)0.068
C)0.035
D)0.059
A)0.077
B)0.068
C)0.035
D)0.059
Unlock Deck
Unlock for access to all 101 flashcards in this deck.
Unlock Deck
k this deck
56
The number of nonconforming items in each sample follows ________.
A)a normal distribution
B)a Poisson distribution
C)a binomial distribution
D)no distribution
A)a normal distribution
B)a Poisson distribution
C)a binomial distribution
D)no distribution
Unlock Deck
Unlock for access to all 101 flashcards in this deck.
Unlock Deck
k this deck
57
Find the control limits for the R-chart with = 0.005 and sample size of 11.
A)The R is too small to determine control limits.
B)LCL = 0.0011 and UCL = 0.0089
C)LCL = 0.0056 and UCL = 0.044
D)LCL = 0.0013 and UCL = 0.0087
= 0.005 and sample size of 11.A)The R is too small to determine control limits.
B)LCL = 0.0011 and UCL = 0.0089
C)LCL = 0.0056 and UCL = 0.044
D)LCL = 0.0013 and UCL = 0.0087
Unlock Deck
Unlock for access to all 101 flashcards in this deck.
Unlock Deck
k this deck
58
The formula for finding the standard deviation for a p-chart using a constant sample size is ________.
A)s =
B)s =
C)s =
D)s =
A)s =
B)s =
C)s =
D)s =
Unlock Deck
Unlock for access to all 101 flashcards in this deck.
Unlock Deck
k this deck
59
Find the control limits for the R-chart with = 0.02 and sample size of 15.
A)LCL = 0.007 and UCL = 0.033
B)LCL = 0.004 and UCL = 0.004
C)LCL = 0.003 and UCL = 0.007
D)The R is too small to determine control limits.
= 0.02 and sample size of 15.A)LCL = 0.007 and UCL = 0.033
B)LCL = 0.004 and UCL = 0.004
C)LCL = 0.003 and UCL = 0.007
D)The R is too small to determine control limits.
Unlock Deck
Unlock for access to all 101 flashcards in this deck.
Unlock Deck
k this deck
60
What is the standard deviation if a proportion of 0.89 of nonconforming items is found from twelve samples of size 136,twelve samples of size 124,and thirty samples of size 131?
A)0.027
B)0.001
C)0.566
D)0.305
A)0.027
B)0.001
C)0.566
D)0.305
Unlock Deck
Unlock for access to all 101 flashcards in this deck.
Unlock Deck
k this deck
61
A run chart is simply a control chart with two additional horizontal lines.
Unlock Deck
Unlock for access to all 101 flashcards in this deck.
Unlock Deck
k this deck
62
Statistical quality control is necessary because no two outputs from any production process are exactly alike.
Unlock Deck
Unlock for access to all 101 flashcards in this deck.
Unlock Deck
k this deck
63
The travel tube of Biker Smellum Good has a lower specification weight of 0.5 ounces and an upper specification limit of 0.52 ounces.The standard deviation is 0.01 ounces.What is the process capability index if the process appears to be in statistical control?
A)0.0003
B)0.3333
C)1.00
D)2.00
A)0.0003
B)0.3333
C)1.00
D)2.00
Unlock Deck
Unlock for access to all 101 flashcards in this deck.
Unlock Deck
k this deck
64
Control limits are chosen statistically so that there is a high probability that sample statistics will fall randomly between the lower control limit and the upper control limit if the process is in control.
Unlock Deck
Unlock for access to all 101 flashcards in this deck.
Unlock Deck
k this deck
65
For Super Soil,the lower specification fill weight is 35.0 pounds and the upper specification fill weight is 35.5 pounds.The filling process has a standard deviation of 0.4 pounds and the process is in control.Find the process capability index.
A)0.208
B)1.25
C)88.75
D)0.1
A)0.208
B)1.25
C)88.75
D)0.1
Unlock Deck
Unlock for access to all 101 flashcards in this deck.
Unlock Deck
k this deck
66
Find the control limits for a p-chart with = 0.022 obtained from fifty samples each of size 150.
A)LCL = -0.01 and UCL = 0.06
B)LCL = 0.19 and UCL = 0.25
C)LCL = -0.07 and UCL = 0.37
D)LCL = 0 and UCL = 0.06
= 0.022 obtained from fifty samples each of size 150.A)LCL = -0.01 and UCL = 0.06
B)LCL = 0.19 and UCL = 0.25
C)LCL = -0.07 and UCL = 0.37
D)LCL = 0 and UCL = 0.06
Unlock Deck
Unlock for access to all 101 flashcards in this deck.
Unlock Deck
k this deck
67
Process capability analysis should be used only after ________.
A)control charts indicate that all special causes have been eliminated
B)control charts show that the process is out of control
C)common and special causes are known
D)a plan for getting the process under statistical control has been agreed upon
A)control charts indicate that all special causes have been eliminated
B)control charts show that the process is out of control
C)common and special causes are known
D)a plan for getting the process under statistical control has been agreed upon
Unlock Deck
Unlock for access to all 101 flashcards in this deck.
Unlock Deck
k this deck
68
All of the following are possible process capability situations except ________.
A)the natural variation in the output is smaller than the design tolerance
B)the natural variation and the design specifications are about the same size
C)the natural variation,the unnatural variation,and the design specifications are nearly the same
D)the range of process variation is larger than the design specifications
Unlock Deck
Unlock for access to all 101 flashcards in this deck.
Unlock Deck
k this deck
69
Process capability analysis involves ________.
A)comparing the distribution of process output to specifications when only common and special causes are known to determine the variation
B)comparing the distribution of process output to specifications when only special causes determine the variation
C)comparing the distribution of process output to specifications when only common causes determine the variation
D)collecting data to prove a process is under statistical control
Unlock Deck
Unlock for access to all 101 flashcards in this deck.
Unlock Deck
k this deck
70
The process capability index is calculated by ________.
A)
B)
C)
D)
A)
B)
C)
D)
Unlock Deck
Unlock for access to all 101 flashcards in this deck.
Unlock Deck
k this deck
71
The relationship between the process capability and the design specifications is measured by the ________.
A)process control index
B)process control monitor
C)process capability chart
D)process capability index
A)process control index
B)process control monitor
C)process capability chart
D)process capability index
Unlock Deck
Unlock for access to all 101 flashcards in this deck.
Unlock Deck
k this deck
72
Find the control limits for a p-chart with = 0.36 found from ten samples of size 126,forty-two samples of size 124,and thirteen samples of size 135.
A)LCL = 0.232 and UCL = 0.488
B)LCL = 0.091 and UCL = 0.093
C)LCL = 0.390 and UCL = 0.494
D)LCL = 0 and UCL = 0.488
= 0.36 found from ten samples of size 126,forty-two samples of size 124,and thirteen samples of size 135.A)LCL = 0.232 and UCL = 0.488
B)LCL = 0.091 and UCL = 0.093
C)LCL = 0.390 and UCL = 0.494
D)LCL = 0 and UCL = 0.488
Unlock Deck
Unlock for access to all 101 flashcards in this deck.
Unlock Deck
k this deck
73
The lower specification for ChocoChips candy kiddie bag is 12 candies while the upper specification limit is 15 candies.The standard deviation is 2 candies.If the process is in control,what is the process capability index?
A)1.47
B)8.82
C)0.25
D)1.5
A)1.47
B)8.82
C)0.25
D)1.5
Unlock Deck
Unlock for access to all 101 flashcards in this deck.
Unlock Deck
k this deck
74
For Typhoon Shampoo,the lower specification fill weight is 15.0 ounces and the upper specification fill weight is 15.2 ounces.The filling process has a standard deviation of 0.04 ounces and the process appears to be in control.Find the process capability index.
A)1.6667
B)0.8333
C)0.0013
D)5.00
A)1.6667
B)0.8333
C)0.0013
D)5.00
Unlock Deck
Unlock for access to all 101 flashcards in this deck.
Unlock Deck
k this deck
75
In manufacturing,the tolerance is the target value while the nominal specification is the permissible range around the tolerance.
Unlock Deck
Unlock for access to all 101 flashcards in this deck.
Unlock Deck
k this deck
76
The distinction between quality control attributes and variables is not an important one because the same statistical process control tools are used for both.
Unlock Deck
Unlock for access to all 101 flashcards in this deck.
Unlock Deck
k this deck
77
The canister of No Way Bug Spray has a lower specification weight of 3.5 fluid ounces and an upper specification limit of 3.6 fluid ounces.The process filling standard deviation is 0.1 fluid ounces.The process is found to be in control using the control charts.What is the process capability index?
A)0.50
B)1.00
C)2.00
D)0.167
A)0.50
B)1.00
C)2.00
D)0.167
Unlock Deck
Unlock for access to all 101 flashcards in this deck.
Unlock Deck
k this deck
78
All of the following are important elements of process capability except ________.
A)the design specifications
B)the centering of the process
C)the range of variation
D)the control limits
A)the design specifications
B)the centering of the process
C)the range of variation
D)the control limits
Unlock Deck
Unlock for access to all 101 flashcards in this deck.
Unlock Deck
k this deck
79
Find the control limits for a p-chart using the below information:
A)LCL = 0.019 and UCL = 0.069
B)LCL = 0 and UCL = 0.016
C)LCL = 0.004 and UCL = 0.20
D)LCL = 0 and UCL = 0.069
A)LCL = 0.019 and UCL = 0.069
B)LCL = 0 and UCL = 0.016
C)LCL = 0.004 and UCL = 0.20
D)LCL = 0 and UCL = 0.069
Unlock Deck
Unlock for access to all 101 flashcards in this deck.
Unlock Deck
k this deck
80
The sample statistics will fall randomly within the lower and the upper control limits when the process is in statistical control.
Unlock Deck
Unlock for access to all 101 flashcards in this deck.
Unlock Deck
k this deck
Unlock Deck
Unlock for access to all 101 flashcards in this deck.


