
Introduction to Econometrics 3rd Edition by James Stock, James Stock
Edition 3ISBN: 978-9352863501Introduction to Econometrics 3rd Edition by James Stock, James Stock
Edition 3ISBN: 978-9352863501 Exercise 7
These exercises are based on data series in the data files USIVIacro_QuarterIy and USMacro_Monthly described in the Empirical Exercises in Chapters 14 and 15. Let Y i = ln(GDT)), R i denote the 3-month Treasury bill rate, and  and
and  denote the inflation rates from the CPI and Personal Consumption Expenditures (PCE) Deflator, respectively.
a. Using data on Y (the growth rate in GDP) from 1955:1 to 2009:4, estimate an AR(l) model with GARCH(1,1) errors.
b. Plot the residuals from the AR(1) model along with , bands as in Figure 16.4.
c. Some macroeconomists have claimed that there was a sharp drop in the variability of Y around 1983, which they call the "Great Moderation." Is this Great Moderation evident in the plot that you formed in (b)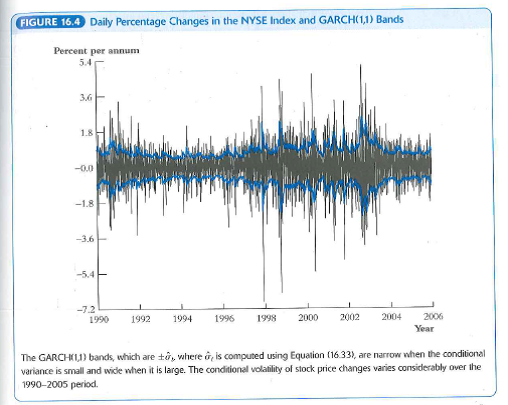
and denote the inflation rates from the CPI and Personal Consumption Expenditures (PCE) Deflator, respectively.a. Using data on Y (the growth rate in GDP) from 1955:1 to 2009:4, estimate an AR(l) model with GARCH(1,1) errors.
b. Plot the residuals from the AR(1) model along with
, bands as in Figure 16.4.c. Some macroeconomists have claimed that there was a sharp drop in the variability of Y around 1983, which they call the "Great Moderation." Is this Great Moderation evident in the plot that you formed in (b)
Explanation

This question doesn’t have an expert verified answer yet, let Quizplus AI Copilot help.
Introduction to Econometrics 3rd Edition by James Stock, James Stock
Why don’t you like this exercise?
Other Minimum 8 character and maximum 255 character
Character 255


