
Introduction to Econometrics 3rd Edition by James Stock, Mark Watson
Edition 3ISBN: 978-9352863501Introduction to Econometrics 3rd Edition by James Stock, Mark Watson
Edition 3ISBN: 978-9352863501 Exercise 1
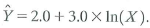
A is a continuous variable that takes on values between 5 and 100. Z is a binary variable. Sketch the following regression functions (with values of X between 5 and 100 on the horizontal axis and values of Y on the vertical axis):
a.
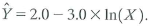
b.
c.
i.
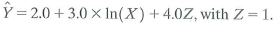
ii. same as (i), but with Z=0.
d.
i.

ii. same as (i), but with Z=0.
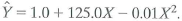
e.
a.
b.
c.
i.
ii. same as (i), but with Z=0.
d.
i.
ii. same as (i), but with Z=0.
e.
Explanation Verified
Consider the provided details and use MS...
Introduction to Econometrics 3rd Edition by James Stock, Mark Watson
Why don’t you like this exercise?
Other Minimum 8 character and maximum 255 character
Character 255


