




 Chat with AI


Microeconomics 19th Edition by Campbell McConnell,Stanley Brue,Sean Flynn
Edition 19ISBN: 978-0070998544Microeconomics 19th Edition by Campbell McConnell,Stanley Brue,Sean Flynn
Edition 19ISBN: 978-0070998544 Exercise 1
Graph and label as either direct or indirect the relationships you would expect to find between ( a ) the number of inches of rainfall per month and the sale of umbrellas, ( b ) the amount of tuition and the level of enrollment at a university, and ( c ) the popularity of an entertainer and the price of her concert tickets.
Explanation Verified
Verified
Graphs are used to represent the relationship between two sets of data. Two variables are positively or directly related when their values change in the same direction. The line representing two directly related variables slopes upward. When two variables are negatively or inversely related, their values change in opposite directions. The line representing two inversely related variables slopes downward.
a) Let us see the relationship between the number of inches of rainfall per month and the sale of umbrellas taking a hypothetical data as seen in the table below.
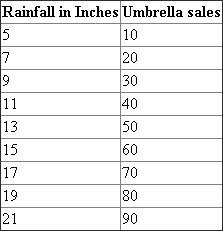 We want to know how Umbrella sales changes as rainfall changes. So, we represent rainfall in inches on the horizontal axis and Umbrella sales on the vertical axis.
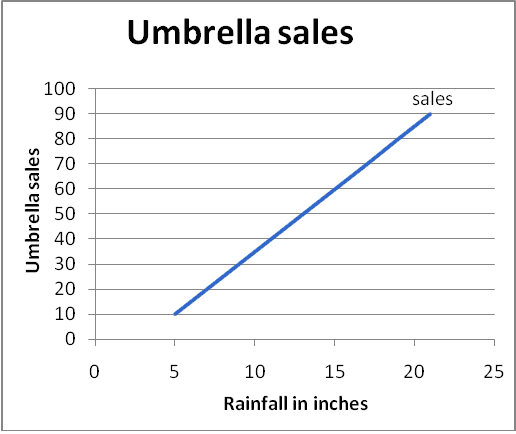 The line in the figure slopes upward to the right. So, it depicts a direct relationship between the number of inches of rainfall per month and the sale of umbrellas.
b) The relationship between the amount of tuition and the level of enrolment at a university is explained by using the hypothetical data given in the table below.
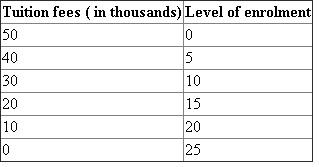 Economists always put price and cost data on the vertical axis. A graph is plotted taking level of enrolment on horizontal axis and tuition fees on vertical axis.
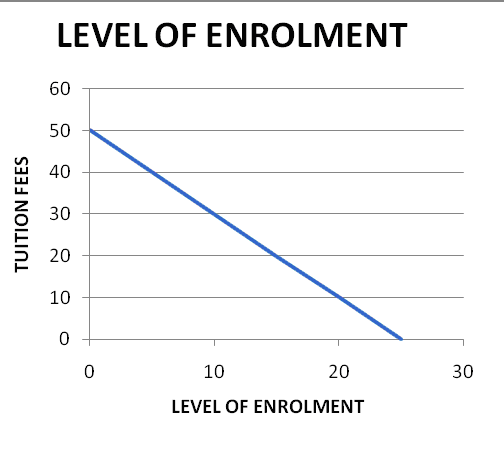 Here we have an inverse relationship because the two variables change in opposite directions. When tuition fees decrease, level of enrolment increases and when tuition fees increase, level of enrolment decreases. We can observe that an inverse relationship always graphs as a down sloping line.
c) Taking a hypothetical data, we can understand the relationship between the popularity of an entertainer and the price of her concert tickets.
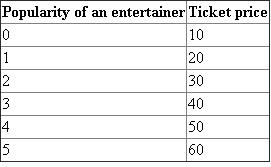
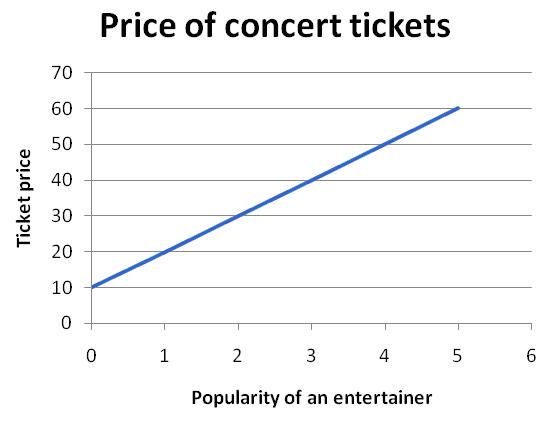 When the entertainer becomes more popular, the ticket price of his/her concert increases. So there is a direct relationship between the two variables and the line representing these two variables slopes upward.
a) Let us see the relationship between the number of inches of rainfall per month and the sale of umbrellas taking a hypothetical data as seen in the table below.
We want to know how Umbrella sales changes as rainfall changes. So, we represent rainfall in inches on the horizontal axis and Umbrella sales on the vertical axis. The line in the figure slopes upward to the right. So, it depicts a direct relationship between the number of inches of rainfall per month and the sale of umbrellas.b) The relationship between the amount of tuition and the level of enrolment at a university is explained by using the hypothetical data given in the table below.
Economists always put price and cost data on the vertical axis. A graph is plotted taking level of enrolment on horizontal axis and tuition fees on vertical axis. Here we have an inverse relationship because the two variables change in opposite directions. When tuition fees decrease, level of enrolment increases and when tuition fees increase, level of enrolment decreases. We can observe that an inverse relationship always graphs as a down sloping line.c) Taking a hypothetical data, we can understand the relationship between the popularity of an entertainer and the price of her concert tickets.
When the entertainer becomes more popular, the ticket price of his/her concert increases. So there is a direct relationship between the two variables and the line representing these two variables slopes upward.
Microeconomics 19th Edition by Campbell McConnell,Stanley Brue,Sean Flynn

Why don’t you like this exercise?
Other Minimum 8 character and maximum 255 character
Character 255