
Cost Management: A Strategic Emphasis 5th Edition by David Stout, Edward Blocher, Gary Cokins
Edition 5ISBN: 0073526940Cost Management: A Strategic Emphasis 5th Edition by David Stout, Edward Blocher, Gary Cokins
Edition 5ISBN: 0073526940Performance Evaluation; Strategy Map; Review of Chapter 18; Correlation Analysis Maydew Manufacturing Inc. is a large manufacturer of lawn and garden equipment including mowers, edgers, tillers, related equipment, and accessories. The firm has been very successful in recent years, and sales have grown more than 10 percent in each of the last five years. The firm is organized into 15 investment centers based on product-line groups. Return on investment (ROI) and residual income (RI) calculations have been made for each of the last four years and used in management compensation for the last two years. Recently Maydew’s top management has contracted with MM&PC, a large consulting firm to review the performance-measurement process at the firm. One of MM&PC’s key recommendations has been to consider the implementation of the balanced scorecard (BSC) both for performance measurement and for strategic management. As a step in this direction, MM&PC has asked Maydew for some data on ROI and other measures being considered for the BSC to analyze the relationships among these data. It is hoped that the analysis will help MM&PC develop a strategy map for the firm. The following data show the most recent year’s ROI for each investment center and the average for the last three years for training hours per employee in the center, customer retention rate in the unit (customers are primarily large department store chains and other distributors of lawn and garden equipment), the QSV score, and the defect rate (per thousand products). The QSV score is a measure of the Quality-Service-Value of the investment center made by an analysis of a variety of operating data including the results of on-site inspection of each unit by key operating executives and other measures of operating performance (the highest score is 10, and the lowest is 0).
Manager | ROI | Training Hours per Employee | Customer Retention | QSV Score | Defect Rate |
1 | 21.3 | 98 | 99.3 | 7 | 3.3 |
2 | 15.4 | 122 | 98.2 | 8 | 4.7 |
3 | 9.6 | 67 | 86.7 | 6 | 11.2 |
4 | 12.4 | 88 | 84.5 | 9 | 13.7 |
5 | 18.6 | 92 | 91.4 | 8 | 2.1 |
6 | 4.5 | 33 | 90.7 | 4 | 28.9 |
7 | 8.8 | 49 | 88.9 | 6 | 1.2 |
8 | 22.6 | 77 | 93.5 | 10 | 12.4 |
9 | 11.8 | 102 | 95.5 | 9 | 8.0 |
10 | 14.6 | 95 | 91.1 | 6 | 7.4 |
11 | 16.5 | 87 | 92.7 | 6 | 2.8 |
12 | 12.1 | 80 | 86.4 | 8 | 4.9 |
13 | 6.2 | 66 | 80.2 | 4 | 15.3 |
14 | 1.3 | 50 | 78.0 | 4 | 22.8 |
15 | 9.7 | 78 | 85.5 | 7 | 30.5 |
Required
1. Using the concept of the strategy map, consider how the nonfinancial factors (training hours, customer retention, QSV, and defect rate) affect ROI. Which of these variables has the greatest influence on ROI? Use regression and correlation analysis to address this requirement.
2. Explain which two managers you would rate as the best overall and which you would rate as the worst overall, and give reasons why.
Step 1 of 2
The objective of this problem is to have the student think of performance evaluation in terms of the strategy map, as defined in Chapter 2 (and illustrated in Exhibit 2.6). Moreover, the problem helps to show, using the concept of the strategy map, that financial measures such as ROI are linked to other measures in the balanced scorecard.
In addition to the ROI for each of the 15 units, the information provided includes the following scorecard measures, and the scorecard perspective to which they belong. The QSV measure is placed in the operations perspective since it appears to reflect primarily operations-related data.
Measure | Scorecard Perspective |
Return on Investment (ROI) | Financial |
Training hours | Learning and Growth |
Customer Retention | Customer perspective |
QSV (Quality Service Value) | Operations |
Defect rate | Operations |
1.?Requirement one asks how the four non-financial scorecard measures contribute to ROI, using regression and correlation analysis using Excel. Both regression and correlation analysis are available in Excel within the Analysis Took Pack under the Tools menu. The most direct way to answer the question is to use the correlation function, the results of which are shown below:
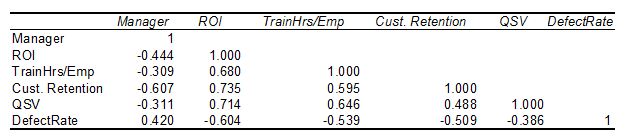
The strategy map (see Exhibit 2.6) can be used to link these scorecard measures in the following way. The correlation values (R) are shown next to the related link in the strategy map. Note that there are two measures and therefore two links in the operations perspective.
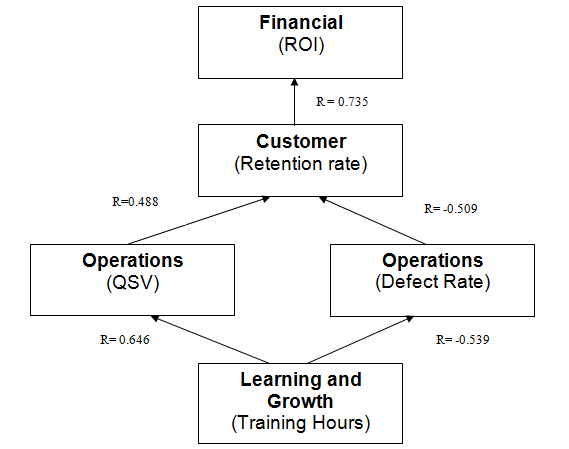
These correlations suggest that there is an important degree of correlation among the scorecard measures, and they are in the expected direction. For example, there is a correlation of 0.735 between the customer retention rate and ROI for the current data for these 15 units. Similarly, the defect rate has an inverse relationship with customer retention. Also, training hours seems to have the desired effect of improving QSV and reducing the defect rate.
The next step could be to ask why the effect of training on the defect rate is not stronger, or why the QSV score does not have a stronger effect on customer retention. Are these in fact the key scorecard measures, or are there other measures that might be more important in influencing customer retention and ROI?
Step 2 of 2
Why don’t you like this exercise?
Other


