
Cost Management: A Strategic Emphasis 5th Edition by David Stout, Edward Blocher, Gary Cokins
Edition 5ISBN: 0073526940Cost Management: A Strategic Emphasis 5th Edition by David Stout, Edward Blocher, Gary Cokins
Edition 5ISBN: 0073526940Direct Labor Rate and Efficiency Variances; Productivity Measures; Review of Chapter 14 Textron Manufacturing Inc. assembles industrial testing instruments in two departments, assembly and testing. Operating data for 2009 and 2010 follow:
| 2010 | 2009 |
Assembly department |
|
|
Actual direct labor-hours per instrument | 20 | 25 |
Actual wage rate per hour | $36 | $30 |
Standard direct labor-hours per instrument | 21 | 24 |
Standard wage rate per hour | $35 | $28 |
Testing department |
|
|
Actual direct labor-hours per instrument | 10 | 12 |
Actual wage rate per hour | $24 | $20 |
Standard direct labor-hours per instrument | 11 | 14 |
Standard wage rate per hour | $25 | $21 |
The firm assembled and tested 20,000 instruments in both 2009 and 2010.
Required
1. Calculate the direct labor rate and the efficiency variances for both departments in both years.
2. Calculate the direct labor partial operational productivity ratio for both departments in both years.
3. Calculate the partial financial productivity for both departments in both years.
4. Compare your answers for requirements 2 and 3. Comment on the results.
5. Do productivity measures offer different perspectives for the firm’s strategic decisions from those of variance analysis?
Step 1 of 5
Direct Labor Variances, Productivity Measures, and Standard Costs (30 min)
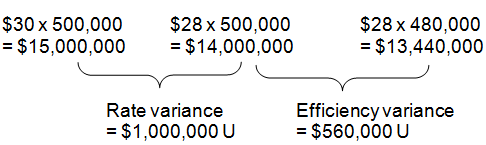
1.?Assembly Department Direct Labor Variances
?2009:
?Total actual direct labor hours: ??25 x 20,000 = 500,000
?Total standard direct labor hours: ?24 x 20,000 = 480,000
?
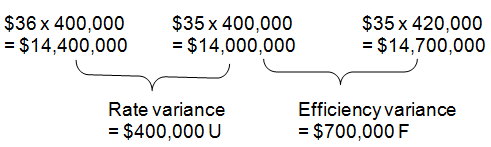
?2010:
?Total actual direct labor hours: ??20 x 20,000 = 400,000
??Total standard direct labor hours: ?21 x 20,000 = 420,000
??
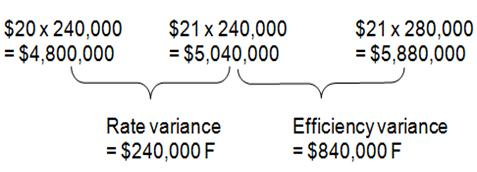
??Testing Department Direct Labor Variances
??2009:
??Total actual direct labor hours: ??12 x 20,000 = 240,000
??Total standard direct labor hours: ?14 x 20,000 = 280,000
??
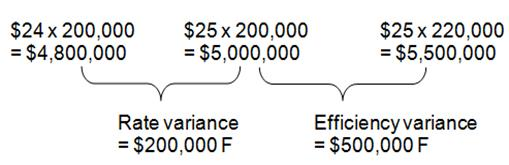
??2010:
??Total actual direct labor hours: ??10 x 20,000 = 200,000
??Total standard direct labor hours: ?11 x 20,000 = 220,000
??
Recap:
? | Assembly Department | Testing Department? | ||
? | 2009 | 2010 | 2009 | 2010 |
Rate variance | $1,000,000 U | $400,000 U | $240,000 F | $200,000 F |
Efficiency variance | $ 560,000 U | $700,000 F | $840,000 F | $500,000 F |
Step 2 of 5
Step 3 of 5
Step 4 of 5
Step 5 of 5
Why don’t you like this exercise?
Other


