
Cost Management: A Strategic Emphasis 5th Edition by David Stout, Edward Blocher, Gary Cokins
Edition 5ISBN: 0073526940Cost Management: A Strategic Emphasis 5th Edition by David Stout, Edward Blocher, Gary Cokins
Edition 5ISBN: 0073526940Graphical Analysis—Variable Overhead Variances You are in charge of making a presentation to operating managers regarding the meaning of the total overhead variance that appears each month on their performance reports. The controller suggested that a graphical presentation might be an effective way to communicate the essential points to your audience. As such, she provided you with this partially completed graph. This graph represents a situation where: (1) machine hours are used to apply variable overhead costs to products, and (2) there is both an unfavorable variable overhead spending variance and an unfavorable variable overhead efficiency variance for the period in question. The controller also indicated that she would like you to use the following notation for some of the items to be included in your chart: actual number of machine hours worked during the period = AQ; standard number of machine hours allowed for the output of the period = SQ; actual variable overhead cost per machine hour worked during the period = AP; and standard variable overhead cost per machine hour = SP.
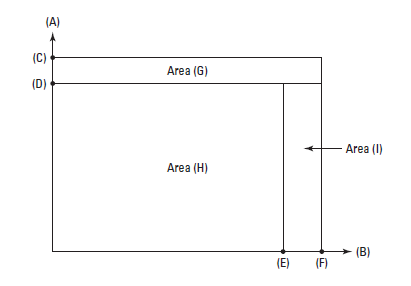
Required Based on the preceding assumptions and information, properly label the following components of the above graph:
1. (A) = ?
2. (B) = ?
3. (C) = ?
4. (D) = ?
5. (E) = ?
6. (F) = ?
7. Area (G) = ?
8. Area (H) = ?
9. Area (I) = ?
10. Sum of areas (G), (H), and (I) = ?
Step 1 of 10
Cost Variance and Capacity Management:
Cost variance (CV), otherwise called spending fluctuation, is the distinction between the real expense and the planned expense, or what you expected to spend versus what you really spent.
Capacity management refers to the demonstration of guaranteeing a business amplifies its possible exercises and creation yield—consistently, under all conditions. The limit of a business quantifies how much organizations can accomplish, produce, or sell inside a given time-span.
Step 2 of 10
Step 3 of 10
Step 4 of 10
Step 5 of 10
Step 6 of 10
Step 7 of 10
Step 8 of 10
Step 9 of 10
Step 10 of 10
Why don’t you like this exercise?
Other


