
Cost Management: A Strategic Emphasis 5th Edition by David Stout, Edward Blocher, Gary Cokins
Edition 5ISBN: 0073526940Cost Management: A Strategic Emphasis 5th Edition by David Stout, Edward Blocher, Gary Cokins
Edition 5ISBN: 0073526940Cost Estimation, Regression Analysis Plantcity is a large nursery and retail store specializing in house and garden plants and supplies. Jean Raouth, the assistant manager, is in the process of budgeting monthly supplies expense for 2010. She assumes that in some way supplies expense is related to sales, either in units or in dollars. She has collected these data for sales and supplies expenses for June 2007 through December 2009, and has estimated sales for 2010:
Date | Supplies Expense | Sales Units | Sales Dollars |
Jun 2007 | $2,745 | 354 | $2,009 |
Jul | 3,200 | 436 | 2,190 |
Aug | 3,232 | 525 | 2,878 |
Sep | 2,199 | 1 45 | 1,856 |
Oct | 2,321 | 199 | 2,168 |
Nov | 3,432 | 543 | 2,152 |
Dec | 4,278 | 1,189 | 2,463 |
Jan 2008 | 2,310 | 212 | 1,999 |
Feb | 2,573 | 284 | 2,190 |
Mar | 2,487 | 246 | 1,894 |
Apr | 2,484 | 278 | 2,134 |
May | 3,384 | 498 | 3,210 |
Jun | 2,945 | 424 | 2,850 |
Jul | 2,758 | 312 | 2,265 |
Aug | 3,394 | 485 | 2,435 |
Sep | 2,254 | 188 | 1,893 |
Oct | 2,763 | 276 | 2,232 |
Nov | 3,245 | 489 | 3,004 |
Dec | 4,576 | 1,045 | 3,309 |
Jan 2009 | 2,103 | 104 | 2,195 |
Feb | 2,056 | 167 | 2,045 |
Mar | 3,874 | 298 | 2,301 |
Apr | 2,784 | 398 | 2,345 |
May | 2,345 | 187 | 1,815 |
Jun | 2,912 | 334 | 2,094 |
Jul | 2,093 | 264 | 1,934 |
Aug | 2,873 | 333 | 2,054 |
Sep | 2,563 | 1 43 | 1,977 |
Oct | 2,384 | 245 | 1,857 |
Nov | 2,476 | 232 | 2,189 |
Dec | 3,364 | 1 ,1 22 | 3,433 |
Jan 2010 (estimated) |
| 180 | $1,600 |
Feb |
| 230 | 2,000 |
Mar |
| 190 | 1,900 |
Apr |
| 450 | 2,400 |
May |
| 350 | 2,300 |
Jun |
| 350 | 2,300 |
Jul |
| 450 | 2,500 |
Aug |
| 550 | 3,000 |
Sep |
| 300 | 2,500 |
Oct |
| 300 | 2,500 |
Nov |
| 450 | 3,200 |
Dec |
| 950 | 3,900 |
Required
1. Develop the regression that Jean should use based on these data and use the regression procedure in Excel or an equivalent regression software program. Evaluate the reliability and precision of the regression you have chosen.
2. What are the predicted monthly figures for supplies expense for 2010?
Step 1 of 2
Cost Estimation; Regression Analysis (50 min)
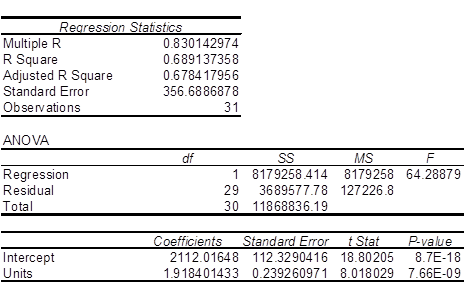
1.?The spreadsheet regression output for Plantcity is shown in Exhibits 8-58A, B and C. Exhibit 8-58A shows the regression which includes both predictors, sales dollars and sales units, while Exhibit 8-58B shows sales dollars only, and Exhibit 8-58C shows sales units only.
Exhibit 8-58A (Units and Dollars)
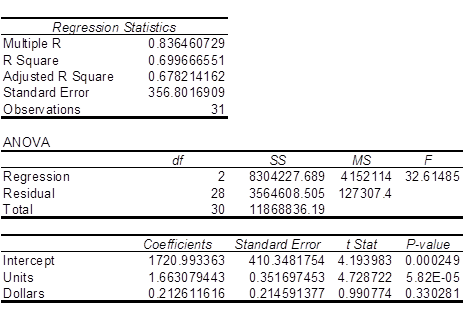
Exhibit 8-58B (Dollars)
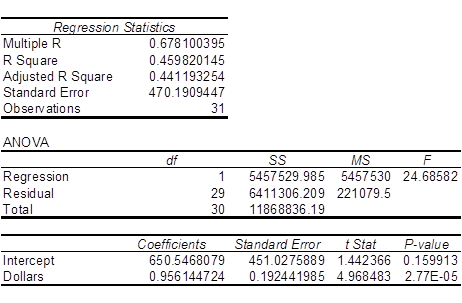
Exhibit 8-58C (Units)
?
The precision of the regression shown in 8-58A is good, with a standard error of the estimate of 356 relative to a dependent variable with values averaging about 3,000. Also, the reliability of the model is quite good, with an R-squared of 68%, an F value of 32.6 and a t-value on sales units of 4.7. However, the t-value on the sales dollars variable is poor, as shown by the low t-value (.99).
The regression using sales dollars only (Exhibit 8-58B) is somewhat worse while the regression on sales units (Exhibit 8-58C) gives almost equivalent R-squared and standard errors values to the model with both units and dollars. Because the regression on sales units only is simpler and has a lower standard error and higher R-squared, the model using only sales units is a logical choice for the cost estimation model in this case.
For further regression analysis on this data, consider the graphs below which shows evidence of seasonality in the data.
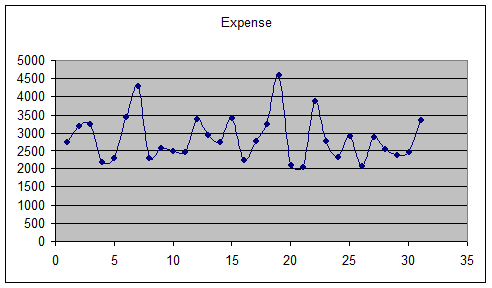
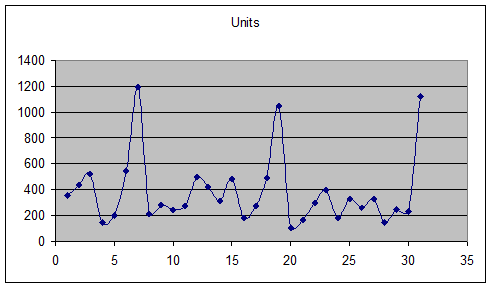
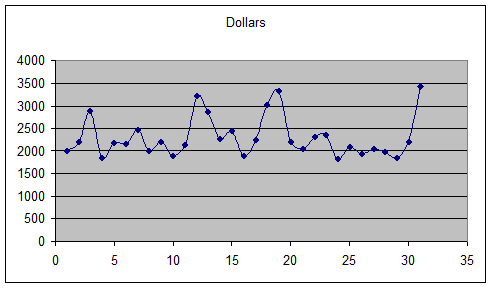
Since the graphs show clear evidence of seasonality, another try of the model with seasonality included would be a useful next step. The addition of a seasonal variable for the month of December improved the model in Exhibit 8-58C substantially.
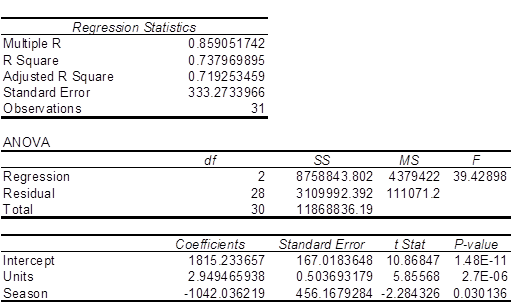
The seasonal model for sales dollars is shown in Exhibit 8-58D. Note the substantial improvement in R-squared; also note that the seasonal variable is significant. The coefficient on the seasonality variable is negative because supplies expense does not rise as fast as units sold in December.
Exhibit 8-58D
Step 2 of 2
Why don’t you like this exercise?
Other


