
Cost Management: A Strategic Emphasis 5th Edition by David Stout, Edward Blocher, Gary Cokins
Edition 5ISBN: 0073526940Cost Management: A Strategic Emphasis 5th Edition by David Stout, Edward Blocher, Gary Cokins
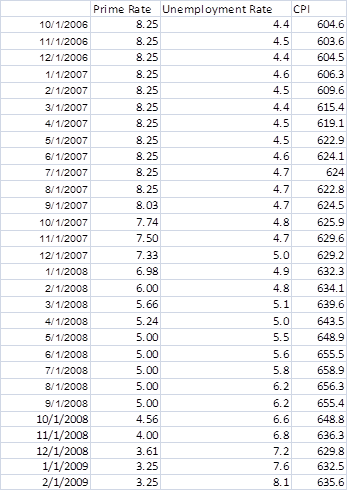
Edition 5ISBN: 0073526940Regression Analysis; Use of the Internet Economists and business planners often need to make projections of interest rates in order to effectively plan for the purchase of equipment and other assets. The timing of these investments is a critical part of the firm’s financial management and can have a dramatic effect on the firm’s profitability. This is particularly important during times of liquidity problems as we have had in the financial markets. As a CFO of a large retail firm that requires significant amounts of seasonal borrowing, you are interested in forecasting the prime rate for the next several months. You think you can get a good prediction for the consumer price index (CPI) and the unemployment rate months ahead, based on other studies and economic forecasts to which you have access. You have decided to use regression analysis to develop a model to predict the prime rate from the CPI and the unemployment rate. The data for monthly interest rate data (prime rate) from the Federal Reserve Board can be found at the FED Web site (www.stls.frb.org/fred/data/irates/mprime) and the employment and CPI information is provided by the U.S. Bureau of Labor Statistics (www.bls. gov/data/home.htm). The data for 24 months from October 2006 through September 2008 is provided below. The CPI data is for all U.S. items (indexed at year 1967); the unemployment rate is for all civilian unemployment.
Month/ Year | Prime Rate | CPI | Unemploymen Rate |
10/2006 | 8.25 | 604.6 | 4.4 |
11/2006 | 8.25 | 603.6 | 4.5 |
12/2006 | 8.25 | 604.5 | 4.4 |
1/2007 | 8.25 | 606.3 | 4.6 |
2/2007 | 8.25 | 609.6 | 4.5 |
3/2007 | 8.25 | 615.4 | 4.4 |
4/2007 | 8.25 | 619.1 | 4.5 |
5/2007 | 8.25 | 622.9 | 4.5 |
6/2007 | 8.25 | 624.1 | 4.6 |
7/2007 | 8.25 | 624.0 | 4.7 |
8/2007 | 8.25 | 622.8 | 4.7 |
9/2007 | 8.03 | 624.5 | 4.7 |
10/2007 | 7.74 | 625.9 | 4.8 |
11/2007 | 7.50 | 629.6 | 4.7 |
12/2007 | 7.33 | 629.2 | 5.0 |
1/2008 | 6.98 | 632.3 | 4.9 |
2/2008 | 6.00 | 634.1 | 4.8 |
3/2008 | 5.66 | 639.6 | 5.1 |
4/2008 | 5.24 | 643.5 | 5.0 |
5/2008 | 5.00 | 648.9 | 5.5 |
6/2008 | 5.00 | 655.5 | 5.5 |
7/2008 | 5.00 | 658.9 | 5.7 |
8/2008 | 5.00 | 656.3 | 6.1 |
9/2008 | 5.00 | 655.4 | 6.1 |
Required
1.Develop a regression model to predict interest rates using the Bureau of Labor Statistics and Federal Reserve Board data above. Evaluate the results of the regression.
2. Use the model you developed to predict the prime rate for December 2008 if the CPI is expected to be 670 and the unemployment rate is expected to be 6.6 in December.
3. What other economic data can you find on the Web that would help in predicting the prime interest rate? Include the Web links in your answer, if appropriate.
4. To follow up on the regression analysis in part 1, go to the Web sites indicated above, include the most recent data, and rerun the regressions with the same objective of predicting the prime rate for December 2008. Compare your results to the finding for the regression in part 1 and to the actual prime rate in December 2008. Why the difference, if any?
Step 1 of 4
Regression Analysis; Use of the Internet (50 min)
Note: This problem was written in September 2008, and the solution below reflects the data for the period through September 2008. The solution also includes a presentation of the results through February 2009, the latest data at the time the solutions manual was prepared.
There are a variety of possible answers to this question. In the example solution above, We have taken the consumer price index and the unemployment rate as plausible predictors of the monthly prime loan rate. We hypothesize that an increase in unemployment is likely a sign of economic downturn which will signal FED officials to consider reducing the FED rate, leading to a reduction in the prime loan rate. We also hypothesize a positive relationship between the consumer price index (CPI) and the loan rate; an increase in inflation will prompt the FED to raise interest rates. The results are shown in the regression report below.
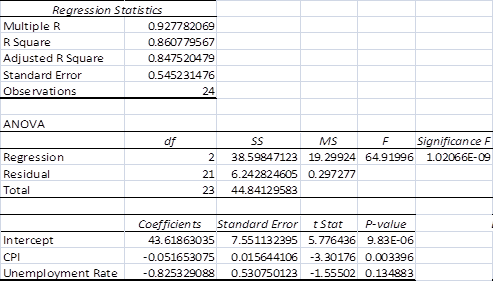
The results show that the CPI variable is significant with a p-value less than .01. The relationship between the CPI and the loan rate is negative, indicating that increases in the CPI tend to be associated with decreases in the loan rate, not predicted in our hypothesis.
The relationship between loan rate and the unemployment rate is negative as expected, indicating that a rise in the unemployment rate is associated with a fall in the prime loan rate, but the relationship is not significant (p=.123).
Data for the problem are contained in the imbedded Excel spreadsheet below; double-click and copy the data for your own use. Note that the data includes an update for the months through February 2009, as explained later in this solution note.
?The overall results for the regression are very significant with an R-squared of .86 and a p-value less than .01. To further study the regression results we obtained the correlation matrix for the three variables, as follows:
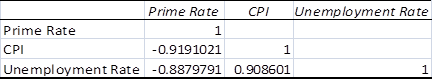
Note the high correlation between each of the independent variables and the dependent variable. Also, note the high correlation, .9086, between the two independent variables. This indicates that the two variables are both strong predictors of the dependent variable, and that one of the independent variables will tend to dominate the other in the multiple regression. The results are likely to be improved by using simple regressions for each variable. A simple regression for each variable is shown below.
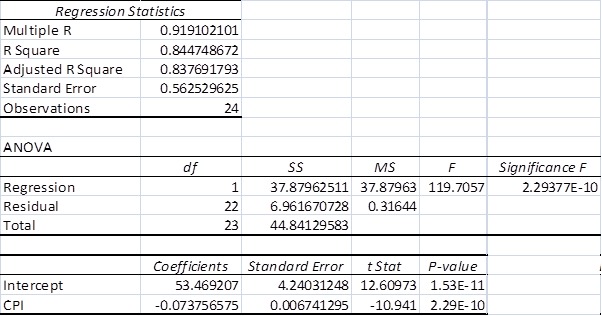
Simple Regression for CPI only:
Simple Regression for Unemployment rate only
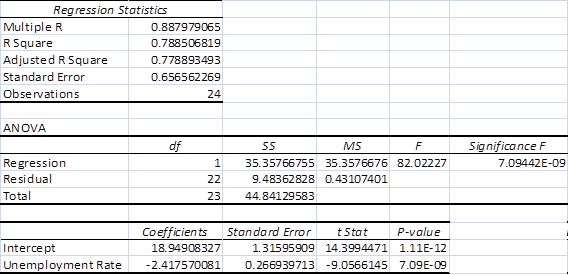
Looking at the three regressions together, it is clear they are very much the same, but the regression with both variables is slightly better for R-squared and SE. Since our focus is on predicting the dependent variable, and not on interpreting the coefficients of the independent variables, we choose to use the combined equation.
At March 31, 2009, the time of this writing, the available prime rate, CPI, and unemployment rate data were as follows (note that the unemployment rates for June through September 2008 were adjusted by the Bureau of Labor Statistics; the CPI and prime rate data were unchanged):
Month | Prime Rate | CPI | Unemp. Rate |
6/2008 | 5.0 | 655.5 | 5.6 |
7/2008 | 5.0 | 658.9 | 5.8 |
8/2008 | 5.0 | 656.3 | 6.2 |
9/2008 | 5.0 | 655.4 | 6.2 |
10/2008 | 4.56 | 648.8 | 6.6 |
11/2008 | 4.0 | 636.3 | 6.8 |
12/2008 | 3.61 | 629.8 | 7.2 |
1/2009 | 3.25 | 632.5 | 7.6 |
2/2009 | 3.25 | 635.6 | 8.1 |
3/2009 | 3.25 | not available | 8.5 |
Using the regression above with both the CPI and Unemployment variables, we would predict the December 2008’s prime rate to be:
43.6186 - .05165 x 629.8 - .8253 x 7.2 = 5.15%
The actual rate in December 2008 was 3.61%, quite a difference from the model’s prediction. The reason for the difference is the sharp decrease in the CPI relative to the pattern of the prior months. For comparison purposes, the CPI-only model predicted the December prime rate at 7.02% and the Unemployment-rate-only model predicted the December prime rate at 1.54%. Note how the CPI-only model predicts too high because of the steep fall in the CPI during these months, while the Unemployment-only model predicts too low because of the steep increase in unemployment during these months. The model with both predictors turned out to be the best overall model.
A second regression for both CPI and Unemployment rate was run using all data through February 2009
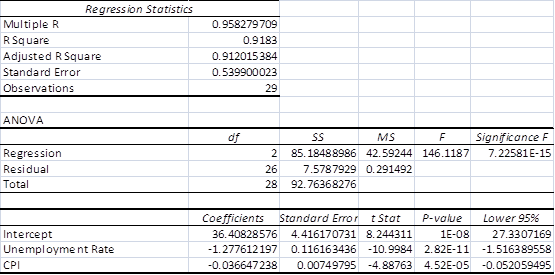
Using the revised regression above, the predicted prime rate for December 2008 is 4.13%, a much more accurate prediction than any of the regressions based only on data through September 2008. The revised regression appears to capture some of the changes in the latter part of 2008 which are critical for accurate predictions.
Overall, the results show the sensitivity of the regression model to sharp increases in the underlying data used in the model. This indicates how important it is to validate the model with other information, to use as complete a set of independent variables as possible, and to continuously update the model as the underlying data change, especially in a time of rapid change as was true in the latter part of 2008 through early 2009.
For comparison to a more stable period, see the results (shown below) of this analysis for the years prior to July 2006.
For comparison, results for August 2004 - 2006 are shown below:
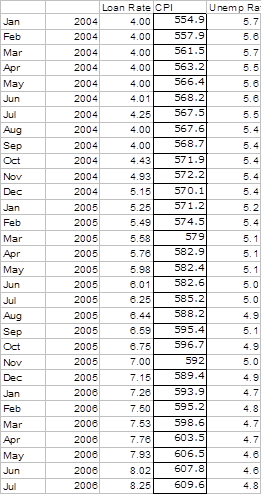
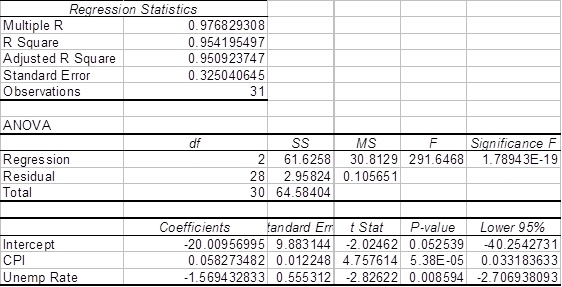
The results for 2004-2006 show that both variables are significant, with p-values less than .01 for each. The relationship between loan rate and the unemployment rate is negative (as it was in 2006-2008), indicating that a rise in the unemployment rate is associated with a fall in the prime loan rate. In contrast to 2006-2008, the relationship between the CPI and the loan rate is positive, indicating that increases in the CPI tend to be associated with increases in the loan rate, as we expected in our original hypothesis.
Step 2 of 4
Step 3 of 4
Step 4 of 4
Why don’t you like this exercise?
Other


