
Introductory Econometrics: A Modern Approach 6th Edition by Jeffrey M Wooldridge
Edition 6ISBN: 130527010XIntroductory Econometrics: A Modern Approach 6th Edition by Jeffrey M Wooldridge
Edition 6ISBN: 130527010XUse the data in HTV.RAW to answer this question.
(i) Using OLS on the full sample, estimate a model for log(wage) using explanatory variables educ, abil, exper, nc, west, south, and urban. Report the estimated return to education and its standard error.
(ii) Now estimate the equation from part (i) using only people with educ<16. What percentage of the sample is lost? Now what is the estimated return to a year of schooling? How does it compare with part (i)?
(iii) Now drop all observations with wage ? 20, so that everyone remaining in the sample earns less than $20 an hour. Run the regression from part (i) and comment on the coefficient on educ. (Because the normal truncated regression model assumes that y is continuous, it does not matter in theory whether we drop observations with wage ? 20 or wage > 20. In practice, including in this application, it can matter slightly because there are some people who earn exactly $20 per hour.)
(iv) Using the sample in part (iii), apply truncated regression [with the upper truncation point being log(20)]. Does truncated regression appear to recover the return to education in the full population, assuming the estimate from (i) is consistent? Explain.
Step 1 of 4
(iii)
When the sample where  <16 is extracted, the number of observations reduced from 1230 to 1064. That means 13.496% of the sample is lost
Estimate LPM for  using
using  as explanatory variables for samples where
  <16 to get the result as:
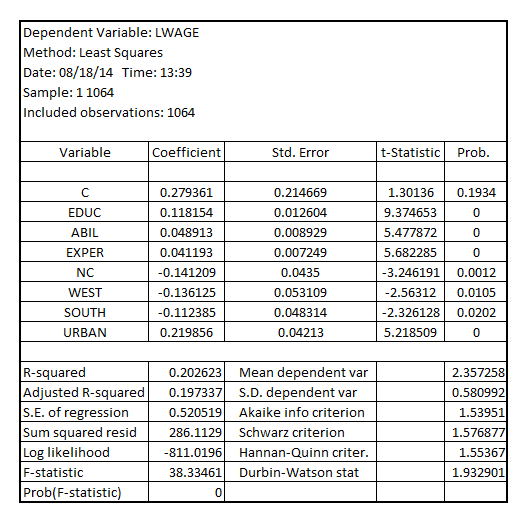
The coefficient of , is the return to education which is 0.118154 and the standard error is 0.012604. This coefficient of
  is greater than that based on the LPM for
  using
using  as explanatory variables using the full database. The standard error has also increased from 0.009689 to 0.012604
Step 2 of 4
Step 3 of 4
Step 4 of 4
Why don’t you like this exercise?
Other


