
Introductory Econometrics: A Modern Approach 6th Edition by Jeffrey M Wooldridge
Edition 6ISBN: 130527010XIntroductory Econometrics: A Modern Approach 6th Edition by Jeffrey M Wooldridge
Edition 6ISBN: 130527010XUse the data in RENTAL.RAW for this exercise. The data on rental prices and other variables for college towns are for the years 1980 and 1990. The idea is to see whether a stronger presence of students affects rental rates. The unobserved effects model is
log(rentt) = ?0+ ?0y90t + ?1log(popit) + ?2log(avgincit) + ?3 pctstuit + ai + uit ,
where pop is city population, avginc is average income, and pctstu is student population as a percentage of city population (during the school year).
(i) Estimate the equation by pooled OLS and report the results in standard form. What do you make of the estimate on the 1990 dummy variable? What do you get for
(ii) Are the standard errors you report in part (i) valid? Explain.
(iii) Now, difference the equation and estimate by OLS. Compare your estimate of fipcmu with that from part (i). Does the relative size of the student population appear to affect rental prices?
(iv) Estimate the model by fixed effects to verify that you get identical estimates and standard errors to those in part (iii).

Step 1 of 6
(i)
Estimating the unobserved effects model by pooled OLS is given by:

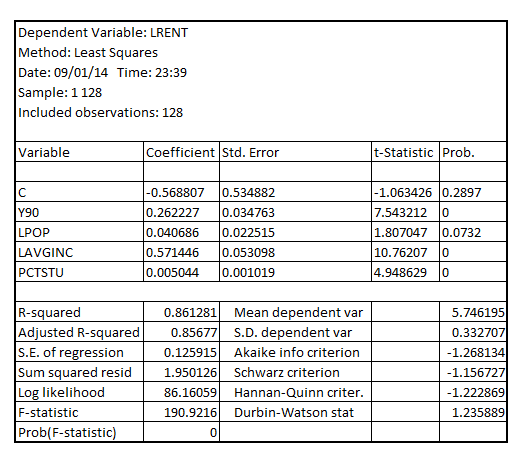
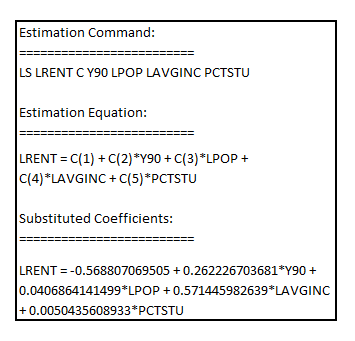
The standard form of the regression model is given by:

The coefficient of  is 0.2622 with the p-value 0.0000 which is less than the critical p-value of 0.05 at 5% level of significance indicating that the explanatory variable
  is statistically significant at 5% level of significance.
The estimate of the coefficient of  at 0.2622 indicates that the rent has recorded the growth of 26.22% over 10 year period from 1980 to 1990, other factors remaining constant
The coefficient of  is 0.00504 with the p-value 0.0000 which is less than the critical p-value of 0.05 at 5% level of significance indicating that the explanatory variable
 is statistically significant at 5% level of significance.
The estimate of the coefficient of  at 0.00504 indicates that 1% point increase in
  result in 0.5% point increase in the rent, other factors remaining constant
Step 2 of 6
Step 3 of 6
Step 4 of 6
Step 5 of 6
Step 6 of 6
Why don’t you like this exercise?
Other


