
Introductory Econometrics: A Modern Approach 6th Edition by Jeffrey M Wooldridge
Edition 6ISBN: 130527010XIntroductory Econometrics: A Modern Approach 6th Edition by Jeffrey M Wooldridge
Edition 6ISBN: 130527010XUse the data in OKUN.RAW to answer this question; see also Computer Exercise.
(i) Estimate the equation pcrgdpt = ?0 + ?1 ?unemt + ut and test the errors for AR(1) serial correlation, without assuming { ?unemt: t = 1, 2, ...} is strictly exogenous. What do you conclude?
(ii) Regress the squared residuals, û2t, on Aunemt (this is the Breusch-Pagan test for heteroskedasticity in the simple regression case). What do you conclude?
(iii) Obtain the heteroskedasticity-robust standard error for the OLS estimate
. Is it substantially different from the usual OLS standard error?
Exercise Okun’s Law—for example, Mankiw (1994, Chapter 2)—implies the following relationship between the annual percentage change in real GDP, pcrgdp, and the change in the annual unemployment rate, ?unem:
pcrgdp = 3 - 2 ?unem.
If the unemployment rate is stable, real GDP grows at 3% annually. For each percentage point increase in the unemployment rate, real GDP grows by two percentage points less. (This should not be interpreted in any causal sense; it is more like a statistical description.)
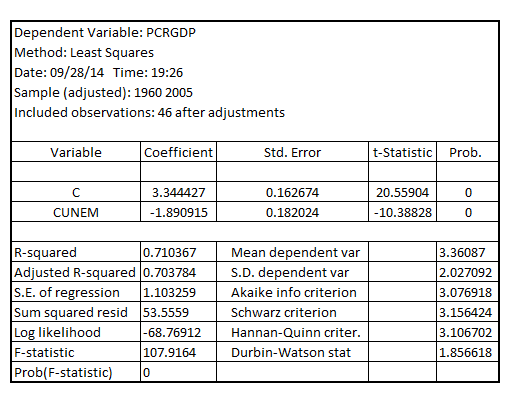
To see if the data on the U.S. economy support Okun’s Law, we specify a model that allows deviations via an error term, pcrgdpt = ?0 + ?1?unemt + ut.
(i) Use the data in OKUN.RAW to estimate the equation. Do you get exactly 3 for the intercept and ?2 for the slope? Did you expect to?
(ii) Find the t statistic for testing H0: ?1 = ?2. Do you reject H0 against the two-sided alternative at any reasonable significance level?
(iii) Find the t statistic for testing H0: ?0 = 3. Do you reject H0 at the 5% level against he two-sided alternative? Is it a “strong” rejection?
(iv) Find the F statistic and p-value for testing H0: ?0 ? = 3, ?1 = ?2 against the alternative that H0 is false. Overall, would you say the data reject or tend to support Okun’s law?
Step 1 of 4
(i)
Estimating the equation given by:

The result is:
Now estimate the error terms from the model and regress
 on
on  and
and , the result is:
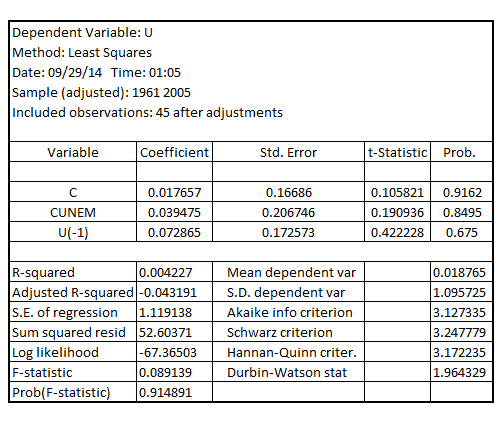
Since, the p-value of  is 0.675 which is greater than the critical p-value of 0.05 at 5% level of significance, indicating that the errors in the model is not statistically significantly AR (1) serially correlated
Step 2 of 4
Step 3 of 4
Step 4 of 4
Why don’t you like this exercise?
Other


