
Introductory Econometrics: A Modern Approach 6th Edition by Jeffrey M Wooldridge
Edition 6ISBN: 130527010XIntroductory Econometrics: A Modern Approach 6th Edition by Jeffrey M Wooldridge
Edition 6ISBN: 130527010XUse CONSUMP.RAW for this exercise. One version of the permanent income hypothesis (PIH) of consumption is that the growth in consumption is unpredictable. [Another version is that the change in consumption itself is unpredictable; see Mankiw (1994, Chapter 15) for discussion of the PIH.] Let ![Use CONSUMP.RAW for this exercise. One version of the <i>permanent income hypothesis </i>(PIH) of consumption is that the <i>growth </i>in consumption is unpredictable. [Another version<i> </i>is that the change in consumption itself is unpredictable; see Mankiw (1994, Chapter 15)<i> </i>for discussion of the PIH.] Let <i> </i>be the growth in real per capita<i> </i>consumption (of nondurables and services). Then the PIH implies that where <i>I</i><sub>t</sub><sub>-</sub><sub>1</sub> denotes information known at time (<i>t </i>? 1); in this case, <i>t </i>denotes a year. (i) Test the PIH by estimating <i> </i>Clearly state the null and alternative hypotheses. What do you conclude? (ii) To the regression in part (i) add the variables <i>gy</i><sub>t</sub><sub>?1</sub>, <i>i</i>3<sub>t</sub><sub>?1</sub>, and <i>inf</i><sub>t</sub><sub>?1</sub>. Are these new variables individually or jointly significant at the 5% level? (Be sure to report the appropriate <i>p</i>-values.) (iii) In the regression from part (ii), what happens to the <i>p</i>-value for the <i>t </i>statistic on <i>gc</i><sub>t</sub><sub>?1</sub>? Does this mean the PIH hypothesis is now supported by the data? (iv) In the regression from part(ii), what is the <i>F </i>statistic and its associated <i>p</i>-value for joint significance of the four explanatory variables? Does your conclusion about the PIH now agree with what you found in part (i)?](https://d2lvgg3v3hfg70.cloudfront.net/SMCC2709/43ae038c_ee9e_4830_9657_fba068ebd51e_SMCC2709_11.jpg) be the growth in real per capita consumption (of nondurables and services). Then the PIH implies that
be the growth in real per capita consumption (of nondurables and services). Then the PIH implies that ![Use CONSUMP.RAW for this exercise. One version of the <i>permanent income hypothesis </i>(PIH) of consumption is that the <i>growth </i>in consumption is unpredictable. [Another version<i> </i>is that the change in consumption itself is unpredictable; see Mankiw (1994, Chapter 15)<i> </i>for discussion of the PIH.] Let <i> </i>be the growth in real per capita<i> </i>consumption (of nondurables and services). Then the PIH implies that where <i>I</i><sub>t</sub><sub>-</sub><sub>1</sub> denotes information known at time (<i>t </i>? 1); in this case, <i>t </i>denotes a year. (i) Test the PIH by estimating <i> </i>Clearly state the null and alternative hypotheses. What do you conclude? (ii) To the regression in part (i) add the variables <i>gy</i><sub>t</sub><sub>?1</sub>, <i>i</i>3<sub>t</sub><sub>?1</sub>, and <i>inf</i><sub>t</sub><sub>?1</sub>. Are these new variables individually or jointly significant at the 5% level? (Be sure to report the appropriate <i>p</i>-values.) (iii) In the regression from part (ii), what happens to the <i>p</i>-value for the <i>t </i>statistic on <i>gc</i><sub>t</sub><sub>?1</sub>? Does this mean the PIH hypothesis is now supported by the data? (iv) In the regression from part(ii), what is the <i>F </i>statistic and its associated <i>p</i>-value for joint significance of the four explanatory variables? Does your conclusion about the PIH now agree with what you found in part (i)?](https://d2lvgg3v3hfg70.cloudfront.net/SMCC2709/e60842e9_0f4a_429e_bec6_7e165c999118_SMCC2709_11.jpg) where It-1 denotes information known at time (t ? 1); in this case, t denotes a year.
where It-1 denotes information known at time (t ? 1); in this case, t denotes a year.
(i) Test the PIH by estimating ![Use CONSUMP.RAW for this exercise. One version of the <i>permanent income hypothesis </i>(PIH) of consumption is that the <i>growth </i>in consumption is unpredictable. [Another version<i> </i>is that the change in consumption itself is unpredictable; see Mankiw (1994, Chapter 15)<i> </i>for discussion of the PIH.] Let <i> </i>be the growth in real per capita<i> </i>consumption (of nondurables and services). Then the PIH implies that where <i>I</i><sub>t</sub><sub>-</sub><sub>1</sub> denotes information known at time (<i>t </i>? 1); in this case, <i>t </i>denotes a year. (i) Test the PIH by estimating <i> </i>Clearly state the null and alternative hypotheses. What do you conclude? (ii) To the regression in part (i) add the variables <i>gy</i><sub>t</sub><sub>?1</sub>, <i>i</i>3<sub>t</sub><sub>?1</sub>, and <i>inf</i><sub>t</sub><sub>?1</sub>. Are these new variables individually or jointly significant at the 5% level? (Be sure to report the appropriate <i>p</i>-values.) (iii) In the regression from part (ii), what happens to the <i>p</i>-value for the <i>t </i>statistic on <i>gc</i><sub>t</sub><sub>?1</sub>? Does this mean the PIH hypothesis is now supported by the data? (iv) In the regression from part(ii), what is the <i>F </i>statistic and its associated <i>p</i>-value for joint significance of the four explanatory variables? Does your conclusion about the PIH now agree with what you found in part (i)?](https://d2lvgg3v3hfg70.cloudfront.net/SMCC2709/d9e351f7_2cf8_48f1_b779_927ccfd2858f_SMCC2709_11.jpg) Clearly state the null and alternative hypotheses. What do you conclude?
Clearly state the null and alternative hypotheses. What do you conclude?
(ii) To the regression in part (i) add the variables gyt?1, i3t?1, and inft?1. Are these new variables individually or jointly significant at the 5% level? (Be sure to report the appropriate p-values.)
(iii) In the regression from part (ii), what happens to the p-value for the t statistic on gct?1? Does this mean the PIH hypothesis is now supported by the data?
(iv) In the regression from part(ii), what is the F statistic and its associated p-value for joint significance of the four explanatory variables? Does your conclusion about the PIH now agree with what you found in part (i)?
Step 1 of 7
(i)
Estimating the regression model:

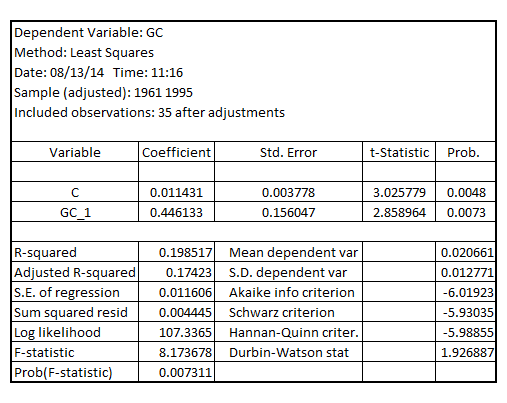
In order to test for the significance of the coefficient , Wald test would be used.
Step 2 of 7
Step 3 of 7
Step 4 of 7
Step 5 of 7
Step 6 of 7
Step 7 of 7
Why don’t you like this exercise?
Other


