
Introductory Econometrics: A Modern Approach 6th Edition by Jeffrey M Wooldridge
Edition 6ISBN: 130527010XIntroductory Econometrics: A Modern Approach 6th Edition by Jeffrey M Wooldridge
Edition 6ISBN: 130527010XUse the data in EZANDERS.RAW for this exercise. The data are on monthly unemployment claims in Anderson Township in Indiana, from January 1980 through November 1988. In 1984, an enterprise zone (EZ) was located in Anderson (as well as other cities in Indiana). [See Papke (1994) for details.]
(i) Regress log(uclms) on a linear time trend and 11 monthly dummy variables. What was the overall trend in unemployment claims over this period? (Interpret the coefficient on the time trend.) Is there evidence of seasonality in unemployment claims?
(ii) Add ez, a dummy variable equal to 1 in the months Anderson had an EZ, to the regression in part (i). Does having the enterprise zone seem to decrease unemployment claims? By how much? [You should use formula (7.10) from Chapter 7.]
(iii) What assumptions do you need to make to attribute the effect in part (ii) to the creation of an EZ?
Step 1 of 4
(i)
When the variable  is regressed on the linear time trend and 11 monthly dummy variables, keeping JAN month dummy variable as base, the regression model results in:
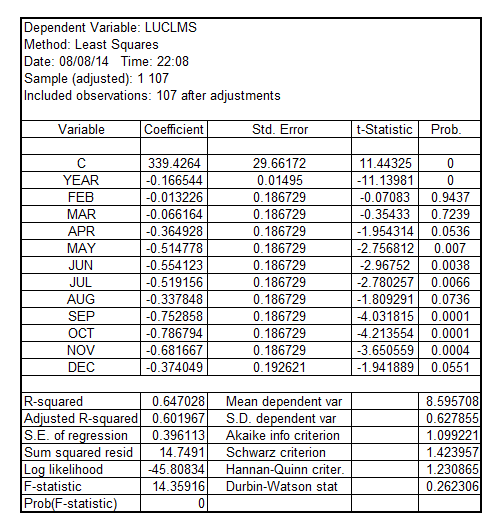
The overall trend in the unemployment claims over the period is downward as indicated by the coefficient of YEAR which is -0.166544.
On an average, the unemployment claims fell by 16.65% per year.
On observing the p-value of the coefficients of the monthly dummy variables, it is discovered that the coefficients of MAY, JUN, JUL, SEP, OCT and NOV are significant at 5% level of significance as their p-value is less the critical p-value of 0.05
This indicates towards the presence of seasonal factors behind unemployment claims.
Going further, to indicate that there is strong seasonality in the unemployment claims, it would be appropriate to perform a Wald test to test the joint significance of 11 monthly dummy variables.
The result is:
 The coefficients of 11 monthly dummy variables are not significant
 The coefficients of 11 monthly dummy variables are significant
The result of the Wald test is:
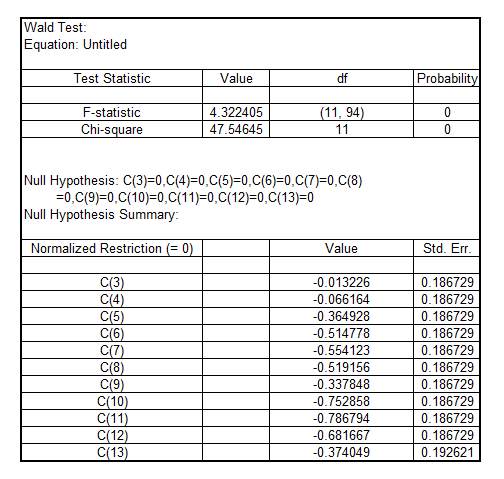
Since, the p-value corresponding to F-statistics is 0 which is less the critical p-value of 0.05, it can be concluded that all the 11 monthly dummy variables are jointly significant.
Hence, there is a stronger evidence of seasonality in unemployment claims.
Step 2 of 4
Step 3 of 4
Step 4 of 4
Why don’t you like this exercise?
Other


