expand icon
book Introductory Econometrics: A Modern Approach 6th Edition by Jeffrey M Wooldridge cover

Introductory Econometrics: A Modern Approach 6th Edition by Jeffrey M Wooldridge

Edition 6ISBN: 130527010X
book Introductory Econometrics: A Modern Approach 6th Edition by Jeffrey M Wooldridge cover

Introductory Econometrics: A Modern Approach 6th Edition by Jeffrey M Wooldridge

Edition 6ISBN: 130527010X
Exercise 24

The following analysis was obtained using data in MEAP93.RAW, which contains schoollevel pass rates (as a percent) on a 10th grade math test.

(i) The variable expend is expenditures per student, in dollars, and math10 is the pass rate on the exam. The following simple regression relates math10 to lexpend 5 log(expend):

 The following analysis was obtained using data in MEAP93.RAW, which contains schoollevel pass rates (as a percent) on a 10th grade math test. (i) The variable <i>expend </i>is expenditures per student, in dollars, and <i>math</i>10 is the pass rate on the exam. The following simple regression relates <i>math</i>10 to <i>lexpend </i><i>5 </i>log(<i>expend</i>): <i>   </i> Interpret the coefficient on <i>lexpend</i>. In particular, if <i>expend </i>increases by 10%, what is the estimated percentage point change in <i>math</i>10? What do you make of the large negative intercept estimate? (The minimum value of <i>lexpend </i>is 8.11 and its average value is 8.37.) (ii) Does the small <i>R</i>-squared in part (i) imply that spending is correlated with other factors affecting <i>math</i>10? Explain. Would you expect the <i>R</i>-squared to be much higher if expenditures were randomly assigned to schools—that is, independent of other school and student characteristics-rather than having the school districts determine spending? (iii) When log of enrollment and the percent of students eligible for the federal free lunch program are included, the estimated equation becomes <i>   </i>Comment on what happens to the coefficient on <i>lexpend</i>. Is the spending coefficient still statistically different from zero? (iv) What do you make of the <i>R</i>-squared in part (iii)? What are some other factors that could be used to explain <i>math</i>10 (at the school level)?

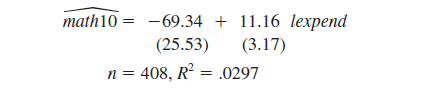
Interpret the coefficient on lexpend. In particular, if expend increases by 10%, what is the estimated percentage point change in math10? What do you make of the large negative intercept estimate? (The minimum value of lexpend is 8.11 and its average value is 8.37.)

(ii) Does the small R-squared in part (i) imply that spending is correlated with other factors affecting math10? Explain. Would you expect the R-squared to be much higher if expenditures were randomly assigned to schools—that is, independent of other school and student characteristics-rather than having the school districts determine spending?

(iii) When log of enrollment and the percent of students eligible for the federal free lunch program are included, the estimated equation becomes

 The following analysis was obtained using data in MEAP93.RAW, which contains schoollevel pass rates (as a percent) on a 10th grade math test. (i) The variable <i>expend </i>is expenditures per student, in dollars, and <i>math</i>10 is the pass rate on the exam. The following simple regression relates <i>math</i>10 to <i>lexpend </i><i>5 </i>log(<i>expend</i>): <i>   </i> Interpret the coefficient on <i>lexpend</i>. In particular, if <i>expend </i>increases by 10%, what is the estimated percentage point change in <i>math</i>10? What do you make of the large negative intercept estimate? (The minimum value of <i>lexpend </i>is 8.11 and its average value is 8.37.) (ii) Does the small <i>R</i>-squared in part (i) imply that spending is correlated with other factors affecting <i>math</i>10? Explain. Would you expect the <i>R</i>-squared to be much higher if expenditures were randomly assigned to schools—that is, independent of other school and student characteristics-rather than having the school districts determine spending? (iii) When log of enrollment and the percent of students eligible for the federal free lunch program are included, the estimated equation becomes <i>   </i>Comment on what happens to the coefficient on <i>lexpend</i>. Is the spending coefficient still statistically different from zero? (iv) What do you make of the <i>R</i>-squared in part (iii)? What are some other factors that could be used to explain <i>math</i>10 (at the school level)? 
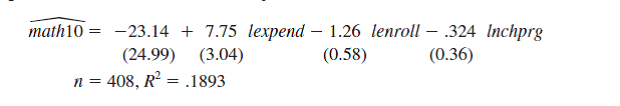
Comment on what happens to the coefficient on lexpend. Is the spending coefficient still statistically different from zero?

(iv) What do you make of the R-squared in part (iii)? What are some other factors that could be used to explain math10 (at the school level)?

Step-by-step solution
Verified
like image
like image

Step 1 of 4

The obtained regression results are as follows:

    <div class=answer> The obtained regression results are as follows:   i) The coefficient of <i>lexpend</i> is 11.16. This implies that a 1% increase in <i>expenditure</i> will increase the <i>pass rate</i> in exams by 11.16/100 = 0.1116 units. Also, this can be interpreted as a 10% increase in <i>expenditure</i> will increase the <i>pass rate</i> in exams by 1.116 units. The large negative intercept (69.34) shows that without any expenditure per student, the pass rate in the exams is negative by 69.34 units.

i)

The coefficient of lexpend is 11.16. This implies that a 1% increase in expenditure will increase the pass rate in exams by 11.16/100 = 0.1116 units.

Also, this can be interpreted as a 10% increase in expenditure will increase the pass rate in exams by 1.116 units.

The large negative intercept (69.34) shows that without any expenditure per student, the pass rate in the exams is negative by 69.34 units.


Step 2 of 4


Step 3 of 4


Step 4 of 4

close menu
Introductory Econometrics: A Modern Approach 6th Edition by Jeffrey M Wooldridge
cross icon