
Introductory Econometrics: A Modern Approach 6th Edition by Jeffrey M Wooldridge
Edition 6ISBN: 130527010XIntroductory Econometrics: A Modern Approach 6th Edition by Jeffrey M Wooldridge
Edition 6ISBN: 130527010XRefer to Computer Exercise C2 in Chapter 3. Now, use the log of the housing price as the dependent variable:

(i) You are interested in estimating and obtaining a confidence interval for the percentage change in price when a 150-square-foot bedroom is added to a house. In decimal form, this is  Use the data in HPRICE1.RAW to estimate
(ii) Write  in terms of
  and
and  and plug this into the log(price) equation.
(iii) Use part (ii) to obtain a standard error for  and use this standard error to construct a 95% confidence interval.
Reference: Exercise C2:
Use the data in HPRICE1.RAW to estimate the model

where price is the house price measured in thousands of dollars.
(i) Write out the results in equation form.
(ii) What is the estimated increase in price for a house with one more bedroom, holding square footage constant?
(iii) What is the estimated increase in price for a house with an additional bedroom that is 140 square feet in size? Compare this to your answer in part (ii).
(iv) What percentage of the variation in price is explained by square footage and number of bedrooms?
(v) The first house in the sample has sqrft = 2,438 and bdrms = 4. Find the predicted selling price for this house from the OLS regression line.
(vi) The actual selling price of the first house in the sample was $300,000 (so price = 300). Find the residual for this house. Does it suggest that the buyer underpaid or overpaid for the house?
Step 1 of 12
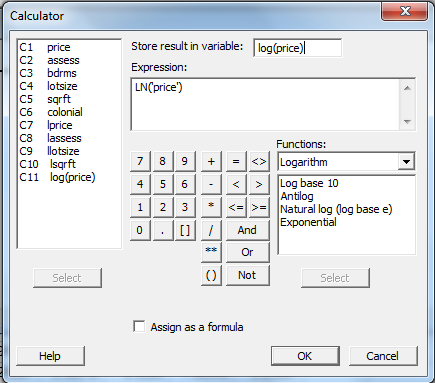
(i)
First, make column of “log (price)” by going to Calc > Calculator. In the appeared dialog box, enter values as shown below:
Step 2 of 12
Step 3 of 12
Step 4 of 12
Step 5 of 12
Step 6 of 12
Step 7 of 12
Step 8 of 12
Step 9 of 12
Step 10 of 12
Step 11 of 12
Step 12 of 12
Why don’t you like this exercise?
Other


