
Introductory Econometrics: A Modern Approach 6th Edition by Jeffrey M Wooldridge
Edition 6ISBN: 130527010XIntroductory Econometrics: A Modern Approach 6th Edition by Jeffrey M Wooldridge
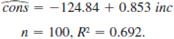
Edition 6ISBN: 130527010XIn the linear consumption function

the (estimated) marginal propensity to consume (MPC) out of income is simply the slope, J3V while the average propensity to consume (APC) is cons/inc = (ijinc + fiv Using observations for 100 families on annual income and consumption (both measured in dollars), the following equation is obtained:
(i) Interpret the intercept in this equation, and comment on its sign and magnitude.
(ii) What is the predicted consumption when family income is $30,000?
(iii) With inc on the x-axis, draw a graph of the estimated MPC and APC.
Step 1 of 4
The estimated least square line is given by:

Here,  is the estimate of slope
 . The dependent variable
 depends on the independent variable
 . The most important part of the above regression line is the slope
 which depicts the change in predicted value of
 due to one unit change in predictor variable
 . Consider the provided regression equation to solve the subparts:

Here, consumption is the dependent variable and income is the independent variable.
Step 2 of 4
Step 3 of 4
Step 4 of 4
Why don’t you like this exercise?
Other


