College Algebra in Context with Applications for the Managerial, Life, and Social Sciences 3rd Edition by Ronald J Harshbarger, Lisa Yocco
Edition 3ISBN: 032157060X
College Algebra in Context with Applications for the Managerial, Life, and Social Sciences 3rd Edition by Ronald J Harshbarger, Lisa Yocco
Edition 3ISBN: 032157060XStep 1 of 3
Consider that the table below gives the median household income for whites and blacks in various years.
Median Household Income
| Year | Whites | Blacks |
| 1981 | 38,954 | 21,859 |
| 1985 | 40,614 | 24,163 |
| 1990 | 42,622 | 25,488 |
| 1995 | 42,871 | 26,842 |
| 2000 | 46,910 | 31,690 |
| 2001 | 46,261 | 30,625 |
| 2002 | 46,119 | 29,691 |
| 2003 | 45,631 | 29,645 |
| 2005 | 48,554 | 30,858 |
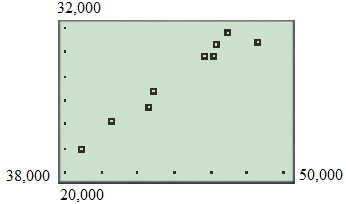
(a) Let us make a scatter plot of these data, with x represent the median household income for whites and y represent the corresponding median household income for blacks.
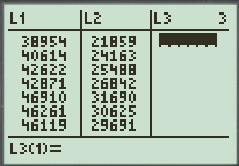
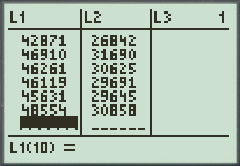
Enter the data from the above table in the lists of a graphing utility.
The figure below shows a partial list of the data points.


The scatter plot of all the data points from the table is shown below:

Step 2 of 3
Step 3 of 3
Why don’t you like this exercise?
Other


