
College Algebra in Context with Applications for the Managerial, Life, and Social Sciences 3rd Edition by Ronald J Harshbarger, Lisa Yocco
Edition 3ISBN: 032157060XCollege Algebra in Context with Applications for the Managerial, Life, and Social Sciences 3rd Edition by Ronald J Harshbarger, Lisa Yocco
Edition 3ISBN: 032157060X Exercise 22
Step-by-step solution Verified
Step 1 of 6
Consider the table,
| x | 1 | 3 | 5 | 7 | 9 |
| y | 4 | 7 | 10 | 13 | 16 |
Need to find the linear function that best fit for the data:
Draw the scatter diagram by using graphing calculator
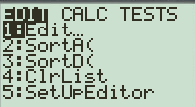
Need to use the following operation to make the table.
Press  and
and  (or
(or ) to enter Stat Edit mode
The display is as shown below.
Step 2 of 6
Step 3 of 6
Step 4 of 6
Step 5 of 6
Step 6 of 6
College Algebra in Context with Applications for the Managerial, Life, and Social Sciences 3rd Edition by Ronald J Harshbarger, Lisa Yocco
Why don’t you like this exercise?
Other Minimum 8 character and maximum 255 character
Character 255


