expand icon
book College Algebra in Context with Applications for the Managerial, Life, and Social Sciences 3rd Edition by Ronald J Harshbarger, Lisa Yocco cover

College Algebra in Context with Applications for the Managerial, Life, and Social Sciences 3rd Edition by Ronald J Harshbarger, Lisa Yocco

Edition 3ISBN: 032157060X
Exercise 12
Step-by-step solution
Verified
like image
like image

Step 1 of 7

Write the data in the bar graph as tabular form. The table represents the average daily number of inmates.

Year

Average daily number of inmates

1993

96

1994

109

1995

119

1996

116

1997

137

1998

143

a)

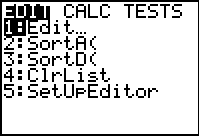
The aligned data have     <div class=answer> Write the data in the bar graph as tabular form. The table represents the average daily number of inmates. <table style=border-collapse:collapse; border=1>     <tbody>      <tr>       <td> Year </td>       <td> Average daily number of inmates </td>      </tr>      <tr>       <td> 1993 </td>       <td> 96 </td>      </tr>      <tr>       <td> 1994 </td>       <td> 109 </td>      </tr>      <tr>       <td> 1995 </td>       <td> 119 </td>      </tr>      <tr>       <td> 1996 </td>       <td> 116 </td>      </tr>      <tr>       <td> 1997 </td>       <td> 137 </td>      </tr>      <tr>       <td> 1998 </td>       <td> 143 </td>      </tr>     </tbody>    </table> a) The aligned data have   represents the 1990,   represents 1993 and so on. The coordinates of the first two points in the scatter plot are   . To find the linear model enter the data in graphing calculator as follows. Use TI – 84 graphing calculator to find the linear regression curve. Enter the table of values first. Step 1 : First press   and select the   option by pressing 1 from the displayed menu. Next, enter the each <i>y</i> value in L1 followed by pressing the enter key and enter the corresponding <i>x </i>value in L2 followed by pressing the enter key. The output will be displayed as shown:     represents the 1990,     <div class=answer> Write the data in the bar graph as tabular form. The table represents the average daily number of inmates. <table style=border-collapse:collapse; border=1>     <tbody>      <tr>       <td> Year </td>       <td> Average daily number of inmates </td>      </tr>      <tr>       <td> 1993 </td>       <td> 96 </td>      </tr>      <tr>       <td> 1994 </td>       <td> 109 </td>      </tr>      <tr>       <td> 1995 </td>       <td> 119 </td>      </tr>      <tr>       <td> 1996 </td>       <td> 116 </td>      </tr>      <tr>       <td> 1997 </td>       <td> 137 </td>      </tr>      <tr>       <td> 1998 </td>       <td> 143 </td>      </tr>     </tbody>    </table> a) The aligned data have   represents the 1990,   represents 1993 and so on. The coordinates of the first two points in the scatter plot are   . To find the linear model enter the data in graphing calculator as follows. Use TI – 84 graphing calculator to find the linear regression curve. Enter the table of values first. Step 1 : First press   and select the   option by pressing 1 from the displayed menu. Next, enter the each <i>y</i> value in L1 followed by pressing the enter key and enter the corresponding <i>x </i>value in L2 followed by pressing the enter key. The output will be displayed as shown:     represents 1993 and so on.

The coordinates of the first two points in the scatter plot are    <div class=answer> Write the data in the bar graph as tabular form. The table represents the average daily number of inmates. <table style=border-collapse:collapse; border=1>     <tbody>      <tr>       <td> Year </td>       <td> Average daily number of inmates </td>      </tr>      <tr>       <td> 1993 </td>       <td> 96 </td>      </tr>      <tr>       <td> 1994 </td>       <td> 109 </td>      </tr>      <tr>       <td> 1995 </td>       <td> 119 </td>      </tr>      <tr>       <td> 1996 </td>       <td> 116 </td>      </tr>      <tr>       <td> 1997 </td>       <td> 137 </td>      </tr>      <tr>       <td> 1998 </td>       <td> 143 </td>      </tr>     </tbody>    </table> a) The aligned data have   represents the 1990,   represents 1993 and so on. The coordinates of the first two points in the scatter plot are   . To find the linear model enter the data in graphing calculator as follows. Use TI – 84 graphing calculator to find the linear regression curve. Enter the table of values first. Step 1 : First press   and select the   option by pressing 1 from the displayed menu. Next, enter the each <i>y</i> value in L1 followed by pressing the enter key and enter the corresponding <i>x </i>value in L2 followed by pressing the enter key. The output will be displayed as shown:     .

To find the linear model enter the data in graphing calculator as follows.

Use TI – 84 graphing calculator to find the linear regression curve.

Enter the table of values first.

Step 1: First press    <div class=answer> Write the data in the bar graph as tabular form. The table represents the average daily number of inmates. <table style=border-collapse:collapse; border=1>     <tbody>      <tr>       <td> Year </td>       <td> Average daily number of inmates </td>      </tr>      <tr>       <td> 1993 </td>       <td> 96 </td>      </tr>      <tr>       <td> 1994 </td>       <td> 109 </td>      </tr>      <tr>       <td> 1995 </td>       <td> 119 </td>      </tr>      <tr>       <td> 1996 </td>       <td> 116 </td>      </tr>      <tr>       <td> 1997 </td>       <td> 137 </td>      </tr>      <tr>       <td> 1998 </td>       <td> 143 </td>      </tr>     </tbody>    </table> a) The aligned data have   represents the 1990,   represents 1993 and so on. The coordinates of the first two points in the scatter plot are   . To find the linear model enter the data in graphing calculator as follows. Use TI – 84 graphing calculator to find the linear regression curve. Enter the table of values first. Step 1 : First press   and select the   option by pressing 1 from the displayed menu. Next, enter the each <i>y</i> value in L1 followed by pressing the enter key and enter the corresponding <i>x </i>value in L2 followed by pressing the enter key. The output will be displayed as shown:     and select the    <div class=answer> Write the data in the bar graph as tabular form. The table represents the average daily number of inmates. <table style=border-collapse:collapse; border=1>     <tbody>      <tr>       <td> Year </td>       <td> Average daily number of inmates </td>      </tr>      <tr>       <td> 1993 </td>       <td> 96 </td>      </tr>      <tr>       <td> 1994 </td>       <td> 109 </td>      </tr>      <tr>       <td> 1995 </td>       <td> 119 </td>      </tr>      <tr>       <td> 1996 </td>       <td> 116 </td>      </tr>      <tr>       <td> 1997 </td>       <td> 137 </td>      </tr>      <tr>       <td> 1998 </td>       <td> 143 </td>      </tr>     </tbody>    </table> a) The aligned data have   represents the 1990,   represents 1993 and so on. The coordinates of the first two points in the scatter plot are   . To find the linear model enter the data in graphing calculator as follows. Use TI – 84 graphing calculator to find the linear regression curve. Enter the table of values first. Step 1 : First press   and select the   option by pressing 1 from the displayed menu. Next, enter the each <i>y</i> value in L1 followed by pressing the enter key and enter the corresponding <i>x </i>value in L2 followed by pressing the enter key. The output will be displayed as shown:     option by pressing 1 from the displayed menu.

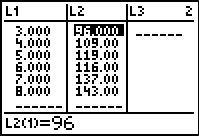
Next, enter the each y value in L1 followed by pressing the enter key and enter the corresponding x value in L2 followed by pressing the enter key.

The output will be displayed as shown:
    <div class=answer> Write the data in the bar graph as tabular form. The table represents the average daily number of inmates. <table style=border-collapse:collapse; border=1>     <tbody>      <tr>       <td> Year </td>       <td> Average daily number of inmates </td>      </tr>      <tr>       <td> 1993 </td>       <td> 96 </td>      </tr>      <tr>       <td> 1994 </td>       <td> 109 </td>      </tr>      <tr>       <td> 1995 </td>       <td> 119 </td>      </tr>      <tr>       <td> 1996 </td>       <td> 116 </td>      </tr>      <tr>       <td> 1997 </td>       <td> 137 </td>      </tr>      <tr>       <td> 1998 </td>       <td> 143 </td>      </tr>     </tbody>    </table> a) The aligned data have   represents the 1990,   represents 1993 and so on. The coordinates of the first two points in the scatter plot are   . To find the linear model enter the data in graphing calculator as follows. Use TI – 84 graphing calculator to find the linear regression curve. Enter the table of values first. Step 1 : First press   and select the   option by pressing 1 from the displayed menu. Next, enter the each <i>y</i> value in L1 followed by pressing the enter key and enter the corresponding <i>x </i>value in L2 followed by pressing the enter key. The output will be displayed as shown:         <div class=answer> Write the data in the bar graph as tabular form. The table represents the average daily number of inmates. <table style=border-collapse:collapse; border=1>     <tbody>      <tr>       <td> Year </td>       <td> Average daily number of inmates </td>      </tr>      <tr>       <td> 1993 </td>       <td> 96 </td>      </tr>      <tr>       <td> 1994 </td>       <td> 109 </td>      </tr>      <tr>       <td> 1995 </td>       <td> 119 </td>      </tr>      <tr>       <td> 1996 </td>       <td> 116 </td>      </tr>      <tr>       <td> 1997 </td>       <td> 137 </td>      </tr>      <tr>       <td> 1998 </td>       <td> 143 </td>      </tr>     </tbody>    </table> a) The aligned data have   represents the 1990,   represents 1993 and so on. The coordinates of the first two points in the scatter plot are   . To find the linear model enter the data in graphing calculator as follows. Use TI – 84 graphing calculator to find the linear regression curve. Enter the table of values first. Step 1 : First press   and select the   option by pressing 1 from the displayed menu. Next, enter the each <i>y</i> value in L1 followed by pressing the enter key and enter the corresponding <i>x </i>value in L2 followed by pressing the enter key. The output will be displayed as shown:

Step 2 of 7


Step 3 of 7


Step 4 of 7


Step 5 of 7


Step 6 of 7


Step 7 of 7

close menu
College Algebra in Context with Applications for the Managerial, Life, and Social Sciences 3rd Edition by Ronald J Harshbarger, Lisa Yocco
cross icon