
College Algebra in Context with Applications for the Managerial, Life, and Social Sciences 3rd Edition by Ronald J Harshbarger, Lisa Yocco
Edition 3ISBN: 032157060XCollege Algebra in Context with Applications for the Managerial, Life, and Social Sciences 3rd Edition by Ronald J Harshbarger, Lisa Yocco
Edition 3ISBN: 032157060XStep 1 of 7
Consider the table. The table gives the number of deaths from 1995-2005.
| Years | 1995 | 1997 | 1999 | 2001 | 2003 | 2005 |
| Number of deaths | 200 | 241 | 398 | 517 | 636 | 467 |
(a)
Let x be the number of years after1995.  Represents the 1995,
  represents 1997and so on.
The coordinates of the first two points in the scatter plot are .
.
To find the linear model enter the data in graphing calculator as follows.
Use TI – 84 graphing calculator to find the linear regression curve.
Enter the table of values first.
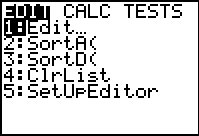
Step 1: First press and select the
 option by pressing 1 from the displayed menu.
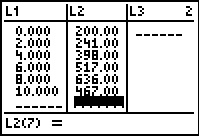
Next, enter the each y value in L1 followed by pressing the enter key and enter the corresponding x value in L2 followed by pressing the enter key.
The output will be displayed as shown:
Step 2 of 7
Step 3 of 7
Step 4 of 7
Step 5 of 7
Step 6 of 7
Step 7 of 7
Why don’t you like this exercise?
Other


