Deck 13: Section 10: Functions of Several Variables
Full screen (f)
Question
The material for constructing the base of an open box costs 1.5 times as much per unit area as the material for constructing the sides. For a fixed amount of money $150.00, find the dimensions of the box of largest volume that can be made.
A)
B)
C)
D)
E)
A)
B)
C)
D)
E)
Question
Find three positive numbers x, y, and z whose sum is 24 and product is a maximum.
A)
B)
C)
D)
E)
A)
B)
C)
D)
E)
Question
Question
Find the least squares regression line for the points shown in the graph. 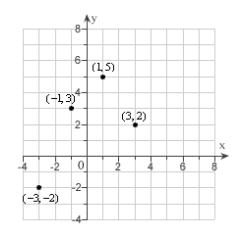
A)
B)
C)
D)
E)
A)
B)
C)
D)
E)
Question
The least squares regression line for the points shown in the graph is  . Calculate S, the sum of the squared errors.
A)
B)
C)
D)
E)
. Calculate S, the sum of the squared errors. A)
B)
C)
D)
E)
Question
Suppose an agronomist used four test plots to determine the relationship between the wheat yield y (in bushels per acre) and the amount of fertilizer x (in hundreds of pounds per acre). The results are shown in the table. Use the regression capabilities of a graphing utility to find the least squares regression line for the data. 
A)
B)
C)
D)
E)
A)
B)
C)
D)
E)
Question
Suppose a store manager wants to know the demand y for an energy bar as a function of price x. The daily sales for three different prices of the energy bar are shown in the table. Use the regression capabilities of a graphing utility to find the least squares regression line for the data. 
A)
B)
C)
D)
E)
A)
B)
C)
D)
E)
Question
Find the least squares regression line for the points  . Round numerical values in your answer to two decimal places.
A)
B)
C)
D)
E)
. Round numerical values in your answer to two decimal places.A)
B)
C)
D)
E)
Question
Find the least squares regression line for the points 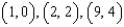 .
.
A)
B)
C)
D)
E)
.A)
B)
C)
D)
E)
Question
A company manufactures two types of sneakers: running shoes and basketball shoes. The total revenue from  units of running shoes and
  units of basketball shoes is:
 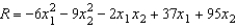 , where
  and
and  are in thousands of units. Find
  and
and  so as to maximize the revenue.
A)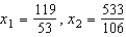
B)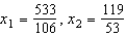
C)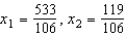
D)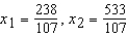
E)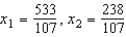
units of running shoes and units of basketball shoes is: , where and are in thousands of units. Find and so as to maximize the revenue.A)
B)
C)
D)
E)
Question
Suppose a corporation manufactures candles at two locations. The cost of producing  units at location 1 is
 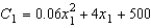 and the cost of producing
  units at location 2 is
 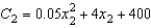 . The candles sell for $43 per unit. Find the quantity that should be produced at each location to maximize the profit
 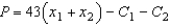 .
.
A)
B)
C)
D)
E)
units at location 1 is and the cost of producing units at location 2 is . The candles sell for $43 per unit. Find the quantity that should be produced at each location to maximize the profit .A)
B)
C)
D)
E)
Question
Find three positive numbers x, y, and z whose sum is 30 and the sum of the squares is a minimum.
A)
B)
C)
D)
E)
A)
B)
C)
D)
E)
Question
Suppose a store manager wants to know the demand y for an energy bar as a function of price x. The daily sales for three different prices of the energy bar are shown in the table. Determine the least squares regression line for the data using the regression capabilities of a graphing utility, and then use this model to estimate the demand when the price is $1.59. 
A) 202
B) 166
C) 190
D) 151
A) 202
B) 166
C) 190
D) 151
Question
Suppose a trough with trapezoidal cross sections is formed by turning up the edges of a 30-inch-wide sheet of aluminum (see figure). Find the cross section of maximum area. 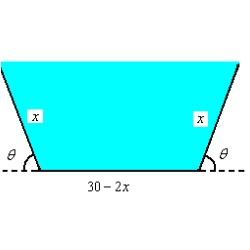
A)
B)
C)
D)
E)
A)
B)
C)
D)
E)
Question
Suppose a home improvement contractor is painting the walls and ceiling of a rectangular room. The volume of the room is 640 cubic feet. The cost of wall paint is $0.076 per square foot and the cost of ceiling paint is $0.19 per square foot. Let x, y, and z be the length, width, and height of a rectangular room respectively. Find the room dimensions that result in a minimum cost for the paint. Round your answers to two decimal places.
A)
B)
C)
D)
E)
A)
B)
C)
D)
E)
Question
Find the minimum distance from the point  to the plane
  .
.
A)
B)
C)
D)
E)
to the plane .A)
B)
C)
D)
E)
Question
Suppose an agronomist used four test plots to determine the relationship between the wheat yield y (in bushels per acre) and the amount of fertilizer x (in hundreds of pounds per acre). The results are shown in the table. Determine the least squares regression line for the data using the regression capabilities of a graphing utility, and then use this model to estimate the yield for a fertilizer application of 160 pounds per acre. Round your answer to one decimal place. 
A) 37.3 bushels per acre
B) 39.7 bushels per acre
C) 35.6 bushels per acre
D) 38.4 bushels per acre
E) 39.3 bushels per acre
A) 37.3 bushels per acre
B) 39.7 bushels per acre
C) 35.6 bushels per acre
D) 38.4 bushels per acre
E) 39.3 bushels per acre
Question
Find the minimum distance from the point  to the surface
  .
.
A)
B)
C)
D)
E)
to the surface .A)
B)
C)
D)
E)

Unlock Deck
Sign up to unlock the cards in this deck!
Unlock Deck
Unlock Deck
1/18
Play
Full screen (f)
Deck 13: Section 10: Functions of Several Variables
1
The material for constructing the base of an open box costs 1.5 times as much per unit area as the material for constructing the sides. For a fixed amount of money $150.00, find the dimensions of the box of largest volume that can be made.
A)
B)
C)
D)
E)
A)
B)
C)
D)
E)
2
Find three positive numbers x, y, and z whose sum is 24 and product is a maximum.
A)
B)
C)
D)
E)
A)
B)
C)
D)
E)
3
Suppose a home improvement contractor is painting the walls and ceiling of a rectangular room. The volume of the room is 360 cubic feet. The cost of wall paint is $0.054 per square foot and the cost of ceiling paint is $0.18 per square foot. Let x, y, and z be the length, width, and height of a rectangular room respectively. Identify the room dimensions that result in a minimum cost for the paint and use these dimensions to find the minimum cost for the paint. Round your answer to the nearest cent.
A) $54.00
B) $8.64
C) $7.00
D) $19.44
E) $21.60
A) $54.00
B) $8.64
C) $7.00
D) $19.44
E) $21.60
$19.44
4
Find the least squares regression line for the points shown in the graph.
A)
B)
C)
D)
E)
A)
B)
C)
D)
E)
Unlock Deck
Unlock for access to all 18 flashcards in this deck.
Unlock Deck
k this deck
5
The least squares regression line for the points shown in the graph is . Calculate S, the sum of the squared errors.
A)
B)
C)
D)
E)
. Calculate S, the sum of the squared errors. A)
B)
C)
D)
E)
Unlock Deck
Unlock for access to all 18 flashcards in this deck.
Unlock Deck
k this deck
6
Suppose an agronomist used four test plots to determine the relationship between the wheat yield y (in bushels per acre) and the amount of fertilizer x (in hundreds of pounds per acre). The results are shown in the table. Use the regression capabilities of a graphing utility to find the least squares regression line for the data.
A)
B)
C)
D)
E)
A)
B)
C)
D)
E)
Unlock Deck
Unlock for access to all 18 flashcards in this deck.
Unlock Deck
k this deck
7
Suppose a store manager wants to know the demand y for an energy bar as a function of price x. The daily sales for three different prices of the energy bar are shown in the table. Use the regression capabilities of a graphing utility to find the least squares regression line for the data.
A)
B)
C)
D)
E)
A)
B)
C)
D)
E)
Unlock Deck
Unlock for access to all 18 flashcards in this deck.
Unlock Deck
k this deck
8
Find the least squares regression line for the points . Round numerical values in your answer to two decimal places.
A)
B)
C)
D)
E)
. Round numerical values in your answer to two decimal places.A)
B)
C)
D)
E)
Unlock Deck
Unlock for access to all 18 flashcards in this deck.
Unlock Deck
k this deck
9
Find the least squares regression line for the points .
A)
B)
C)
D)
E)
.A)
B)
C)
D)
E)
Unlock Deck
Unlock for access to all 18 flashcards in this deck.
Unlock Deck
k this deck
10
A company manufactures two types of sneakers: running shoes and basketball shoes. The total revenue from units of running shoes and units of basketball shoes is: , where and are in thousands of units. Find and so as to maximize the revenue.
A)
B)
C)
D)
E)
units of running shoes and units of basketball shoes is: , where and are in thousands of units. Find and so as to maximize the revenue.A)
B)
C)
D)
E)
Unlock Deck
Unlock for access to all 18 flashcards in this deck.
Unlock Deck
k this deck
11
Suppose a corporation manufactures candles at two locations. The cost of producing units at location 1 is and the cost of producing units at location 2 is . The candles sell for $43 per unit. Find the quantity that should be produced at each location to maximize the profit .
A)
B)
C)
D)
E)
units at location 1 is and the cost of producing units at location 2 is . The candles sell for $43 per unit. Find the quantity that should be produced at each location to maximize the profit .A)
B)
C)
D)
E)
Unlock Deck
Unlock for access to all 18 flashcards in this deck.
Unlock Deck
k this deck
12
Find three positive numbers x, y, and z whose sum is 30 and the sum of the squares is a minimum.
A)
B)
C)
D)
E)
A)
B)
C)
D)
E)
Unlock Deck
Unlock for access to all 18 flashcards in this deck.
Unlock Deck
k this deck
13
Suppose a store manager wants to know the demand y for an energy bar as a function of price x. The daily sales for three different prices of the energy bar are shown in the table. Determine the least squares regression line for the data using the regression capabilities of a graphing utility, and then use this model to estimate the demand when the price is $1.59.
A) 202
B) 166
C) 190
D) 151
A) 202
B) 166
C) 190
D) 151
Unlock Deck
Unlock for access to all 18 flashcards in this deck.
Unlock Deck
k this deck
14
Suppose a trough with trapezoidal cross sections is formed by turning up the edges of a 30-inch-wide sheet of aluminum (see figure). Find the cross section of maximum area.
A)
B)
C)
D)
E)
A)
B)
C)
D)
E)
Unlock Deck
Unlock for access to all 18 flashcards in this deck.
Unlock Deck
k this deck
15
Suppose a home improvement contractor is painting the walls and ceiling of a rectangular room. The volume of the room is 640 cubic feet. The cost of wall paint is $0.076 per square foot and the cost of ceiling paint is $0.19 per square foot. Let x, y, and z be the length, width, and height of a rectangular room respectively. Find the room dimensions that result in a minimum cost for the paint. Round your answers to two decimal places.
A)
B)
C)
D)
E)
A)
B)
C)
D)
E)
Unlock Deck
Unlock for access to all 18 flashcards in this deck.
Unlock Deck
k this deck
16
Find the minimum distance from the point to the plane .
A)
B)
C)
D)
E)
to the plane .A)
B)
C)
D)
E)
Unlock Deck
Unlock for access to all 18 flashcards in this deck.
Unlock Deck
k this deck
17
Suppose an agronomist used four test plots to determine the relationship between the wheat yield y (in bushels per acre) and the amount of fertilizer x (in hundreds of pounds per acre). The results are shown in the table. Determine the least squares regression line for the data using the regression capabilities of a graphing utility, and then use this model to estimate the yield for a fertilizer application of 160 pounds per acre. Round your answer to one decimal place.
A) 37.3 bushels per acre
B) 39.7 bushels per acre
C) 35.6 bushels per acre
D) 38.4 bushels per acre
E) 39.3 bushels per acre
A) 37.3 bushels per acre
B) 39.7 bushels per acre
C) 35.6 bushels per acre
D) 38.4 bushels per acre
E) 39.3 bushels per acre
Unlock Deck
Unlock for access to all 18 flashcards in this deck.
Unlock Deck
k this deck
18
Find the minimum distance from the point to the surface .
A)
B)
C)
D)
E)
to the surface .A)
B)
C)
D)
E)
Unlock Deck
Unlock for access to all 18 flashcards in this deck.
Unlock Deck
k this deck
Unlock Deck
Unlock for access to all 18 flashcards in this deck.


