Deck 34: 1: Sec 341 Mc How Monetary Policy Influences Aggregate Demand
Full screen (f)
Question
Question
Question
Question
Question
Question
Question
Question
Question
Question
Question
Question
Question
Question
Question
Question
Question
Question
Question
Question
Question
Question
Question
Question
Question
Question
Question
Question
Question
Question
Question
Question
Question
Question
Question
Question
Question
Question
Question
Question
Question
Question
Question
Question
Figure 34-1 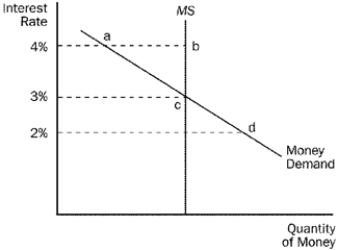
Refer to Figure 34-1.Which of the following is correct?
A)If the interest rate is 4 percent,there is excess money demand,and the interest rate will fall.
B)If the interest rate is 3 percent,there is excess money supply,and the interest rate will rise.
C)Starting with an interest rate of 4 percent,the demand for goods and services will increase until the money market reaches a new equilibrium.
D)None of the above is correct.
Question
Question
Question
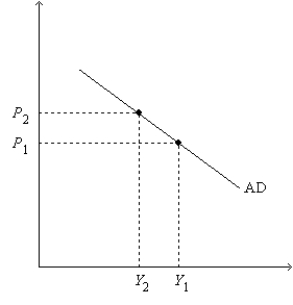
Figure 34-2.On the left-hand graph,MS represents the supply of money and MD represents the demand for money;on the right-hand graph,AD represents aggregate demand.The usual quantities are measured along the axes of both graphs.
.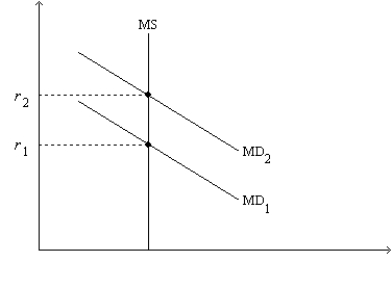
Refer to Figure 34-2.What is measured along the horizontal axis of the left-hand graph?
A)nominal output
B)real output
C)the opportunity cost of holding money
D)the quantity of money
.
Refer to Figure 34-2.What is measured along the horizontal axis of the left-hand graph?
A)nominal output
B)real output
C)the opportunity cost of holding money
D)the quantity of money
Question
Figure 34-2.On the left-hand graph,MS represents the supply of money and MD represents the demand for money;on the right-hand graph,AD represents aggregate demand.The usual quantities are measured along the axes of both graphs.
.
Refer to Figure 34-2.What does Y represent on the horizontal axis of the right-hand graph?
A)the quantity of money
B)the rate of inflation
C)real output
D)nominal output
.
Refer to Figure 34-2.What does Y represent on the horizontal axis of the right-hand graph?
A)the quantity of money
B)the rate of inflation
C)real output
D)nominal output
Question
Question
Question
Question
Question
Question
Question
Question
Figure 34-1
Refer to Figure 34-1.If the current interest rate is 2 percent,
A)there is an excess supply of money.
B)people will sell more bonds,which drives interest rates up.
C)as the money market moves to equilibrium,people will buy more goods.
D)All of the above are correct.
Refer to Figure 34-1.If the current interest rate is 2 percent,
A)there is an excess supply of money.
B)people will sell more bonds,which drives interest rates up.
C)as the money market moves to equilibrium,people will buy more goods.
D)All of the above are correct.
Question
Question
Question
Figure 34-1
Refer to Figure 34-1.There is an excess demand for money at an interest rate of
A)2 percent.
B)3 percent.
C)4 percent.
D)None of the above is correct.
Refer to Figure 34-1.There is an excess demand for money at an interest rate of
A)2 percent.
B)3 percent.
C)4 percent.
D)None of the above is correct.
Question
Question
Figure 34-2.On the left-hand graph,MS represents the supply of money and MD represents the demand for money;on the right-hand graph,AD represents aggregate demand.The usual quantities are measured along the axes of both graphs.
.
Refer to Figure 34-2.As we move from one point to another along the money-demand curve MD1,
A)the price level is held fixed at P1.
B)the interest rate is held fixed at r1.
C)the money supply is changing so as to keep the money market in equilibrium.
D)the expected inflation rate is changing so as to keep the real interest rate constant.
Question
Figure 34-3. 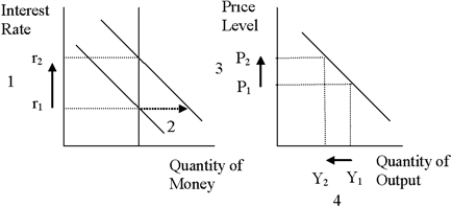
Refer to Figure 34-3.What quantity is represented by the downward-sloping line on the left-hand graph?
A)the supply of money
B)the demand for money
C)the rate of inflation
D)Aggregate Demand.
Refer to Figure 34-3.What quantity is represented by the downward-sloping line on the left-hand graph?
A)the supply of money
B)the demand for money
C)the rate of inflation
D)Aggregate Demand.
Question
Question
Figure 34-2.On the left-hand graph,MS represents the supply of money and MD represents the demand for money;on the right-hand graph,AD represents aggregate demand.The usual quantities are measured along the axes of both graphs.
.
Refer to Figure 34-2.If the money-supply curve MS on the left-hand graph were to shift to the left,this would
A)represent an action taken by the Federal Reserve.
B)shift the AD curve to the left.
C)create,until the interest rate adjusted,an excess demand for money at the interest rate that equilibrated the money market before the shift.
D)All of the above are correct.
Question
Figure 34-3.
Refer to Figure 34-3.For an economy such as the United States,what component of the demand for goods and services is most responsible for the decrease in output from Y1 to Y2?
A)consumption
B)investment
C)net exports
D)government spending
Refer to Figure 34-3.For an economy such as the United States,what component of the demand for goods and services is most responsible for the decrease in output from Y1 to Y2?
A)consumption
B)investment
C)net exports
D)government spending
Question
Figure 34-2.On the left-hand graph,MS represents the supply of money and MD represents the demand for money;on the right-hand graph,AD represents aggregate demand.The usual quantities are measured along the axes of both graphs.
.
Refer to Figure 34-2.Assume the money market is always in equilibrium,and suppose r1 = 0.08;r2 = 0.12;Y1 = 13,000;Y2 = 10,000;P1 = 1.0;and P2 = 1.2.Which of the following statements is correct? When P = P2,
A)investment is lower than it is when P = P1.
B)nominal output is higher than it is when P = P1.
C)the expected rate of inflation is higher than it is when P = P1.
D)the velocity of money is higher than it is when P = P1.
Question
Figure 34-2.On the left-hand graph,MS represents the supply of money and MD represents the demand for money;on the right-hand graph,AD represents aggregate demand.The usual quantities are measured along the axes of both graphs.
.
Refer to Figure 34-2.Which of the following quantities is held constant as we move from one point to another on either graph?
A)the nominal interest rate
B)the quantity of money demanded
C)investment
D)the expected rate of inflation
.
Refer to Figure 34-2.Which of the following quantities is held constant as we move from one point to another on either graph?
A)the nominal interest rate
B)the quantity of money demanded
C)investment
D)the expected rate of inflation
Question
Figure 34-3.
Refer to Figure 34-3.Which of the following sequences (numbered arrows)shows the logic of the interest-rate effect?
A)1,2,3,4
B)1,4,3,2
C)3,4,2,1
D)3,2,1,4
Refer to Figure 34-3.Which of the following sequences (numbered arrows)shows the logic of the interest-rate effect?
A)1,2,3,4
B)1,4,3,2
C)3,4,2,1
D)3,2,1,4
Question
Figure 34-2.On the left-hand graph,MS represents the supply of money and MD represents the demand for money;on the right-hand graph,AD represents aggregate demand.The usual quantities are measured along the axes of both graphs.
.
Refer to Figure 34-2.Assume the money market is always in equilibrium,and suppose r1 = 0.08;r2 = 0.12;Y1 = 13,000;Y2 = 10,000;P1 = 1.0;and P2 = 1.2.Which of the following statements is correct?
A)When r = r2,nominal output is higher than it is when r = r1.
B)When r = r2,real output is higher than it is when r = r1.
C)When r = r2,the expected rate of inflation is higher than it is when r = r1.
D)If the velocity of money is 4 when r = r2,then the quantity of money is $3,000.
Question
Question
Question
Question
Question
Figure 34-2.On the left-hand graph,MS represents the supply of money and MD represents the demand for money;on the right-hand graph,AD represents aggregate demand.The usual quantities are measured along the axes of both graphs.
.
Refer to Figure 34-2.If the graphs apply to an economy such as the U.S.economy,then the slope of the AD curve is primarily attributable to the
A)wealth effect.
B)interest-rate effect.
C)exchange-rate effect.
D)Fisher effect.
.
Refer to Figure 34-2.If the graphs apply to an economy such as the U.S.economy,then the slope of the AD curve is primarily attributable to the
A)wealth effect.
B)interest-rate effect.
C)exchange-rate effect.
D)Fisher effect.
Question
Figure 34-2.On the left-hand graph,MS represents the supply of money and MD represents the demand for money;on the right-hand graph,AD represents aggregate demand.The usual quantities are measured along the axes of both graphs.
.
Refer to Figure 34-2.Assume the money market is always in equilibrium.Under the assumptions of the model,
A)the quantity of goods and services demanded is higher at P2 than it is at P1.
B)the quantity of money is higher at Y1 than it is at Y2.
C)an increase in r from r1 to r2 is associated with a decrease in Y from Y1 to Y2.
D)All of the above are correct.
Question
Figure 34-2.On the left-hand graph,MS represents the supply of money and MD represents the demand for money;on the right-hand graph,AD represents aggregate demand.The usual quantities are measured along the axes of both graphs.
.
Refer to Figure 34-2.Assume the money market is always in equilibrium.Under the assumptions of the model,
A)the real interest rate is lower at Y2 than it is at Y1.
B)the quantity of money is the same at Y1 as it is at Y2.
C)the price level is lower at r2 than it is at r1.
D)All of the above are correct.
Question
Question
Question
Question
Figure 34-2.On the left-hand graph,MS represents the supply of money and MD represents the demand for money;on the right-hand graph,AD represents aggregate demand.The usual quantities are measured along the axes of both graphs.
.
Refer to Figure 34-2.A decrease in Y from Y1 to Y2 is explained as follows:
A)The Federal Reserve increases the money supply,causing the money-demand curve to shift from MD1 to MD2;this shift of MD causes r to increase from r1 to r2;and this increase in r causes Y to decrease from Y1 to Y2.
B)An increase in P from P1 to P2 causes the money-demand curve to shift from MD1 to MD2;this shift of MD causes r to increase from r1 to r2;and this increase in r causes Y to decrease from Y1 to Y2.
C)A decrease in P from P2 to P1 causes the money-demand curve to shift from MD1 to MD2;this shift of MD causes r to increase from r1 to r2;and this increase in r causes Y to decrease from Y1 to Y2.
D)An increase in the price level causes the money-demand curve to shift from MD2 to MD1;this shift of MD causes r to decrease from r2 to r1;and this decrease in r causes Y to decrease from Y1 to Y2.

Unlock Deck
Sign up to unlock the cards in this deck!
Unlock Deck
Unlock Deck
1/198
Play
Full screen (f)
Deck 34: 1: Sec 341 Mc How Monetary Policy Influences Aggregate Demand
1
According to the theory of liquidity preference,
A)if the interest rate is below the equilibrium level,then the quantity of money people want to hold is less than the quantity of money the Fed has created.
B)if the interest rate is above the equilibrium level,then the quantity of money people want to hold is greater than the quantity of money the Fed has created.
C)the demand for money is represented by a downward-sloping line on a supply-and-demand graph.
D)All of the above are correct.
A
2
Which of the following claims concerning the importance of effects that explain the slope of the U.S.aggregate-demand curve is correct?
A)The exchange-rate effect is relatively small because exports and imports are a small part of real GDP.
B)The interest-rate effect is relatively small because investment spending is not very responsive to interest rate changes.
C)The wealth effect is relatively large because money holdings are a significant portion of most households' wealth.
D)None of the above is correct.
D
3
On the graph that depicts the theory of liquidity preference,
A)the demand-for-money curve is vertical.
B)the supply-of-money curve is vertical.
C)the interest rate is measured along the horizontal axis.
D)the price level is measured along the vertical axis.
A)the demand-for-money curve is vertical.
B)the supply-of-money curve is vertical.
C)the interest rate is measured along the horizontal axis.
D)the price level is measured along the vertical axis.
A
4
The wealth effect stems from the idea that a higher price level
A)increases the real value of households' money holdings.
B)decreases the real value of households' money holdings.
C)increases the real value of the domestic currency in foreign-exchange markets.
D)decreases the real value of the domestic currency in foreign-exchange markets.
A)increases the real value of households' money holdings.
B)decreases the real value of households' money holdings.
C)increases the real value of the domestic currency in foreign-exchange markets.
D)decreases the real value of the domestic currency in foreign-exchange markets.
Unlock Deck
Unlock for access to all 198 flashcards in this deck.
Unlock Deck
k this deck
5
Using the liquidity-preference model,when the Federal Reserve decreases the money supply,
A)the equilibrium interest rate increases.
B)the aggregate-demand curve shifts to the right.
C)the quantity of goods and services demanded is unchanged for a given price level.
D)the short-run aggregate-supply curve shifts to the left.
A)the equilibrium interest rate increases.
B)the aggregate-demand curve shifts to the right.
C)the quantity of goods and services demanded is unchanged for a given price level.
D)the short-run aggregate-supply curve shifts to the left.
Unlock Deck
Unlock for access to all 198 flashcards in this deck.
Unlock Deck
k this deck
6
For the U.S.economy,which of the following helps explain the slope of the aggregate-demand curve?
A)An increase in the price level decreases the interest rate.
B)An increase in the price level increases the interest rate.
C)An increase in the money supply decreases the interest rate.
D)An increase in the money supply increases the interest rate.
A)An increase in the price level decreases the interest rate.
B)An increase in the price level increases the interest rate.
C)An increase in the money supply decreases the interest rate.
D)An increase in the money supply increases the interest rate.
Unlock Deck
Unlock for access to all 198 flashcards in this deck.
Unlock Deck
k this deck
7
The idea that a decrease in the price level raises the real value of households' money holdings,which increases consumer spending and the quantity of goods and services demanded is known as
A)the interest-rate effect.
B)the exchange-rate effect.
C)the theory of liquidity preference.
D)the wealth effect.
A)the interest-rate effect.
B)the exchange-rate effect.
C)the theory of liquidity preference.
D)the wealth effect.
Unlock Deck
Unlock for access to all 198 flashcards in this deck.
Unlock Deck
k this deck
8
According to John Maynard Keynes,
A)the demand for money in a country is determined entirely by that nation's central bank.
B)the supply of money in a country is determined by the overall wealth of the citizens of that country.
C)the interest rate adjusts to balance the supply of,and demand for,money.
D)the interest rate adjusts to balance the supply of,and demand for,goods and services.
Unlock Deck
Unlock for access to all 198 flashcards in this deck.
Unlock Deck
k this deck
9
The interest-rate effect
A)depends on the idea that increases in interest rates increase the quantity of money demanded.
B)depends on the idea that increases in interest rates increase the quantity of money supplied.
C)is the most important reason,in the case of the United States,for the downward slope of the aggregate-demand curve.
D)is the least important reason,in the case of the United States,for the downward slope of the aggregate-demand curve.
Unlock Deck
Unlock for access to all 198 flashcards in this deck.
Unlock Deck
k this deck
10
With respect to their impact on aggregate demand for the U.S.economy,which of the following represents the correct ordering of the wealth effect,interest-rate effect,and exchange-rate effect from most important to least important?
A)wealth effect,exchange-rate effect,interest-rate effect
B)exchange-rate effect,interest-rate effect,wealth effect
C)interest-rate effect,wealth effect,exchange-rate effect
D)interest-rate effect,exchange-rate effect,wealth effect
A)wealth effect,exchange-rate effect,interest-rate effect
B)exchange-rate effect,interest-rate effect,wealth effect
C)interest-rate effect,wealth effect,exchange-rate effect
D)interest-rate effect,exchange-rate effect,wealth effect
Unlock Deck
Unlock for access to all 198 flashcards in this deck.
Unlock Deck
k this deck
11
For the U.S.economy,which of the following is the most important reason for the downward slope of the aggregate-demand curve?
A)the wealth effect
B)the interest-rate effect
C)the exchange-rate effect
D)the real-wage effect
A)the wealth effect
B)the interest-rate effect
C)the exchange-rate effect
D)the real-wage effect
Unlock Deck
Unlock for access to all 198 flashcards in this deck.
Unlock Deck
k this deck
12
The wealth effect helps explain the slope of the aggregate-demand curve.This effect is
A)relatively important in the United States because expenditures on consumer durables is very responsive to changes in wealth.
B)relatively important in the United States because consumption spending is a large part of GDP.
C)relatively unimportant in the United States because money holdings are a small part of consumer wealth.
D)relatively unimportant because it takes a large change in wealth to cause a significant change in interest rates.
Unlock Deck
Unlock for access to all 198 flashcards in this deck.
Unlock Deck
k this deck
13
Which particular interest rate(s)do we attempt to explain using the theory of liquidity preference?
A)only the nominal interest rate
B)both the nominal interest rate and the real interest rate
C)only the interest rate on long-term bonds
D)only the interest rate on short-term government bonds
A)only the nominal interest rate
B)both the nominal interest rate and the real interest rate
C)only the interest rate on long-term bonds
D)only the interest rate on short-term government bonds
Unlock Deck
Unlock for access to all 198 flashcards in this deck.
Unlock Deck
k this deck
14
In recent years,the Federal Reserve has conducted policy by setting a target for the
A)size of the money supply.
B)growth rate of the money supply.
C)federal funds rate.
D)discount rate.
A)size of the money supply.
B)growth rate of the money supply.
C)federal funds rate.
D)discount rate.
Unlock Deck
Unlock for access to all 198 flashcards in this deck.
Unlock Deck
k this deck
15
According to the liquidity preference theory,an increase in the overall price level of 10 percent
A)increases the equilibrium interest rate,which in turn decreases the quantity of goods and services demanded.
B)decreases the equilibrium interest rate,which in turn increases the quantity of goods and services demanded.
C)increases the quantity of money supplied by 10 percent,leaving the interest rate and the quantity of goods and services demanded unchanged.
D)decreases the quantity of money demanded by 10 percent,leaving the interest rate and the quantity of goods and services demanded unchanged.
Unlock Deck
Unlock for access to all 198 flashcards in this deck.
Unlock Deck
k this deck
16
According to classical macroeconomic theory,
A)the price level is sticky in the short run and it plays only a minor role in the short-run adjustment process.
B)for any given level of output,the interest rate adjusts to balance the supply of,and demand for,money.
C)output is determined by the supplies of capital and labor and the available production technology.
D)All of the above are correct.
Unlock Deck
Unlock for access to all 198 flashcards in this deck.
Unlock Deck
k this deck
17
The interest-rate effect
A)depends on the idea that decreases in interest rates increase the quantity of goods and services demanded.
B)depends on the idea that decreases in interest rates decrease the quantity of goods and services demanded.
C)is responsible for the downward slope of the money-demand curve.
D)is the least important reason,in the case of the United States,for the downward slope of the aggregate-demand curve.
Unlock Deck
Unlock for access to all 198 flashcards in this deck.
Unlock Deck
k this deck
18
According to classical macroeconomic theory,
A)output is determined by the supplies of capital and labor and the available production technology.
B)for any given level of output,the interest rate adjusts to balance the supply of,and demand for,loanable funds.
C)given output and the interest rate,the price level adjusts to balance the supply of,and demand for,money.
D)All of the above are correct.
Unlock Deck
Unlock for access to all 198 flashcards in this deck.
Unlock Deck
k this deck
19
While a television news reporter might state that "Today the Fed raised the federal funds rate from 1 percent to 1.25 percent," a more precise account of the Fed's action would be as follows:
A)"Today the Fed told its bond traders to conduct open-market operations in such a way that the equilibrium federal funds rate would increase to 1.25 percent."
B)"Today the Fed raised the discount rate by a quarter of a percentage point,and this action will force the federal funds rate to rise by the same amount."
C)"Today the Fed took steps to increase the money supply by an amount that is sufficient to increase the federal funds rate to 1.25 percent."
D)"Today the Fed took a step toward expanding aggregate demand,and this was done by raising the federal funds rate to 1.25 percent."
Unlock Deck
Unlock for access to all 198 flashcards in this deck.
Unlock Deck
k this deck
20
Which of the following is likely more important for explaining the slope of the aggregate-demand curve of a small economy than it is for the United States?
A)the wealth effect
B)the interest-rate effect
C)the exchange-rate effect
D)the real-wage effect
A)the wealth effect
B)the interest-rate effect
C)the exchange-rate effect
D)the real-wage effect
Unlock Deck
Unlock for access to all 198 flashcards in this deck.
Unlock Deck
k this deck
21
Liquidity preference refers directly to Keynes' theory concerning
A)the effects of changes in money demand and supply on interest rates.
B)the effects of changes in money demand and supply on exchange rates.
C)the effects of wealth on expenditures.
D)the difference between temporary and permanent changes in income.
A)the effects of changes in money demand and supply on interest rates.
B)the effects of changes in money demand and supply on exchange rates.
C)the effects of wealth on expenditures.
D)the difference between temporary and permanent changes in income.
Unlock Deck
Unlock for access to all 198 flashcards in this deck.
Unlock Deck
k this deck
22
In the graph of the money market,the money supply curve is
A)vertical.It shifts rightward if the Fed buys bonds.
B)vertical.It shifts rightward if the Fed sells bonds.
C)upward sloping.It shifts rightward if the Fed buys bonds.
D)upward sloping.It shifts rightward if the Fed sells bonds.
A)vertical.It shifts rightward if the Fed buys bonds.
B)vertical.It shifts rightward if the Fed sells bonds.
C)upward sloping.It shifts rightward if the Fed buys bonds.
D)upward sloping.It shifts rightward if the Fed sells bonds.
Unlock Deck
Unlock for access to all 198 flashcards in this deck.
Unlock Deck
k this deck
23
According to liquidity preference theory,the money-supply curve is
A)upward sloping.
B)downward sloping.
C)vertical.
D)horizontal.
A)upward sloping.
B)downward sloping.
C)vertical.
D)horizontal.
Unlock Deck
Unlock for access to all 198 flashcards in this deck.
Unlock Deck
k this deck
24
According to liquidity preference theory,the money-supply curve would shift if the Fed
A)engaged in open-market operations.
B)increased money demand.
C)increased the real income.
D)did any of the above.
A)engaged in open-market operations.
B)increased money demand.
C)increased the real income.
D)did any of the above.
Unlock Deck
Unlock for access to all 198 flashcards in this deck.
Unlock Deck
k this deck
25
Liquidity preference theory is most relevant to the
A)short run and supposes that the price level adjusts to bring money supply and money demand into balance.
B)short run and supposes that the interest rate adjusts to bring money supply and money demand into balance.
C)long run and supposes that the price level adjusts to bring money supply and money demand into balance.
D)long run and supposes that the interest rate adjusts to bring money supply and money demand into balance.
Unlock Deck
Unlock for access to all 198 flashcards in this deck.
Unlock Deck
k this deck
26
The theory of liquidity preference assumes that the nominal supply of money is determined by the
A)level of real output only.
B)interest rate only.
C)level of real output and by the interest rate.
D)Federal Reserve.
A)level of real output only.
B)interest rate only.
C)level of real output and by the interest rate.
D)Federal Reserve.
Unlock Deck
Unlock for access to all 198 flashcards in this deck.
Unlock Deck
k this deck
27
Which of the following would not be an expected response from a decrease in the price level and so help to explain the slope of the aggregate-demand curve?
A)When interest rates fall,In-and-Out Convenience Stores decides to build some new stores.
B)The exchange rate falls,so French restaurants in Paris buy more Kansas beef.
C)Tyler feels wealthier because of the price-level decrease and so he decides to remodel his kitchen.
D)With prices down and wages fixed by contract,Fargo Concrete Company decides to lay off workers.
Unlock Deck
Unlock for access to all 198 flashcards in this deck.
Unlock Deck
k this deck
28
Which of the following is not a reason the aggregate-demand curve slopes downward? As the price level increases,
A)firms may believe the relative price of their output has risen.
B)real wealth declines.
C)the interest rate increases.
D)the exchange rate increases.
A)firms may believe the relative price of their output has risen.
B)real wealth declines.
C)the interest rate increases.
D)the exchange rate increases.
Unlock Deck
Unlock for access to all 198 flashcards in this deck.
Unlock Deck
k this deck
29
According to the theory of liquidity preference,money demand
A)and the money supply are positively related to the interest rate.
B)and the money supply are negatively related to the interest rate.
C)is negatively related to the interest rate,while the money supply is independent of the interest rate.
D)is independent of the interest rate,while money supply is negatively related to the interest rate.
Unlock Deck
Unlock for access to all 198 flashcards in this deck.
Unlock Deck
k this deck
30
If expected inflation is constant,then when the nominal interest rate increases,the real interest rate
A)increases by more than the change in the nominal interest rate.
B)increases by the change in the nominal interest rate.
C)decreases by the change in the nominal interest rate.
D)decreases by more than the change in the nominal interest rate.
A)increases by more than the change in the nominal interest rate.
B)increases by the change in the nominal interest rate.
C)decreases by the change in the nominal interest rate.
D)decreases by more than the change in the nominal interest rate.
Unlock Deck
Unlock for access to all 198 flashcards in this deck.
Unlock Deck
k this deck
31
If expected inflation is constant and the nominal interest rate decreases by 2 percentage points,then the real interest rate
A)increases by 2 percentage points.
B)increases,but by less than 2 percentage points.
C)decreases,but by less than 2 percentage points.
D)decreases by 2 percentage points.
A)increases by 2 percentage points.
B)increases,but by less than 2 percentage points.
C)decreases,but by less than 2 percentage points.
D)decreases by 2 percentage points.
Unlock Deck
Unlock for access to all 198 flashcards in this deck.
Unlock Deck
k this deck
32
If expected inflation is constant,then when the nominal interest rate falls,the real interest rate
A)falls by more than the change in the nominal interest rate.
B)falls by the change in the nominal interest rate.
C)rises by the change in the nominal interest rate.
D)rises by more than the change in the nominal interest rate.
A)falls by more than the change in the nominal interest rate.
B)falls by the change in the nominal interest rate.
C)rises by the change in the nominal interest rate.
D)rises by more than the change in the nominal interest rate.
Unlock Deck
Unlock for access to all 198 flashcards in this deck.
Unlock Deck
k this deck
33
When the Fed buys government bonds,the reserves of the banking system
A)increase,so the money supply increases.
B)increase,so the money supply decreases.
C)decrease,so the money supply increases.
D)decrease,so the money supply decreases.
A)increase,so the money supply increases.
B)increase,so the money supply decreases.
C)decrease,so the money supply increases.
D)decrease,so the money supply decreases.
Unlock Deck
Unlock for access to all 198 flashcards in this deck.
Unlock Deck
k this deck
34
The theory of liquidity preference is most helpful in understanding
A)the wealth effect.
B)the exchange-rate effect.
C)the interest-rate effect.
D)misperceptions theory.
A)the wealth effect.
B)the exchange-rate effect.
C)the interest-rate effect.
D)misperceptions theory.
Unlock Deck
Unlock for access to all 198 flashcards in this deck.
Unlock Deck
k this deck
35
Monetary policy
A)must be described in terms of interest-rate targets.
B)must be described in terms of money-supply targets.
C)can be described either in terms of the money supply or in terms of the interest rate.
D)cannot be accurately described in terms of the interest rate or in terms of the money supply.
A)must be described in terms of interest-rate targets.
B)must be described in terms of money-supply targets.
C)can be described either in terms of the money supply or in terms of the interest rate.
D)cannot be accurately described in terms of the interest rate or in terms of the money supply.
Unlock Deck
Unlock for access to all 198 flashcards in this deck.
Unlock Deck
k this deck
36
Which of the following Fed actions would both decrease the money supply?
A)buy bonds and raise the reserve requirement
B)buy bonds and lower the reserve requirement
C)sell bonds and raise the reserve requirement
D)sell bonds and lower the reserve requirement
A)buy bonds and raise the reserve requirement
B)buy bonds and lower the reserve requirement
C)sell bonds and raise the reserve requirement
D)sell bonds and lower the reserve requirement
Unlock Deck
Unlock for access to all 198 flashcards in this deck.
Unlock Deck
k this deck
37
When the Fed sells government bonds,the reserves of the banking system
A)increase,so the money supply increases.
B)increase,so the money supply decreases.
C)decrease,so the money supply increases.
D)decrease,so the money supply decreases.
A)increase,so the money supply increases.
B)increase,so the money supply decreases.
C)decrease,so the money supply increases.
D)decrease,so the money supply decreases.
Unlock Deck
Unlock for access to all 198 flashcards in this deck.
Unlock Deck
k this deck
38
According to liquidity preference theory,the money-supply curve would shift rightward
A)if the money demand curve shifted right.
B)if the Federal Reserve chose to increase the money supply.
C)if the interest rate increased.
D)All of the above are correct.
A)if the money demand curve shifted right.
B)if the Federal Reserve chose to increase the money supply.
C)if the interest rate increased.
D)All of the above are correct.
Unlock Deck
Unlock for access to all 198 flashcards in this deck.
Unlock Deck
k this deck
39
According to liquidity preference theory,equilibrium in the money market is achieved by adjustments in
A)the price level.
B)the interest rate.
C)the exchange rate.
D)real wealth.
A)the price level.
B)the interest rate.
C)the exchange rate.
D)real wealth.
Unlock Deck
Unlock for access to all 198 flashcards in this deck.
Unlock Deck
k this deck
40
People choose to hold a larger quantity of money if
A)the interest rate rises,which causes the opportunity cost of holding money to rise.
B)the interest rate falls,which causes the opportunity cost of holding money to rise.
C)the interest rate rises,which causes the opportunity cost of holding money to fall.
D)the interest rate falls,which causes the opportunity cost of holding money to fall.
Unlock Deck
Unlock for access to all 198 flashcards in this deck.
Unlock Deck
k this deck
41
The opportunity cost of holding money
A)decreases when the interest rate decreases,so people desire to hold more of it.
B)decreases when the interest rate decreases,so people desire to hold less of it.
C)increases when the interest rate decreases,so people desire to hold more of it.
D)increases when the interest rate decreases,so people desire to hold less of it.
Unlock Deck
Unlock for access to all 198 flashcards in this deck.
Unlock Deck
k this deck
42
Liquidity refers to
A)the relation between the price and interest rate of an asset.
B)the risk of an asset relative to its selling price.
C)the ease with which an asset is converted into a medium of exchange.
D)the sensitivity of investment spending to changes in the interest rate.
A)the relation between the price and interest rate of an asset.
B)the risk of an asset relative to its selling price.
C)the ease with which an asset is converted into a medium of exchange.
D)the sensitivity of investment spending to changes in the interest rate.
Unlock Deck
Unlock for access to all 198 flashcards in this deck.
Unlock Deck
k this deck
43
When the interest rate increases,the opportunity cost of holding money
A)increases,so the quantity of money demanded increases.
B)increases,so the quantity of money demanded decreases.
C)decreases,so the quantity of money demanded increases.
D)decreases,so the quantity of money demanded decreases.
A)increases,so the quantity of money demanded increases.
B)increases,so the quantity of money demanded decreases.
C)decreases,so the quantity of money demanded increases.
D)decreases,so the quantity of money demanded decreases.
Unlock Deck
Unlock for access to all 198 flashcards in this deck.
Unlock Deck
k this deck
44
Figure 34-1
Refer to Figure 34-1.Which of the following is correct?
A)If the interest rate is 4 percent,there is excess money demand,and the interest rate will fall.
B)If the interest rate is 3 percent,there is excess money supply,and the interest rate will rise.
C)Starting with an interest rate of 4 percent,the demand for goods and services will increase until the money market reaches a new equilibrium.
D)None of the above is correct.
Unlock Deck
Unlock for access to all 198 flashcards in this deck.
Unlock Deck
k this deck
45
According to liquidity preference theory,the opportunity cost of holding money is
A)the interest rate on bonds.
B)the inflation rate.
C)the cost of converting bonds to a medium of exchange.
D)the difference between the inflation rate and the interest rate on bonds.
A)the interest rate on bonds.
B)the inflation rate.
C)the cost of converting bonds to a medium of exchange.
D)the difference between the inflation rate and the interest rate on bonds.
Unlock Deck
Unlock for access to all 198 flashcards in this deck.
Unlock Deck
k this deck
46
According to liquidity preference theory,the slope of the money demand curve is explained as follows:
A)Interest rates rise as the Fed reduces the quantity of money demanded.
B)Interest rates fall as the Fed reduces the supply of money.
C)People will want to hold less money as the cost of holding it falls.
D)People will want to hold more money as the cost of holding it falls.
A)Interest rates rise as the Fed reduces the quantity of money demanded.
B)Interest rates fall as the Fed reduces the supply of money.
C)People will want to hold less money as the cost of holding it falls.
D)People will want to hold more money as the cost of holding it falls.
Unlock Deck
Unlock for access to all 198 flashcards in this deck.
Unlock Deck
k this deck
47
Figure 34-2.On the left-hand graph,MS represents the supply of money and MD represents the demand for money;on the right-hand graph,AD represents aggregate demand.The usual quantities are measured along the axes of both graphs.
.
Refer to Figure 34-2.What is measured along the horizontal axis of the left-hand graph?
A)nominal output
B)real output
C)the opportunity cost of holding money
D)the quantity of money
.
Refer to Figure 34-2.What is measured along the horizontal axis of the left-hand graph?
A)nominal output
B)real output
C)the opportunity cost of holding money
D)the quantity of money
Unlock Deck
Unlock for access to all 198 flashcards in this deck.
Unlock Deck
k this deck
48
Figure 34-2.On the left-hand graph,MS represents the supply of money and MD represents the demand for money;on the right-hand graph,AD represents aggregate demand.The usual quantities are measured along the axes of both graphs.
.
Refer to Figure 34-2.What does Y represent on the horizontal axis of the right-hand graph?
A)the quantity of money
B)the rate of inflation
C)real output
D)nominal output
.
Refer to Figure 34-2.What does Y represent on the horizontal axis of the right-hand graph?
A)the quantity of money
B)the rate of inflation
C)real output
D)nominal output
Unlock Deck
Unlock for access to all 198 flashcards in this deck.
Unlock Deck
k this deck
49
In which of the following cases would the quantity of money demanded be largest?
A)r = 0.03,P = 1.2
B)r = 0.03,P = 1.3
C)r = 0.04,P = 1.2
D)r = 0.05,P = 0.9
A)r = 0.03,P = 1.2
B)r = 0.03,P = 1.3
C)r = 0.04,P = 1.2
D)r = 0.05,P = 0.9
Unlock Deck
Unlock for access to all 198 flashcards in this deck.
Unlock Deck
k this deck
50
According to liquidity preference theory,a decrease in money demand for some reason other than a change in the price level causes
A)the interest rate to fall,so aggregate demand shifts right.
B)the interest rate to fall,so aggregate demand shifts left.
C)the interest rate to rise,so aggregate demand shifts right.
D)the interest rate to rise,so aggregate demand shifts left.
A)the interest rate to fall,so aggregate demand shifts right.
B)the interest rate to fall,so aggregate demand shifts left.
C)the interest rate to rise,so aggregate demand shifts right.
D)the interest rate to rise,so aggregate demand shifts left.
Unlock Deck
Unlock for access to all 198 flashcards in this deck.
Unlock Deck
k this deck
51
When the interest rate decreases,the opportunity cost of holding money
A)increases,so the quantity of money demanded increases.
B)increases,so the quantity of money demanded decreases.
C)decreases,so the quantity of money demanded increases.
D)decreases,so the quantity of money demanded decreases.
A)increases,so the quantity of money demanded increases.
B)increases,so the quantity of money demanded decreases.
C)decreases,so the quantity of money demanded increases.
D)decreases,so the quantity of money demanded decreases.
Unlock Deck
Unlock for access to all 198 flashcards in this deck.
Unlock Deck
k this deck
52
According to liquidity preference theory,
A)an increase in the interest rate reduces the quantity of money demanded.This is shown as a movement along the money-demand curve.An increase in the price level shifts money demand to the right.
B)an increase in the interest rate increases the quantity of money demanded.This is shown as a movement along the money-demand curve.An increase in the price level shifts money demand leftward.
C)an increase in the price level reduces the quantity of money demanded.This is shown as a movement along the money-demand curve.An increase in the interest rate shifts money demand rightward.
D)an increase in the price level increases the quantity of money demanded.This is shown as a movement along the money-demand curve.An increase in the interest rate shifts money demand leftward.
Unlock Deck
Unlock for access to all 198 flashcards in this deck.
Unlock Deck
k this deck
53
In which of the following cases would the quantity of money demanded be smallest?
A)r = 0.06,P = 1.2
B)r = 0.05,P = 1.0
C)r = 0.04,P = 1.2
D)r = 0.06,P = 1.0
A)r = 0.06,P = 1.2
B)r = 0.05,P = 1.0
C)r = 0.04,P = 1.2
D)r = 0.06,P = 1.0
Unlock Deck
Unlock for access to all 198 flashcards in this deck.
Unlock Deck
k this deck
54
People hold money primarily because it
A)increases in value when there is inflation.
B)serves as a store of value.
C)serves as a medium of exchange.
D)functions as a unit of account.
A)increases in value when there is inflation.
B)serves as a store of value.
C)serves as a medium of exchange.
D)functions as a unit of account.
Unlock Deck
Unlock for access to all 198 flashcards in this deck.
Unlock Deck
k this deck
55
When households decide to hold more money,
A)interest rates fall and investment decreases.
B)interest rates fall and investment increases.
C)interest rates rise and investment increases.
D)interest rates rise and investment decreases.
A)interest rates fall and investment decreases.
B)interest rates fall and investment increases.
C)interest rates rise and investment increases.
D)interest rates rise and investment decreases.
Unlock Deck
Unlock for access to all 198 flashcards in this deck.
Unlock Deck
k this deck
56
Figure 34-1
Refer to Figure 34-1.If the current interest rate is 2 percent,
A)there is an excess supply of money.
B)people will sell more bonds,which drives interest rates up.
C)as the money market moves to equilibrium,people will buy more goods.
D)All of the above are correct.
Refer to Figure 34-1.If the current interest rate is 2 percent,
A)there is an excess supply of money.
B)people will sell more bonds,which drives interest rates up.
C)as the money market moves to equilibrium,people will buy more goods.
D)All of the above are correct.
Unlock Deck
Unlock for access to all 198 flashcards in this deck.
Unlock Deck
k this deck
57
According to the theory of liquidity preference,which variable adjusts to balance the supply and demand for money?
A)interest rate
B)money supply
C)quantity of output
D)price level
A)interest rate
B)money supply
C)quantity of output
D)price level
Unlock Deck
Unlock for access to all 198 flashcards in this deck.
Unlock Deck
k this deck
58
If people decide to hold less money,then
A)money demand decreases,there is an excess supply of money,and interest rates rise.
B)money demand decreases,there is an excess supply of money,and interest rates fall.
C)money demand increases,there is an excess demand for money,and interest rates fall.
D)money demand increases,there is an excess demand for money,and interest rates rise.
Unlock Deck
Unlock for access to all 198 flashcards in this deck.
Unlock Deck
k this deck
59
Figure 34-1
Refer to Figure 34-1.There is an excess demand for money at an interest rate of
A)2 percent.
B)3 percent.
C)4 percent.
D)None of the above is correct.
Refer to Figure 34-1.There is an excess demand for money at an interest rate of
A)2 percent.
B)3 percent.
C)4 percent.
D)None of the above is correct.
Unlock Deck
Unlock for access to all 198 flashcards in this deck.
Unlock Deck
k this deck
60
People are likely to want to hold more money if the interest rate
A)increases,making the opportunity cost of holding money rise.
B)increases,making the opportunity cost of holding money fall.
C)decreases,making the opportunity cost of holding money rise.
D)decreases,making the opportunity cost of holding money fall.
A)increases,making the opportunity cost of holding money rise.
B)increases,making the opportunity cost of holding money fall.
C)decreases,making the opportunity cost of holding money rise.
D)decreases,making the opportunity cost of holding money fall.
Unlock Deck
Unlock for access to all 198 flashcards in this deck.
Unlock Deck
k this deck
61
Figure 34-2.On the left-hand graph,MS represents the supply of money and MD represents the demand for money;on the right-hand graph,AD represents aggregate demand.The usual quantities are measured along the axes of both graphs.
.
Refer to Figure 34-2.As we move from one point to another along the money-demand curve MD1,
A)the price level is held fixed at P1.
B)the interest rate is held fixed at r1.
C)the money supply is changing so as to keep the money market in equilibrium.
D)the expected inflation rate is changing so as to keep the real interest rate constant.
Unlock Deck
Unlock for access to all 198 flashcards in this deck.
Unlock Deck
k this deck
62
Figure 34-3.
Refer to Figure 34-3.What quantity is represented by the downward-sloping line on the left-hand graph?
A)the supply of money
B)the demand for money
C)the rate of inflation
D)Aggregate Demand.
Refer to Figure 34-3.What quantity is represented by the downward-sloping line on the left-hand graph?
A)the supply of money
B)the demand for money
C)the rate of inflation
D)Aggregate Demand.
Unlock Deck
Unlock for access to all 198 flashcards in this deck.
Unlock Deck
k this deck
63
According to liquidity preference theory,if the quantity of money supplied is greater than the quantity demanded,then the interest rate will
A)increase and the quantity of money demanded will decrease.
B)increase and the quantity of money demanded will increase.
C)decrease and the quantity of money demanded will decrease.
D)decrease and the quantity of money demanded will increase.
A)increase and the quantity of money demanded will decrease.
B)increase and the quantity of money demanded will increase.
C)decrease and the quantity of money demanded will decrease.
D)decrease and the quantity of money demanded will increase.
Unlock Deck
Unlock for access to all 198 flashcards in this deck.
Unlock Deck
k this deck
64
Figure 34-2.On the left-hand graph,MS represents the supply of money and MD represents the demand for money;on the right-hand graph,AD represents aggregate demand.The usual quantities are measured along the axes of both graphs.
.
Refer to Figure 34-2.If the money-supply curve MS on the left-hand graph were to shift to the left,this would
A)represent an action taken by the Federal Reserve.
B)shift the AD curve to the left.
C)create,until the interest rate adjusted,an excess demand for money at the interest rate that equilibrated the money market before the shift.
D)All of the above are correct.
Unlock Deck
Unlock for access to all 198 flashcards in this deck.
Unlock Deck
k this deck
65
Figure 34-3.
Refer to Figure 34-3.For an economy such as the United States,what component of the demand for goods and services is most responsible for the decrease in output from Y1 to Y2?
A)consumption
B)investment
C)net exports
D)government spending
Refer to Figure 34-3.For an economy such as the United States,what component of the demand for goods and services is most responsible for the decrease in output from Y1 to Y2?
A)consumption
B)investment
C)net exports
D)government spending
Unlock Deck
Unlock for access to all 198 flashcards in this deck.
Unlock Deck
k this deck
66
Figure 34-2.On the left-hand graph,MS represents the supply of money and MD represents the demand for money;on the right-hand graph,AD represents aggregate demand.The usual quantities are measured along the axes of both graphs.
.
Refer to Figure 34-2.Assume the money market is always in equilibrium,and suppose r1 = 0.08;r2 = 0.12;Y1 = 13,000;Y2 = 10,000;P1 = 1.0;and P2 = 1.2.Which of the following statements is correct? When P = P2,
A)investment is lower than it is when P = P1.
B)nominal output is higher than it is when P = P1.
C)the expected rate of inflation is higher than it is when P = P1.
D)the velocity of money is higher than it is when P = P1.
Unlock Deck
Unlock for access to all 198 flashcards in this deck.
Unlock Deck
k this deck
67
Figure 34-2.On the left-hand graph,MS represents the supply of money and MD represents the demand for money;on the right-hand graph,AD represents aggregate demand.The usual quantities are measured along the axes of both graphs.
.
Refer to Figure 34-2.Which of the following quantities is held constant as we move from one point to another on either graph?
A)the nominal interest rate
B)the quantity of money demanded
C)investment
D)the expected rate of inflation
.
Refer to Figure 34-2.Which of the following quantities is held constant as we move from one point to another on either graph?
A)the nominal interest rate
B)the quantity of money demanded
C)investment
D)the expected rate of inflation
Unlock Deck
Unlock for access to all 198 flashcards in this deck.
Unlock Deck
k this deck
68
Figure 34-3.
Refer to Figure 34-3.Which of the following sequences (numbered arrows)shows the logic of the interest-rate effect?
A)1,2,3,4
B)1,4,3,2
C)3,4,2,1
D)3,2,1,4
Refer to Figure 34-3.Which of the following sequences (numbered arrows)shows the logic of the interest-rate effect?
A)1,2,3,4
B)1,4,3,2
C)3,4,2,1
D)3,2,1,4
Unlock Deck
Unlock for access to all 198 flashcards in this deck.
Unlock Deck
k this deck
69
Figure 34-2.On the left-hand graph,MS represents the supply of money and MD represents the demand for money;on the right-hand graph,AD represents aggregate demand.The usual quantities are measured along the axes of both graphs.
.
Refer to Figure 34-2.Assume the money market is always in equilibrium,and suppose r1 = 0.08;r2 = 0.12;Y1 = 13,000;Y2 = 10,000;P1 = 1.0;and P2 = 1.2.Which of the following statements is correct?
A)When r = r2,nominal output is higher than it is when r = r1.
B)When r = r2,real output is higher than it is when r = r1.
C)When r = r2,the expected rate of inflation is higher than it is when r = r1.
D)If the velocity of money is 4 when r = r2,then the quantity of money is $3,000.
Unlock Deck
Unlock for access to all 198 flashcards in this deck.
Unlock Deck
k this deck
70
According to liquidity preference theory,if there were a surplus of money,then
A)the interest rate would be above equilibrium and the quantity of money demanded would be too large for equilibrium.
B)the interest rate would be above equilibrium and the quantity of money demanded would be too small for equilibrium.
C)the interest rate would be below equilibrium and the quantity of money demanded would be too small for equilibrium.
D)the interest rate would be below equilibrium and the quantity of money demanded would be too large for equilibrium.
Unlock Deck
Unlock for access to all 198 flashcards in this deck.
Unlock Deck
k this deck
71
As the interest rate falls,
A)the quantity of money demanded falls,which would reduce a shortage.
B)the quantity of money demanded falls,which would reduce a surplus.
C)the quantity of money demanded rises,which would reduce a shortage.
D)the quantity of money demanded rises,which would reduce a surplus.
A)the quantity of money demanded falls,which would reduce a shortage.
B)the quantity of money demanded falls,which would reduce a surplus.
C)the quantity of money demanded rises,which would reduce a shortage.
D)the quantity of money demanded rises,which would reduce a surplus.
Unlock Deck
Unlock for access to all 198 flashcards in this deck.
Unlock Deck
k this deck
72
When households find themselves holding too much money,they respond by
A)purchasing interest-earning financial assets and interest rates fall.
B)purchasing interest-earning financial assets and interest rates rise.
C)holding the extra money and interest rates rise.
D)selling interest-earning financial assets,which eliminates the excess supply of money.
A)purchasing interest-earning financial assets and interest rates fall.
B)purchasing interest-earning financial assets and interest rates rise.
C)holding the extra money and interest rates rise.
D)selling interest-earning financial assets,which eliminates the excess supply of money.
Unlock Deck
Unlock for access to all 198 flashcards in this deck.
Unlock Deck
k this deck
73
The interest rate falls if
A)the price level falls or the money supply falls.
B)the price level falls or the money supply rises.
C)the price level rises or the money supply falls.
D)the price level rises or the money supply rises.
A)the price level falls or the money supply falls.
B)the price level falls or the money supply rises.
C)the price level rises or the money supply falls.
D)the price level rises or the money supply rises.
Unlock Deck
Unlock for access to all 198 flashcards in this deck.
Unlock Deck
k this deck
74
Figure 34-2.On the left-hand graph,MS represents the supply of money and MD represents the demand for money;on the right-hand graph,AD represents aggregate demand.The usual quantities are measured along the axes of both graphs.
.
Refer to Figure 34-2.If the graphs apply to an economy such as the U.S.economy,then the slope of the AD curve is primarily attributable to the
A)wealth effect.
B)interest-rate effect.
C)exchange-rate effect.
D)Fisher effect.
.
Refer to Figure 34-2.If the graphs apply to an economy such as the U.S.economy,then the slope of the AD curve is primarily attributable to the
A)wealth effect.
B)interest-rate effect.
C)exchange-rate effect.
D)Fisher effect.
Unlock Deck
Unlock for access to all 198 flashcards in this deck.
Unlock Deck
k this deck
75
Figure 34-2.On the left-hand graph,MS represents the supply of money and MD represents the demand for money;on the right-hand graph,AD represents aggregate demand.The usual quantities are measured along the axes of both graphs.
.
Refer to Figure 34-2.Assume the money market is always in equilibrium.Under the assumptions of the model,
A)the quantity of goods and services demanded is higher at P2 than it is at P1.
B)the quantity of money is higher at Y1 than it is at Y2.
C)an increase in r from r1 to r2 is associated with a decrease in Y from Y1 to Y2.
D)All of the above are correct.
Unlock Deck
Unlock for access to all 198 flashcards in this deck.
Unlock Deck
k this deck
76
Figure 34-2.On the left-hand graph,MS represents the supply of money and MD represents the demand for money;on the right-hand graph,AD represents aggregate demand.The usual quantities are measured along the axes of both graphs.
.
Refer to Figure 34-2.Assume the money market is always in equilibrium.Under the assumptions of the model,
A)the real interest rate is lower at Y2 than it is at Y1.
B)the quantity of money is the same at Y1 as it is at Y2.
C)the price level is lower at r2 than it is at r1.
D)All of the above are correct.
Unlock Deck
Unlock for access to all 198 flashcards in this deck.
Unlock Deck
k this deck
77
According to liquidity preference theory,if the quantity of money demanded is greater than the quantity supplied,then the interest rate will
A)increase and the quantity of money demanded will decrease.
B)increase and the quantity of money demanded will increase.
C)decrease and the quantity of money demanded will decrease.
D)decrease and the quantity of money demanded will increase.
A)increase and the quantity of money demanded will decrease.
B)increase and the quantity of money demanded will increase.
C)decrease and the quantity of money demanded will decrease.
D)decrease and the quantity of money demanded will increase.
Unlock Deck
Unlock for access to all 198 flashcards in this deck.
Unlock Deck
k this deck
78
The interest rate would fall and the quantity of money demanded would
A)increase if there were a surplus in the money market.
B)increase if there were a shortage in the money market.
C)decrease if there were a surplus in the money market.
D)decrease if there were a shortage in the money market.
A)increase if there were a surplus in the money market.
B)increase if there were a shortage in the money market.
C)decrease if there were a surplus in the money market.
D)decrease if there were a shortage in the money market.
Unlock Deck
Unlock for access to all 198 flashcards in this deck.
Unlock Deck
k this deck
79
If,at some interest rate,the quantity of money demanded is less than the quantity of money supplied,people will desire to
A)sell interest-bearing assets,causing the interest rate to decrease.
B)sell interest-bearing assets,causing the interest rate to increase.
C)buy interest-bearing assets,causing the interest rate to decrease.
D)buy interest-bearing assets,causing the interest rate to increase.
A)sell interest-bearing assets,causing the interest rate to decrease.
B)sell interest-bearing assets,causing the interest rate to increase.
C)buy interest-bearing assets,causing the interest rate to decrease.
D)buy interest-bearing assets,causing the interest rate to increase.
Unlock Deck
Unlock for access to all 198 flashcards in this deck.
Unlock Deck
k this deck
80
Figure 34-2.On the left-hand graph,MS represents the supply of money and MD represents the demand for money;on the right-hand graph,AD represents aggregate demand.The usual quantities are measured along the axes of both graphs.
.
Refer to Figure 34-2.A decrease in Y from Y1 to Y2 is explained as follows:
A)The Federal Reserve increases the money supply,causing the money-demand curve to shift from MD1 to MD2;this shift of MD causes r to increase from r1 to r2;and this increase in r causes Y to decrease from Y1 to Y2.
B)An increase in P from P1 to P2 causes the money-demand curve to shift from MD1 to MD2;this shift of MD causes r to increase from r1 to r2;and this increase in r causes Y to decrease from Y1 to Y2.
C)A decrease in P from P2 to P1 causes the money-demand curve to shift from MD1 to MD2;this shift of MD causes r to increase from r1 to r2;and this increase in r causes Y to decrease from Y1 to Y2.
D)An increase in the price level causes the money-demand curve to shift from MD2 to MD1;this shift of MD causes r to decrease from r2 to r1;and this decrease in r causes Y to decrease from Y1 to Y2.
Unlock Deck
Unlock for access to all 198 flashcards in this deck.
Unlock Deck
k this deck
Unlock Deck
Unlock for access to all 198 flashcards in this deck.


