Deck 35: 1: Sec 351 Mc the Phillips Curve
Full screen (f)
Question
Question
Question
Question
Question
Question
Question
Question
Question
Question
Question
Question
Question
Question
Question
Question
Question
Question
Question
Question
Question
Question
Question
Question
Question
Question
Question
Question
Question
Question
Question
Question
Question
Question
Question
Question
Question
Question
Question
Question
Question
Figure 35-4.The left-hand graph shows a short-run aggregate-supply (SRAS)curve and two aggregate-demand (AD)curves.On the left-hand diagram,the price level is measured on the vertical axis;on the right-hand diagram,the inflation rate is measured on the vertical axis. 

Refer to Figure 35-4.What is measured along the horizontal axis of the left-hand graph?
A)the wage rate
B)the inflation rate
C)output
D)the interest rate
Refer to Figure 35-4.What is measured along the horizontal axis of the left-hand graph?
A)the wage rate
B)the inflation rate
C)output
D)the interest rate
Question
Figure 35-1.The left-hand graph shows a short-run aggregate-supply (SRAS)curve and two aggregate-demand (AD)curves.On the right-hand diagram,U represents the unemployment rate. 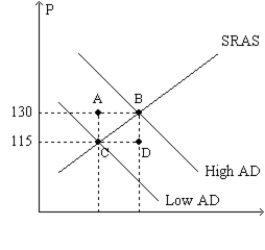
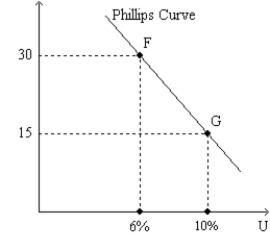
Refer to Figure 35-1.Assuming the price level in the previous year was 100,point G on the right-hand graph corresponds to
A)point A on the left-hand graph.
B)point B on the left-hand graph.
C)point C on the left-hand graph.
D)point D on the left-hand graph.
Refer to Figure 35-1.Assuming the price level in the previous year was 100,point G on the right-hand graph corresponds to
A)point A on the left-hand graph.
B)point B on the left-hand graph.
C)point C on the left-hand graph.
D)point D on the left-hand graph.
Question
Question
Figure 35-2
Use the pair of diagrams below to answer the following questions.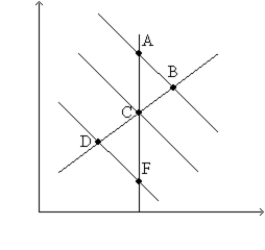
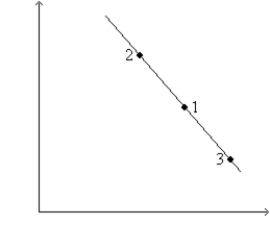
Refer to Figure 35-2.If the economy starts at C and 1,then in the short run,an increase in taxes moves the economy to
A)B and 2.
B)D and 3.
C)E and 2.
D)None of the above is correct.
Use the pair of diagrams below to answer the following questions.
Refer to Figure 35-2.If the economy starts at C and 1,then in the short run,an increase in taxes moves the economy to
A)B and 2.
B)D and 3.
C)E and 2.
D)None of the above is correct.
Question
Figure 35-1.The left-hand graph shows a short-run aggregate-supply (SRAS)curve and two aggregate-demand (AD)curves.On the right-hand diagram,U represents the unemployment rate.
Refer to Figure 35-1.Suppose points F and G on the right-hand graph represent two possible outcomes for an imaginary economy in the year 2012,and those two points correspond to points B and C,respectively,on the left-hand graph.Also suppose we know that the price index equaled 120 in 2011.Then the numbers 115 and 130 on the vertical axis of the left-hand graph would have to be replaced by
A)155 and 175,respectively.
B)138 and 156,respectively.
C)137.5 and 154.75,respectively.
D)135 and 150,respectively.
Question
Figure 35-3.The left-hand graph shows a short-run aggregate-supply (SRAS)curve and two aggregate-demand (AD)curves.On the left-hand diagram,Y represents output and on the right-hand diagram,U represents the unemployment rate. 

Refer to Figure 35-3.What is measured along the vertical axis of the left-hand graph?
A)the wage rate
B)the inflation rate
C)the price level
D)the change in output from one year to the next
Refer to Figure 35-3.What is measured along the vertical axis of the left-hand graph?
A)the wage rate
B)the inflation rate
C)the price level
D)the change in output from one year to the next
Question
Figure 35-3.The left-hand graph shows a short-run aggregate-supply (SRAS)curve and two aggregate-demand (AD)curves.On the left-hand diagram,Y represents output and on the right-hand diagram,U represents the unemployment rate.
Refer to Figure 35-3.Assume the figure charts possible outcomes for the year 2018.In 2018,the economy is at point B on the left-hand graph,which corresponds to point B on the right-hand graph.Also,point A on the left-hand graph corresponds to A on the right-hand graph.The price level in the year 2018 is
A)155.56.
B)159.00.
C)163.50.
D)170.04.
Question
Figure 35-3.The left-hand graph shows a short-run aggregate-supply (SRAS)curve and two aggregate-demand (AD)curves.On the left-hand diagram,Y represents output and on the right-hand diagram,U represents the unemployment rate.
Refer to Figure 35-3.What is measured along the vertical axis of the right-hand graph?
A)the interest rate
B)the inflation rate
C)the government's budget deficit as a percent of GDP
D)the growth rate of the nominal money supply
Refer to Figure 35-3.What is measured along the vertical axis of the right-hand graph?
A)the interest rate
B)the inflation rate
C)the government's budget deficit as a percent of GDP
D)the growth rate of the nominal money supply
Question
Figure 35-1.The left-hand graph shows a short-run aggregate-supply (SRAS)curve and two aggregate-demand (AD)curves.On the right-hand diagram,U represents the unemployment rate.
Refer to Figure 35-1.Assuming the price level in the previous year was 100,point F on the right-hand graph corresponds to
A)point A on the left-hand graph.
B)point B on the left-hand graph.
C)point C on the left-hand graph.
D)point D on the left-hand graph.
Refer to Figure 35-1.Assuming the price level in the previous year was 100,point F on the right-hand graph corresponds to
A)point A on the left-hand graph.
B)point B on the left-hand graph.
C)point C on the left-hand graph.
D)point D on the left-hand graph.
Question
Figure 35-2
Use the pair of diagrams below to answer the following questions.
Refer to Figure 35-2.If the economy starts at C and 1,then in the short run,a decrease in government expenditures moves the economy to
A)D and 2
B)D and 3.
C)E and 3.
D)None of the above is correct.
Use the pair of diagrams below to answer the following questions.
Refer to Figure 35-2.If the economy starts at C and 1,then in the short run,a decrease in government expenditures moves the economy to
A)D and 2
B)D and 3.
C)E and 3.
D)None of the above is correct.
Question
Figure 35-1.The left-hand graph shows a short-run aggregate-supply (SRAS)curve and two aggregate-demand (AD)curves.On the right-hand diagram,U represents the unemployment rate.
Refer to Figure 35-1.Suppose points F and G on the right-hand graph represent two possible outcomes for an imaginary economy in the year 2012,and those two points correspond to points B and C,respectively,on the left-hand graph.Then it is apparent that the price index equaled
A)130 in 2011.
B)115 in 2011.
C)110 in 2011.
D)100 in 2011.
Question
Figure 35-2
Use the pair of diagrams below to answer the following questions.
Refer to Figure 35-2.If the economy starts at C and 1,then in the short run,an increase in government expenditures moves the economy to
A)B and 2.
B)B and 3.
C)B and 3.
D)None of the above is correct.
Use the pair of diagrams below to answer the following questions.
Refer to Figure 35-2.If the economy starts at C and 1,then in the short run,an increase in government expenditures moves the economy to
A)B and 2.
B)B and 3.
C)B and 3.
D)None of the above is correct.
Question
Figure 35-2
Use the pair of diagrams below to answer the following questions.
Refer to Figure 35-2.If the economy starts at C and 1,then in the short run,a decrease in taxes moves the economy to
A)D and 2.
B)D and 3.
C)back to C and 1.
D)None of the above is correct.
Use the pair of diagrams below to answer the following questions.
Refer to Figure 35-2.If the economy starts at C and 1,then in the short run,a decrease in taxes moves the economy to
A)D and 2.
B)D and 3.
C)back to C and 1.
D)None of the above is correct.
Question
Figure 35-2
Use the pair of diagrams below to answer the following questions.
Refer to Figure 35-2.If the economy starts at C and 1,then in the short run,a decrease in the money supply moves the economy to
A)E and 1.
B)D and 2.
C)D and 3.
D)None of the above is correct.
Use the pair of diagrams below to answer the following questions.
Refer to Figure 35-2.If the economy starts at C and 1,then in the short run,a decrease in the money supply moves the economy to
A)E and 1.
B)D and 2.
C)D and 3.
D)None of the above is correct.
Question
Figure 35-1.The left-hand graph shows a short-run aggregate-supply (SRAS)curve and two aggregate-demand (AD)curves.On the right-hand diagram,U represents the unemployment rate.
Refer to Figure 35-1.What is measured along the vertical axis of the right-hand graph?
A)the interest rate
B)the inflation rate
C)the wage rate
D)the growth rate of the nominal money supply
Refer to Figure 35-1.What is measured along the vertical axis of the right-hand graph?
A)the interest rate
B)the inflation rate
C)the wage rate
D)the growth rate of the nominal money supply
Question
Figure 35-3.The left-hand graph shows a short-run aggregate-supply (SRAS)curve and two aggregate-demand (AD)curves.On the left-hand diagram,Y represents output and on the right-hand diagram,U represents the unemployment rate.
Refer to Figure 35-3.Assume the figure depicts possible outcomes for the year 2018.In 2018,the economy is at point A on the left-hand graph,which corresponds to point A on the right-hand graph.The price level in the year 2017 was
A)144.
B)150.
C)152.
D)156.
Refer to Figure 35-3.Assume the figure depicts possible outcomes for the year 2018.In 2018,the economy is at point A on the left-hand graph,which corresponds to point A on the right-hand graph.The price level in the year 2017 was
A)144.
B)150.
C)152.
D)156.
Question
Figure 35-2
Use the pair of diagrams below to answer the following questions.
Refer to Figure 35-2.If the economy starts at C and 1,then in the short run,an increase in the money supply growth rate moves the economy to
A)A and 1
B)B and 2
C)C and 3
D)None of the above is correct.
Use the pair of diagrams below to answer the following questions.
Refer to Figure 35-2.If the economy starts at C and 1,then in the short run,an increase in the money supply growth rate moves the economy to
A)A and 1
B)B and 2
C)C and 3
D)None of the above is correct.
Question
Figure 35-1.The left-hand graph shows a short-run aggregate-supply (SRAS)curve and two aggregate-demand (AD)curves.On the right-hand diagram,U represents the unemployment rate.
Refer to Figure 35-1.What is measured along the horizontal axis of the left-hand graph?
A)the wage rate
B)the inflation rate
C)employment
D)output
Refer to Figure 35-1.What is measured along the horizontal axis of the left-hand graph?
A)the wage rate
B)the inflation rate
C)employment
D)output
Question
Figure 35-1.The left-hand graph shows a short-run aggregate-supply (SRAS)curve and two aggregate-demand (AD)curves.On the right-hand diagram,U represents the unemployment rate.
Refer to Figure 35-1.The curve that is depicted on the right-hand graph offers policymakers a "menu" of combinations
A)that applies both in the short run and in the long run.
B)that is relevant to choices involving fiscal policy,but not to choices involving monetary policy.
C)of inflation and unemployment.
D)All of the above are correct.
Question
Figure 35-2
Use the pair of diagrams below to answer the following questions.
Refer to Figure 35-2.If the economy starts at C and 1,then in the short run,a decrease in aggregate demand moves the economy to
A)A and 2.
B)D and 3.
C)E and 3.
D)None of the above is correct.
Use the pair of diagrams below to answer the following questions.
Refer to Figure 35-2.If the economy starts at C and 1,then in the short run,a decrease in aggregate demand moves the economy to
A)A and 2.
B)D and 3.
C)E and 3.
D)None of the above is correct.
Question
Question
Figure 35-4.The left-hand graph shows a short-run aggregate-supply (SRAS)curve and two aggregate-demand (AD)curves.On the left-hand diagram,the price level is measured on the vertical axis;on the right-hand diagram,the inflation rate is measured on the vertical axis.
Refer to Figure 35-4.Assume the figure depicts possible outcomes for the year 2018.In 2018,the economy is at point A on the left-hand graph,which corresponds to point A on the right-hand graph.The price level in the year 2017 was
A)106.
B)108.
C)110.
D)112.
Refer to Figure 35-4.Assume the figure depicts possible outcomes for the year 2018.In 2018,the economy is at point A on the left-hand graph,which corresponds to point A on the right-hand graph.The price level in the year 2017 was
A)106.
B)108.
C)110.
D)112.
Question
Question
Question
Question
Question
Question
Question
Question
Question
Figure 35-4.The left-hand graph shows a short-run aggregate-supply (SRAS)curve and two aggregate-demand (AD)curves.On the left-hand diagram,the price level is measured on the vertical axis;on the right-hand diagram,the inflation rate is measured on the vertical axis.
Refer to Figure 35-4.What is measured along the horizontal axis of the right-hand graph?
A)the interest rate
B)the price level
C)the government's budget deficit as a percent of GDP
D)the unemployment rate
Refer to Figure 35-4.What is measured along the horizontal axis of the right-hand graph?
A)the interest rate
B)the price level
C)the government's budget deficit as a percent of GDP
D)the unemployment rate
Question
Question
Question
Question
Question
Question
Question
Figure 35-4.The left-hand graph shows a short-run aggregate-supply (SRAS)curve and two aggregate-demand (AD)curves.On the left-hand diagram,the price level is measured on the vertical axis;on the right-hand diagram,the inflation rate is measured on the vertical axis.
Refer to Figure 35-4.Assume the figure charts possible outcomes for the year 2018.In 2018,the economy is at point B on the left-hand graph,which corresponds to point B on the right-hand graph.Also,point A on the left-hand graph corresponds to A on the right-hand graph.The price level in the year 2018 is
A)117.25.
B)114.95.
C)113.12.
D)111.10.
Question
Question

Unlock Deck
Sign up to unlock the cards in this deck!
Unlock Deck
Unlock Deck
1/86
Play
Full screen (f)
Deck 35: 1: Sec 351 Mc the Phillips Curve
1
According to the Phillips curve,policymakers can reduce inflation by
A)contracting aggregate demand.This contraction results in a temporarily higher unemployment rate.
B)contracting aggregate demand.This contraction results in a temporarily lower unemployment rate.
C)expanding aggregate demand.This expansion results in a temporarily lower unemployment rate.
D)expanding aggregate demand.This expansion results in a temporarily higher unemployment rate.
A
2
According to the Phillips curve,policymakers could reduce both inflation and unemployment by
A)increasing the money supply.
B)increasing government expenditures.
C)raising taxes.
D)None of the above is correct.
A)increasing the money supply.
B)increasing government expenditures.
C)raising taxes.
D)None of the above is correct.
A
3
Economist A.W.Phillips found a negative correlation between
A)output and unemployment.
B)unemployment and the interest rate.
C)output and the interest rate.
D)wage inflation and unemployment.
A)output and unemployment.
B)unemployment and the interest rate.
C)output and the interest rate.
D)wage inflation and unemployment.
B
4
There is a
A)short-run tradeoff between inflation and unemployment.
B)short-run tradeoff between the actual unemployment rate and the natural rate of unemployment.
C)long-run tradeoff between inflation and unemployment.
D)long-run tradeoff between the actual unemployment rate and the natural rate of unemployment.
Unlock Deck
Unlock for access to all 86 flashcards in this deck.
Unlock Deck
k this deck
5
Samuelson and Solow argued that when unemployment is high,
A)aggregate demand is high,which puts upward pressure on wages and prices.
B)aggregate demand is high,which puts downward pressure on wages and prices.
C)aggregate demand is low,which puts upward pressure on wages and prices.
D)aggregate demand is low,which puts downward pressure on wages and prices.
Unlock Deck
Unlock for access to all 86 flashcards in this deck.
Unlock Deck
k this deck
6
Samuelson and Solow believed that the Phillips curve
A)implied that low unemployment was associated with low inflation.
B)indicated that the aggregate supply and aggregate demand model was incorrect.
C)offered policymakers a menu of possible economic outcomes from which to choose.
D)All of the above are correct.
A)implied that low unemployment was associated with low inflation.
B)indicated that the aggregate supply and aggregate demand model was incorrect.
C)offered policymakers a menu of possible economic outcomes from which to choose.
D)All of the above are correct.
Unlock Deck
Unlock for access to all 86 flashcards in this deck.
Unlock Deck
k this deck
7
According to the Phillips curve,policymakers would reduce inflation but raise unemployment if they
A)decreased the money supply.
B)increased government expenditures.
C)decreased taxes.
D)None of the above is correct.
A)decreased the money supply.
B)increased government expenditures.
C)decreased taxes.
D)None of the above is correct.
Unlock Deck
Unlock for access to all 86 flashcards in this deck.
Unlock Deck
k this deck
8
In his famous article published in an economics journal in 1958,A.W.Phillips
A)used data for the United States to show a negative relationship between the rate of change of the U.S.consumer price index and the U.S.unemployment rate.
B)used data for the United States to show a negative relationship between the rate of change of wages in the U.S.and the U.S.unemployment rate.
C)used data for the United Kingdom to show a negative relationship between the rate of change of the U.K.consumer price index and the U.K.unemployment rate.
D)used data for the United Kingdom to show a negative relationship between the rate of change of wages in the U.K.and the U.K.unemployment rate.
Unlock Deck
Unlock for access to all 86 flashcards in this deck.
Unlock Deck
k this deck
9
Samuelson and Solow argued that when unemployment is high,there is
A)upward pressure on wages and prices.
B)upward pressure on wages and downward pressure on prices.
C)upward pressure on prices and downward pressure on wages.
D)downward pressure on wages and prices.
A)upward pressure on wages and prices.
B)upward pressure on wages and downward pressure on prices.
C)upward pressure on prices and downward pressure on wages.
D)downward pressure on wages and prices.
Unlock Deck
Unlock for access to all 86 flashcards in this deck.
Unlock Deck
k this deck
10
Samuelson and Solow reasoned that when aggregate demand was low,unemployment was
A)high,so there was upward pressure on wages and prices.
B)high,so there was downward pressure on wages and prices.
C)low,so there was upward pressure on wages and prices.
D)low,so there was downward pressure on wages and prices.
A)high,so there was upward pressure on wages and prices.
B)high,so there was downward pressure on wages and prices.
C)low,so there was upward pressure on wages and prices.
D)low,so there was downward pressure on wages and prices.
Unlock Deck
Unlock for access to all 86 flashcards in this deck.
Unlock Deck
k this deck
11
A.W.Phillips' findings were based on data
A)from 1861-1957 for the United Kingdom.
B)from 1861-1957 for the United States.
C)mostly from the post-World War II period in the United Kingdom.
D)mostly from the post-World War II period in the United States.
A)from 1861-1957 for the United Kingdom.
B)from 1861-1957 for the United States.
C)mostly from the post-World War II period in the United Kingdom.
D)mostly from the post-World War II period in the United States.
Unlock Deck
Unlock for access to all 86 flashcards in this deck.
Unlock Deck
k this deck
12
Samuelson and Solow reasoned that when aggregate demand was high,unemployment was
A)low,so there was upward pressure on wages and prices.
B)low,so there was downward pressure on wages and prices.
C)high,so there was upward pressure on wages and prices.
D)high,so there was downward pressure on wages and prices.
A)low,so there was upward pressure on wages and prices.
B)low,so there was downward pressure on wages and prices.
C)high,so there was upward pressure on wages and prices.
D)high,so there was downward pressure on wages and prices.
Unlock Deck
Unlock for access to all 86 flashcards in this deck.
Unlock Deck
k this deck
13
When aggregate demand shifts right along the short-run aggregate supply curve,unemployment
A)falls,so there are upward pressures on wages and prices.
B)falls,so there are downward pressures on wages and prices.
C)rises,so there are upward pressures on wages and prices.
D)rises,so there are downward pressures on wages and prices.
A)falls,so there are upward pressures on wages and prices.
B)falls,so there are downward pressures on wages and prices.
C)rises,so there are upward pressures on wages and prices.
D)rises,so there are downward pressures on wages and prices.
Unlock Deck
Unlock for access to all 86 flashcards in this deck.
Unlock Deck
k this deck
14
The economist A.W.Phillips published a famous article in 1958 in which he showed a
A)negative correlation between the rate of unemployment and the rate of inflation.
B)positive correlation between the rate of unemployment and the rate of inflation.
C)negative correlation between the rate of unemployment and the rate of interest.
D)positive correlation between the rate of unemployment and the rate of interest
Unlock Deck
Unlock for access to all 86 flashcards in this deck.
Unlock Deck
k this deck
15
A.W.Phillips's discovery of a particular relationship between unemployment and inflation for the United Kingdom
A)could not be extended to other countries,despite many researchers' attempts to provide that extension.
B)was quickly extended to other countries by researchers.
C)was extended to only one other country - the United States.
D)was harshly criticized by the American economists Paul Samuelson and Robert Solow on the grounds that Phillips's study was fundamentally flawed.
Unlock Deck
Unlock for access to all 86 flashcards in this deck.
Unlock Deck
k this deck
16
A.W.Phillips found a
A)positive relation between unemployment and inflation in the United Kingdom.
B)positive relation between unemployment and inflation in the United States.
C)negative relation between unemployment and inflation in the United States.
D)negative relation between unemployment and inflation in the United Kingdom.
Unlock Deck
Unlock for access to all 86 flashcards in this deck.
Unlock Deck
k this deck
17
The short-run relationship between inflation and unemployment is often called
A)the Classical Dichotomy.
B)Money Neutrality.
C)the Phillips curve.
D)None of the above is correct.
A)the Classical Dichotomy.
B)Money Neutrality.
C)the Phillips curve.
D)None of the above is correct.
Unlock Deck
Unlock for access to all 86 flashcards in this deck.
Unlock Deck
k this deck
18
The short-run Phillips curve shows the combinations of
A)unemployment and inflation that arise in the short run as aggregate demand shifts the economy along the short-run aggregate supply curve.
B)unemployment and inflation that arise in the short run as short-run aggregate supply shifts the economy along the aggregate demand curve.
C)real GDP and the price level that arise in the short run as short-run aggregate supply shifts the economy along the aggregate demand curve.
D)None of the above is correct.
Unlock Deck
Unlock for access to all 86 flashcards in this deck.
Unlock Deck
k this deck
19
Samuelson and Solow argued that a combination of low unemployment and low inflation
A)was impossible given the historical data as summarized by the Phillips curve.
B)could be achieved with an "appropriate" fiscal policy.
C)could be achieved with an "appropriate" monetary policy.
D)could be achieved with an "appropriate" mix of monetary and fiscal policies.
A)was impossible given the historical data as summarized by the Phillips curve.
B)could be achieved with an "appropriate" fiscal policy.
C)could be achieved with an "appropriate" monetary policy.
D)could be achieved with an "appropriate" mix of monetary and fiscal policies.
Unlock Deck
Unlock for access to all 86 flashcards in this deck.
Unlock Deck
k this deck
20
When aggregate demand shifts rightward along the short-run aggregate-supply curve,inflation
A)increases and unemployment increases.
B)increases and unemployment decreases.
C)decreases and unemployment increases.
D)decreases and unemployment decreases.
A)increases and unemployment increases.
B)increases and unemployment decreases.
C)decreases and unemployment increases.
D)decreases and unemployment decreases.
Unlock Deck
Unlock for access to all 86 flashcards in this deck.
Unlock Deck
k this deck
21
Suppose that the money supply increases.In the short run,this increases prices according to
A)both the short-run Phillips curve and the aggregate demand and aggregate supply model.
B)neither the short-run Phillips curve nor the aggregate demand and aggregate supply model.
C)the short-run Phillips curve,but not according to the aggregate demand and aggregate supply model.
D)the aggregate demand and aggregate supply model but not according to the short-run Phillips curve.
Unlock Deck
Unlock for access to all 86 flashcards in this deck.
Unlock Deck
k this deck
22
If the central bank decreases the money supply,then in the short run prices
A)rise and unemployment falls.
B)fall and unemployment rises.
C)and unemployment rise.
D)and unemployment fall.
A)rise and unemployment falls.
B)fall and unemployment rises.
C)and unemployment rise.
D)and unemployment fall.
Unlock Deck
Unlock for access to all 86 flashcards in this deck.
Unlock Deck
k this deck
23
If policymakers decrease aggregate demand,then in the short run the price level
A)falls and unemployment rises.
B)and unemployment fall.
C)and unemployment rise.
D)rises and unemployment falls.
A)falls and unemployment rises.
B)and unemployment fall.
C)and unemployment rise.
D)rises and unemployment falls.
Unlock Deck
Unlock for access to all 86 flashcards in this deck.
Unlock Deck
k this deck
24
The economy will move to a point on the short-run Phillips curve where unemployment is higher if
A)the inflation rate decreases.
B)the government increases its expenditures.
C)the Fed increases the money supply.
D)None of the above is correct.
A)the inflation rate decreases.
B)the government increases its expenditures.
C)the Fed increases the money supply.
D)None of the above is correct.
Unlock Deck
Unlock for access to all 86 flashcards in this deck.
Unlock Deck
k this deck
25
In the short run,policy that changes aggregate demand changes
A)both unemployment and the price level.
B)neither unemployment nor the price level.
C)only unemployment.
D)only the price level.
A)both unemployment and the price level.
B)neither unemployment nor the price level.
C)only unemployment.
D)only the price level.
Unlock Deck
Unlock for access to all 86 flashcards in this deck.
Unlock Deck
k this deck
26
If policymakers increase aggregate demand,then in the short run the price level
A)falls and unemployment rises.
B)and unemployment fall.
C)and unemployment rise.
D)rises and unemployment falls.
A)falls and unemployment rises.
B)and unemployment fall.
C)and unemployment rise.
D)rises and unemployment falls.
Unlock Deck
Unlock for access to all 86 flashcards in this deck.
Unlock Deck
k this deck
27
If the short-run Phillips curve were stable,which of the following would be unusual?
A)an increase in government spending and a fall in unemployment
B)an increase in inflation and a decrease in output
C)a decrease in the inflation rate and a rise in the unemployment rate
D)a decrease in the money supply and a rise in the unemployment rate.
A)an increase in government spending and a fall in unemployment
B)an increase in inflation and a decrease in output
C)a decrease in the inflation rate and a rise in the unemployment rate
D)a decrease in the money supply and a rise in the unemployment rate.
Unlock Deck
Unlock for access to all 86 flashcards in this deck.
Unlock Deck
k this deck
28
If the central bank increases the money supply,then in the short run prices
A)rise and unemployment falls.
B)fall and unemployment rises.
C)and unemployment rise.
D)and unemployment fall.
A)rise and unemployment falls.
B)fall and unemployment rises.
C)and unemployment rise.
D)and unemployment fall.
Unlock Deck
Unlock for access to all 86 flashcards in this deck.
Unlock Deck
k this deck
29
If a central bank decreases the money supply,then
A)prices,output,and unemployment rise.
B)prices and output rise and unemployment falls.
C)prices rise and output and unemployment fall.
D)prices and output fall and unemployment rises.
A)prices,output,and unemployment rise.
B)prices and output rise and unemployment falls.
C)prices rise and output and unemployment fall.
D)prices and output fall and unemployment rises.
Unlock Deck
Unlock for access to all 86 flashcards in this deck.
Unlock Deck
k this deck
30
According to the short-run Phillips curve,if the central bank increases the money supply,then
A)inflation and unemployment will both fall.
B)inflation and unemployment will both rise.
C)inflation will fall and unemployment will rise.
D)inflation will rise and unemployment will fall.
A)inflation and unemployment will both fall.
B)inflation and unemployment will both rise.
C)inflation will fall and unemployment will rise.
D)inflation will rise and unemployment will fall.
Unlock Deck
Unlock for access to all 86 flashcards in this deck.
Unlock Deck
k this deck
31
In the long run,policy that changes aggregate demand changes
A)both unemployment and the price level.
B)neither unemployment nor the price level.
C)only unemployment.
D)only the price level.
A)both unemployment and the price level.
B)neither unemployment nor the price level.
C)only unemployment.
D)only the price level.
Unlock Deck
Unlock for access to all 86 flashcards in this deck.
Unlock Deck
k this deck
32
If policymakers expand aggregate demand,then in the long run
A)prices will be higher and unemployment will be lower.
B)prices will be higher and unemployment will be unchanged.
C)prices and unemployment will be unchanged.
D)None of the above is correct.
A)prices will be higher and unemployment will be lower.
B)prices will be higher and unemployment will be unchanged.
C)prices and unemployment will be unchanged.
D)None of the above is correct.
Unlock Deck
Unlock for access to all 86 flashcards in this deck.
Unlock Deck
k this deck
33
Unemployment would decrease and prices would increase if
A)aggregate demand shifted right.
B)aggregate demand shifted left.
C)aggregate supply shifted right.
D)aggregate supply shifted left.
A)aggregate demand shifted right.
B)aggregate demand shifted left.
C)aggregate supply shifted right.
D)aggregate supply shifted left.
Unlock Deck
Unlock for access to all 86 flashcards in this deck.
Unlock Deck
k this deck
34
If the central bank increases the money supply,in the short run,output
A)rises so unemployment rises.
B)rises so unemployment falls.
C)falls so unemployment rises.
D)falls so unemployment falls.
A)rises so unemployment rises.
B)rises so unemployment falls.
C)falls so unemployment rises.
D)falls so unemployment falls.
Unlock Deck
Unlock for access to all 86 flashcards in this deck.
Unlock Deck
k this deck
35
Suppose that the money supply increases.In the short run this decreases unemployment according to
A)both the short-run Phillips curve and the aggregate demand and aggregate supply model.
B)neither the short-run Phillips curve nor the aggregate demand and aggregate supply model.
C)the short-run Phillips curve,but not according to the aggregate demand and supply model.
D)the aggregate demand and aggregate supply model,but not according to the short-run Phillips curve.
Unlock Deck
Unlock for access to all 86 flashcards in this deck.
Unlock Deck
k this deck
36
In 2001,Congress and President Bush instituted tax cuts.According to the short-run Phillips curve,in the short run this change should have
A)reduced inflation and unemployment.
B)raised inflation and unemployment.
C)reduce inflation and raised unemployment.
D)raised inflation and reduced unemployment.
A)reduced inflation and unemployment.
B)raised inflation and unemployment.
C)reduce inflation and raised unemployment.
D)raised inflation and reduced unemployment.
Unlock Deck
Unlock for access to all 86 flashcards in this deck.
Unlock Deck
k this deck
37
Suppose that the money supply decreases.In the short run,this increases prices according to
A)both the short-run Phillips curve and the aggregate demand and aggregate supply model.
B)neither the short-run Phillips curve nor the aggregate demand and aggregate supply model.
C)the short-run Phillips curve,but not according to the aggregate demand and aggregate supply model.
D)the aggregate demand and aggregate supply model but not according to the short-run Phillips curve.
Unlock Deck
Unlock for access to all 86 flashcards in this deck.
Unlock Deck
k this deck
38
If the government raises government expenditures,then in the short run prices
A)rise and unemployment falls.
B)fall and unemployment rises.
C)and unemployment rise.
D)and unemployment fall.
A)rise and unemployment falls.
B)fall and unemployment rises.
C)and unemployment rise.
D)and unemployment fall.
Unlock Deck
Unlock for access to all 86 flashcards in this deck.
Unlock Deck
k this deck
39
Which of the following would we not expect if government policy moved the economy up along a given short-run Phillips curve?
A)Teresa reads in the newspaper that the central bank recently raised the money supply.
B)Jackie gets fewer job offers.
C)Miguel makes larger increases in the prices at his health food store.
D)Julie's nominal wage increase is larger.
A)Teresa reads in the newspaper that the central bank recently raised the money supply.
B)Jackie gets fewer job offers.
C)Miguel makes larger increases in the prices at his health food store.
D)Julie's nominal wage increase is larger.
Unlock Deck
Unlock for access to all 86 flashcards in this deck.
Unlock Deck
k this deck
40
If policymakers decrease aggregate demand,then in the long run
A)prices will be lower and unemployment will be higher.
B)prices will be lower and unemployment will be unchanged.
C)prices and unemployment will be unchanged.
D)None of the above is correct.
A)prices will be lower and unemployment will be higher.
B)prices will be lower and unemployment will be unchanged.
C)prices and unemployment will be unchanged.
D)None of the above is correct.
Unlock Deck
Unlock for access to all 86 flashcards in this deck.
Unlock Deck
k this deck
41
Figure 35-4.The left-hand graph shows a short-run aggregate-supply (SRAS)curve and two aggregate-demand (AD)curves.On the left-hand diagram,the price level is measured on the vertical axis;on the right-hand diagram,the inflation rate is measured on the vertical axis.
Refer to Figure 35-4.What is measured along the horizontal axis of the left-hand graph?
A)the wage rate
B)the inflation rate
C)output
D)the interest rate
Refer to Figure 35-4.What is measured along the horizontal axis of the left-hand graph?
A)the wage rate
B)the inflation rate
C)output
D)the interest rate
Unlock Deck
Unlock for access to all 86 flashcards in this deck.
Unlock Deck
k this deck
42
Figure 35-1.The left-hand graph shows a short-run aggregate-supply (SRAS)curve and two aggregate-demand (AD)curves.On the right-hand diagram,U represents the unemployment rate.
Refer to Figure 35-1.Assuming the price level in the previous year was 100,point G on the right-hand graph corresponds to
A)point A on the left-hand graph.
B)point B on the left-hand graph.
C)point C on the left-hand graph.
D)point D on the left-hand graph.
Refer to Figure 35-1.Assuming the price level in the previous year was 100,point G on the right-hand graph corresponds to
A)point A on the left-hand graph.
B)point B on the left-hand graph.
C)point C on the left-hand graph.
D)point D on the left-hand graph.
Unlock Deck
Unlock for access to all 86 flashcards in this deck.
Unlock Deck
k this deck
43
The government of Blenova considers two policies.Policy A would shift AD right by 500 units while policy B would shift AD right by 300 units.According to the short-run Phillips curve,policy A will lead
A)to a lower unemployment rate and a lower inflation rate than policy B.
B)to a lower unemployment rate and a higher inflation rate than policy B.
C)to a higher unemployment rate and lower inflation rate than policy B.
D)to a higher unemployment rate and higher inflation rate than policy B.
A)to a lower unemployment rate and a lower inflation rate than policy B.
B)to a lower unemployment rate and a higher inflation rate than policy B.
C)to a higher unemployment rate and lower inflation rate than policy B.
D)to a higher unemployment rate and higher inflation rate than policy B.
Unlock Deck
Unlock for access to all 86 flashcards in this deck.
Unlock Deck
k this deck
44
Figure 35-2
Use the pair of diagrams below to answer the following questions.
Refer to Figure 35-2.If the economy starts at C and 1,then in the short run,an increase in taxes moves the economy to
A)B and 2.
B)D and 3.
C)E and 2.
D)None of the above is correct.
Use the pair of diagrams below to answer the following questions.
Refer to Figure 35-2.If the economy starts at C and 1,then in the short run,an increase in taxes moves the economy to
A)B and 2.
B)D and 3.
C)E and 2.
D)None of the above is correct.
Unlock Deck
Unlock for access to all 86 flashcards in this deck.
Unlock Deck
k this deck
45
Figure 35-1.The left-hand graph shows a short-run aggregate-supply (SRAS)curve and two aggregate-demand (AD)curves.On the right-hand diagram,U represents the unemployment rate.
Refer to Figure 35-1.Suppose points F and G on the right-hand graph represent two possible outcomes for an imaginary economy in the year 2012,and those two points correspond to points B and C,respectively,on the left-hand graph.Also suppose we know that the price index equaled 120 in 2011.Then the numbers 115 and 130 on the vertical axis of the left-hand graph would have to be replaced by
A)155 and 175,respectively.
B)138 and 156,respectively.
C)137.5 and 154.75,respectively.
D)135 and 150,respectively.
Unlock Deck
Unlock for access to all 86 flashcards in this deck.
Unlock Deck
k this deck
46
Figure 35-3.The left-hand graph shows a short-run aggregate-supply (SRAS)curve and two aggregate-demand (AD)curves.On the left-hand diagram,Y represents output and on the right-hand diagram,U represents the unemployment rate.
Refer to Figure 35-3.What is measured along the vertical axis of the left-hand graph?
A)the wage rate
B)the inflation rate
C)the price level
D)the change in output from one year to the next
Refer to Figure 35-3.What is measured along the vertical axis of the left-hand graph?
A)the wage rate
B)the inflation rate
C)the price level
D)the change in output from one year to the next
Unlock Deck
Unlock for access to all 86 flashcards in this deck.
Unlock Deck
k this deck
47
Figure 35-3.The left-hand graph shows a short-run aggregate-supply (SRAS)curve and two aggregate-demand (AD)curves.On the left-hand diagram,Y represents output and on the right-hand diagram,U represents the unemployment rate.
Refer to Figure 35-3.Assume the figure charts possible outcomes for the year 2018.In 2018,the economy is at point B on the left-hand graph,which corresponds to point B on the right-hand graph.Also,point A on the left-hand graph corresponds to A on the right-hand graph.The price level in the year 2018 is
A)155.56.
B)159.00.
C)163.50.
D)170.04.
Unlock Deck
Unlock for access to all 86 flashcards in this deck.
Unlock Deck
k this deck
48
Figure 35-3.The left-hand graph shows a short-run aggregate-supply (SRAS)curve and two aggregate-demand (AD)curves.On the left-hand diagram,Y represents output and on the right-hand diagram,U represents the unemployment rate.
Refer to Figure 35-3.What is measured along the vertical axis of the right-hand graph?
A)the interest rate
B)the inflation rate
C)the government's budget deficit as a percent of GDP
D)the growth rate of the nominal money supply
Refer to Figure 35-3.What is measured along the vertical axis of the right-hand graph?
A)the interest rate
B)the inflation rate
C)the government's budget deficit as a percent of GDP
D)the growth rate of the nominal money supply
Unlock Deck
Unlock for access to all 86 flashcards in this deck.
Unlock Deck
k this deck
49
Figure 35-1.The left-hand graph shows a short-run aggregate-supply (SRAS)curve and two aggregate-demand (AD)curves.On the right-hand diagram,U represents the unemployment rate.
Refer to Figure 35-1.Assuming the price level in the previous year was 100,point F on the right-hand graph corresponds to
A)point A on the left-hand graph.
B)point B on the left-hand graph.
C)point C on the left-hand graph.
D)point D on the left-hand graph.
Refer to Figure 35-1.Assuming the price level in the previous year was 100,point F on the right-hand graph corresponds to
A)point A on the left-hand graph.
B)point B on the left-hand graph.
C)point C on the left-hand graph.
D)point D on the left-hand graph.
Unlock Deck
Unlock for access to all 86 flashcards in this deck.
Unlock Deck
k this deck
50
Figure 35-2
Use the pair of diagrams below to answer the following questions.
Refer to Figure 35-2.If the economy starts at C and 1,then in the short run,a decrease in government expenditures moves the economy to
A)D and 2
B)D and 3.
C)E and 3.
D)None of the above is correct.
Use the pair of diagrams below to answer the following questions.
Refer to Figure 35-2.If the economy starts at C and 1,then in the short run,a decrease in government expenditures moves the economy to
A)D and 2
B)D and 3.
C)E and 3.
D)None of the above is correct.
Unlock Deck
Unlock for access to all 86 flashcards in this deck.
Unlock Deck
k this deck
51
Figure 35-1.The left-hand graph shows a short-run aggregate-supply (SRAS)curve and two aggregate-demand (AD)curves.On the right-hand diagram,U represents the unemployment rate.
Refer to Figure 35-1.Suppose points F and G on the right-hand graph represent two possible outcomes for an imaginary economy in the year 2012,and those two points correspond to points B and C,respectively,on the left-hand graph.Then it is apparent that the price index equaled
A)130 in 2011.
B)115 in 2011.
C)110 in 2011.
D)100 in 2011.
Unlock Deck
Unlock for access to all 86 flashcards in this deck.
Unlock Deck
k this deck
52
Figure 35-2
Use the pair of diagrams below to answer the following questions.
Refer to Figure 35-2.If the economy starts at C and 1,then in the short run,an increase in government expenditures moves the economy to
A)B and 2.
B)B and 3.
C)B and 3.
D)None of the above is correct.
Use the pair of diagrams below to answer the following questions.
Refer to Figure 35-2.If the economy starts at C and 1,then in the short run,an increase in government expenditures moves the economy to
A)B and 2.
B)B and 3.
C)B and 3.
D)None of the above is correct.
Unlock Deck
Unlock for access to all 86 flashcards in this deck.
Unlock Deck
k this deck
53
Figure 35-2
Use the pair of diagrams below to answer the following questions.
Refer to Figure 35-2.If the economy starts at C and 1,then in the short run,a decrease in taxes moves the economy to
A)D and 2.
B)D and 3.
C)back to C and 1.
D)None of the above is correct.
Use the pair of diagrams below to answer the following questions.
Refer to Figure 35-2.If the economy starts at C and 1,then in the short run,a decrease in taxes moves the economy to
A)D and 2.
B)D and 3.
C)back to C and 1.
D)None of the above is correct.
Unlock Deck
Unlock for access to all 86 flashcards in this deck.
Unlock Deck
k this deck
54
Figure 35-2
Use the pair of diagrams below to answer the following questions.
Refer to Figure 35-2.If the economy starts at C and 1,then in the short run,a decrease in the money supply moves the economy to
A)E and 1.
B)D and 2.
C)D and 3.
D)None of the above is correct.
Use the pair of diagrams below to answer the following questions.
Refer to Figure 35-2.If the economy starts at C and 1,then in the short run,a decrease in the money supply moves the economy to
A)E and 1.
B)D and 2.
C)D and 3.
D)None of the above is correct.
Unlock Deck
Unlock for access to all 86 flashcards in this deck.
Unlock Deck
k this deck
55
Figure 35-1.The left-hand graph shows a short-run aggregate-supply (SRAS)curve and two aggregate-demand (AD)curves.On the right-hand diagram,U represents the unemployment rate.
Refer to Figure 35-1.What is measured along the vertical axis of the right-hand graph?
A)the interest rate
B)the inflation rate
C)the wage rate
D)the growth rate of the nominal money supply
Refer to Figure 35-1.What is measured along the vertical axis of the right-hand graph?
A)the interest rate
B)the inflation rate
C)the wage rate
D)the growth rate of the nominal money supply
Unlock Deck
Unlock for access to all 86 flashcards in this deck.
Unlock Deck
k this deck
56
Figure 35-3.The left-hand graph shows a short-run aggregate-supply (SRAS)curve and two aggregate-demand (AD)curves.On the left-hand diagram,Y represents output and on the right-hand diagram,U represents the unemployment rate.
Refer to Figure 35-3.Assume the figure depicts possible outcomes for the year 2018.In 2018,the economy is at point A on the left-hand graph,which corresponds to point A on the right-hand graph.The price level in the year 2017 was
A)144.
B)150.
C)152.
D)156.
Refer to Figure 35-3.Assume the figure depicts possible outcomes for the year 2018.In 2018,the economy is at point A on the left-hand graph,which corresponds to point A on the right-hand graph.The price level in the year 2017 was
A)144.
B)150.
C)152.
D)156.
Unlock Deck
Unlock for access to all 86 flashcards in this deck.
Unlock Deck
k this deck
57
Figure 35-2
Use the pair of diagrams below to answer the following questions.
Refer to Figure 35-2.If the economy starts at C and 1,then in the short run,an increase in the money supply growth rate moves the economy to
A)A and 1
B)B and 2
C)C and 3
D)None of the above is correct.
Use the pair of diagrams below to answer the following questions.
Refer to Figure 35-2.If the economy starts at C and 1,then in the short run,an increase in the money supply growth rate moves the economy to
A)A and 1
B)B and 2
C)C and 3
D)None of the above is correct.
Unlock Deck
Unlock for access to all 86 flashcards in this deck.
Unlock Deck
k this deck
58
Figure 35-1.The left-hand graph shows a short-run aggregate-supply (SRAS)curve and two aggregate-demand (AD)curves.On the right-hand diagram,U represents the unemployment rate.
Refer to Figure 35-1.What is measured along the horizontal axis of the left-hand graph?
A)the wage rate
B)the inflation rate
C)employment
D)output
Refer to Figure 35-1.What is measured along the horizontal axis of the left-hand graph?
A)the wage rate
B)the inflation rate
C)employment
D)output
Unlock Deck
Unlock for access to all 86 flashcards in this deck.
Unlock Deck
k this deck
59
Figure 35-1.The left-hand graph shows a short-run aggregate-supply (SRAS)curve and two aggregate-demand (AD)curves.On the right-hand diagram,U represents the unemployment rate.
Refer to Figure 35-1.The curve that is depicted on the right-hand graph offers policymakers a "menu" of combinations
A)that applies both in the short run and in the long run.
B)that is relevant to choices involving fiscal policy,but not to choices involving monetary policy.
C)of inflation and unemployment.
D)All of the above are correct.
Unlock Deck
Unlock for access to all 86 flashcards in this deck.
Unlock Deck
k this deck
60
Figure 35-2
Use the pair of diagrams below to answer the following questions.
Refer to Figure 35-2.If the economy starts at C and 1,then in the short run,a decrease in aggregate demand moves the economy to
A)A and 2.
B)D and 3.
C)E and 3.
D)None of the above is correct.
Use the pair of diagrams below to answer the following questions.
Refer to Figure 35-2.If the economy starts at C and 1,then in the short run,a decrease in aggregate demand moves the economy to
A)A and 2.
B)D and 3.
C)E and 3.
D)None of the above is correct.
Unlock Deck
Unlock for access to all 86 flashcards in this deck.
Unlock Deck
k this deck
61
If more firms chose to pay efficiency wages,which of the following would shift to the right?
A)both the long-run Phillips curve and the long-run aggregate supply curve
B)the long-run Phillips curve but not the long-run aggregate supply curve
C)the long-run aggregate supply curve but not the long-run Phillips curve
D)neither the long-run Phillips curve nor the long-run aggregate supply curve
Unlock Deck
Unlock for access to all 86 flashcards in this deck.
Unlock Deck
k this deck
62
Figure 35-4.The left-hand graph shows a short-run aggregate-supply (SRAS)curve and two aggregate-demand (AD)curves.On the left-hand diagram,the price level is measured on the vertical axis;on the right-hand diagram,the inflation rate is measured on the vertical axis.
Refer to Figure 35-4.Assume the figure depicts possible outcomes for the year 2018.In 2018,the economy is at point A on the left-hand graph,which corresponds to point A on the right-hand graph.The price level in the year 2017 was
A)106.
B)108.
C)110.
D)112.
Refer to Figure 35-4.Assume the figure depicts possible outcomes for the year 2018.In 2018,the economy is at point A on the left-hand graph,which corresponds to point A on the right-hand graph.The price level in the year 2017 was
A)106.
B)108.
C)110.
D)112.
Unlock Deck
Unlock for access to all 86 flashcards in this deck.
Unlock Deck
k this deck
63
Other things constant,which of the following would reduce unemployment and raise inflation?
A)businesses become more optimistic about the future of the economy
B)because of high growth abroad,net exports rise
C)the government cuts taxes
D)All of the above are correct.
A)businesses become more optimistic about the future of the economy
B)because of high growth abroad,net exports rise
C)the government cuts taxes
D)All of the above are correct.
Unlock Deck
Unlock for access to all 86 flashcards in this deck.
Unlock Deck
k this deck
64
Which of the following would we not expect if government policy moves the economy up along a given short-run Phillips curve?
A)Mark gets an increase in his nominal wage.
B)Bob gets more job offers.
C)Susan reduces prices at her pizza restaurant.
D)Tom reads that the central bank recently raised the money supply
A)Mark gets an increase in his nominal wage.
B)Bob gets more job offers.
C)Susan reduces prices at her pizza restaurant.
D)Tom reads that the central bank recently raised the money supply
Unlock Deck
Unlock for access to all 86 flashcards in this deck.
Unlock Deck
k this deck
65
As aggregate demand shifts left along the short-run aggregate supply curve,
A)inflation and unemployment are higher.
B)inflation is higher and unemployment is lower.
C)unemployment is higher and inflation is lower.
D)unemployment and inflation are lower.
A)inflation and unemployment are higher.
B)inflation is higher and unemployment is lower.
C)unemployment is higher and inflation is lower.
D)unemployment and inflation are lower.
Unlock Deck
Unlock for access to all 86 flashcards in this deck.
Unlock Deck
k this deck
66
If consumption expenditures fall,then in the short run
A)inflation and unemployment rise.
B)inflation rises and unemployment falls.
C)inflation falls and unemployment rises.
D)inflation and unemployment fall.
A)inflation and unemployment rise.
B)inflation rises and unemployment falls.
C)inflation falls and unemployment rises.
D)inflation and unemployment fall.
Unlock Deck
Unlock for access to all 86 flashcards in this deck.
Unlock Deck
k this deck
67
From 2008-2009 the Federal Reserve created a very large increase in the money supply.According to the short-run Phillips curve this policy should have
A)raised inflation and unemployment.
B)raised inflation and reduced unemployment.
C)reduced inflation and raised unemployment.
D)reduced inflation and unemployment.
A)raised inflation and unemployment.
B)raised inflation and reduced unemployment.
C)reduced inflation and raised unemployment.
D)reduced inflation and unemployment.
Unlock Deck
Unlock for access to all 86 flashcards in this deck.
Unlock Deck
k this deck
68
If taxes rise,then aggregate demand shifts
A)right,making unemployment higher than otherwise.
B)right,making unemployment lower than otherwise.
C)left,making unemployment higher than otherwise.
D)left,making unemployment lower than otherwise.
A)right,making unemployment higher than otherwise.
B)right,making unemployment lower than otherwise.
C)left,making unemployment higher than otherwise.
D)left,making unemployment lower than otherwise.
Unlock Deck
Unlock for access to all 86 flashcards in this deck.
Unlock Deck
k this deck
69
When aggregate demand shifts left along the short-run aggregate supply curve,
A)unemployment and prices rise.
B)unemployment rises and prices fall.
C)unemployment falls and prices rise.
D)unemployment and prices fall.
A)unemployment and prices rise.
B)unemployment rises and prices fall.
C)unemployment falls and prices rise.
D)unemployment and prices fall.
Unlock Deck
Unlock for access to all 86 flashcards in this deck.
Unlock Deck
k this deck
70
As the aggregate demand curve shifts rightward along a given aggregate supply curve,
A)unemployment and inflation are higher.
B)unemployment and inflation are lower.
C)unemployment is higher and inflation is lower.
D)unemployment is lower and inflation is higher.
A)unemployment and inflation are higher.
B)unemployment and inflation are lower.
C)unemployment is higher and inflation is lower.
D)unemployment is lower and inflation is higher.
Unlock Deck
Unlock for access to all 86 flashcards in this deck.
Unlock Deck
k this deck
71
Figure 35-4.The left-hand graph shows a short-run aggregate-supply (SRAS)curve and two aggregate-demand (AD)curves.On the left-hand diagram,the price level is measured on the vertical axis;on the right-hand diagram,the inflation rate is measured on the vertical axis.
Refer to Figure 35-4.What is measured along the horizontal axis of the right-hand graph?
A)the interest rate
B)the price level
C)the government's budget deficit as a percent of GDP
D)the unemployment rate
Refer to Figure 35-4.What is measured along the horizontal axis of the right-hand graph?
A)the interest rate
B)the price level
C)the government's budget deficit as a percent of GDP
D)the unemployment rate
Unlock Deck
Unlock for access to all 86 flashcards in this deck.
Unlock Deck
k this deck
72
If the central bank increases the money supply,in the short run,the price level
A)and unemployment rise.
B)rises and unemployment falls.
C)falls and unemployment rises.
D)and unemployment fall.
A)and unemployment rise.
B)rises and unemployment falls.
C)falls and unemployment rises.
D)and unemployment fall.
Unlock Deck
Unlock for access to all 86 flashcards in this deck.
Unlock Deck
k this deck
73
As the aggregate demand curve shifts leftward along a given aggregate supply curve,
A)unemployment and inflation are higher.
B)unemployment and inflation are lower.
C)unemployment is higher and inflation is lower.
D)unemployment is lower and inflation is higher.
A)unemployment and inflation are higher.
B)unemployment and inflation are lower.
C)unemployment is higher and inflation is lower.
D)unemployment is lower and inflation is higher.
Unlock Deck
Unlock for access to all 86 flashcards in this deck.
Unlock Deck
k this deck
74
If the central bank decreases the money supply,then output
A)and unemployment rises.
B)rises and unemployment falls.
C)falls and unemployment rises.
D)and unemployment falls.
A)and unemployment rises.
B)rises and unemployment falls.
C)falls and unemployment rises.
D)and unemployment falls.
Unlock Deck
Unlock for access to all 86 flashcards in this deck.
Unlock Deck
k this deck
75
If consumer confidence rises,then aggregate demand shifts
A)right,making inflation higher than otherwise.
B)right,making inflation lower than otherwise.
C)left,making inflation higher than otherwise.
D)left,making inflation lower than otherwise.
A)right,making inflation higher than otherwise.
B)right,making inflation lower than otherwise.
C)left,making inflation higher than otherwise.
D)left,making inflation lower than otherwise.
Unlock Deck
Unlock for access to all 86 flashcards in this deck.
Unlock Deck
k this deck
76
During the financial crisis Congress and President Obama authorized tax cuts and increases in government spending.According to the Phillips curve,in the short run these policies should have
A)reduced inflation and unemployment.
B)raised inflation and unemployment.
C)reduced inflation and raised unemployment.
D)raised inflation and reduced unemployment.
A)reduced inflation and unemployment.
B)raised inflation and unemployment.
C)reduced inflation and raised unemployment.
D)raised inflation and reduced unemployment.
Unlock Deck
Unlock for access to all 86 flashcards in this deck.
Unlock Deck
k this deck
77
In 2007 and 2008 households and firms reduced desired expenditures.During the same period inflation fell and unemployment rose.
A)The change in inflation,but not the change in unemployment is consistent with what a given short-run Phillips curve implies.
B)The change in unemployment,but not the change in inflation is consistent with what a given short-run Phillips curve implies.
C)Both the change in inflation and the change in unemployment are consistent with what a given short-run Phillips curve implies.
D)Neither the change in inflation nor the change in unemployment are consistent with what a given short-run Phillips curve implies.
Unlock Deck
Unlock for access to all 86 flashcards in this deck.
Unlock Deck
k this deck
78
Figure 35-4.The left-hand graph shows a short-run aggregate-supply (SRAS)curve and two aggregate-demand (AD)curves.On the left-hand diagram,the price level is measured on the vertical axis;on the right-hand diagram,the inflation rate is measured on the vertical axis.
Refer to Figure 35-4.Assume the figure charts possible outcomes for the year 2018.In 2018,the economy is at point B on the left-hand graph,which corresponds to point B on the right-hand graph.Also,point A on the left-hand graph corresponds to A on the right-hand graph.The price level in the year 2018 is
A)117.25.
B)114.95.
C)113.12.
D)111.10.
Unlock Deck
Unlock for access to all 86 flashcards in this deck.
Unlock Deck
k this deck
79
According to the short-run Phillips curve,inflation
A)and unemployment would fall if the policymakers decreased the money supply.
B)would fall and unemployment would rise if policymakers decreased the money supply.
C)and unemployment would fall if the policymakers increased the money supply.
D)would fall and unemployment would rise if policymakers increased the money supply.
Unlock Deck
Unlock for access to all 86 flashcards in this deck.
Unlock Deck
k this deck
80
In 2009 Congress and President Obama approved tax cuts and increased government spending.According to the short-run Phillips curve these policies should have
A)raised unemployment and inflation.
B)raised unemployment and reduced inflation.
C)reduced unemployment and raised inflation.
D)reduced unemployment and inflation.
A)raised unemployment and inflation.
B)raised unemployment and reduced inflation.
C)reduced unemployment and raised inflation.
D)reduced unemployment and inflation.
Unlock Deck
Unlock for access to all 86 flashcards in this deck.
Unlock Deck
k this deck
Unlock Deck
Unlock for access to all 86 flashcards in this deck.


