Deck 30: Multiple Regression Wisdom
Full screen (f)
Question
The manager of a human resources department wishes to predict the salary of an employee based on years of experience,x,and gender,g.(g = 1 for a male employee and 0 for a female employee).A random sample of 50 employees results in the following least-squares regression equation: 
= 40,000 + 2,500 x + 1,500 g +1,000 xg.Interpret the value of the coefficient of gender (g).
A)We predict that a woman with 0 years of experience will make $1,500 more than a man with 0 years of experience.
B)We predict that a man with 0 years of experience will make $1,000 more than a woman with 0 years of experience.
C)We predict that a man with 0 years of experience will make $2,500 more than a woman with 0 years of experience.
D)We predict that a man with 0 years of experience will make $1,500 more than a woman with 0 years of experience.
E)We predict that a woman with 0 years of experience will make $2,500 more than a man with 0 years of experience.
Question
Question
The manager of a human resources department wishes to predict the salary of an employee based on years of experience,x,and gender,g.(g = 1 for a male employee and 0 for a female employee).A random sample of 50 employees results in the following least-squares regression equation: 
= 40,000 + 2,500 x + 1,500 g.What is the least-squares regression line for predicting the salary of female employees?
A)

= 40,000 + 2,500x
B)

= 40,000 + 2,500x + 1,500 g
C)

= 40,000 + 4,000x
D)

= 41,500 + 1,500g
E)

= 41,500 + 2,500x
= 40,000 + 2,500 x + 1,500 g.What is the least-squares regression line for predicting the salary of female employees?
A)
= 40,000 + 2,500x
B)
= 40,000 + 2,500x + 1,500 g
C)
= 40,000 + 4,000x
D)
= 41,500 + 1,500g
E)
= 41,500 + 2,500x
Question
A company hired 25 employees for various positions.After the candidates were chosen,they wanted to see what the relationship of starting salary was based on years of experience and education level.They assign a 0,1,2,or 3 for high school diploma,bachelor's degree,master's degree,or a doctorate,respectively.The regression model looks like this:
Dependent variable is: Salary
R-squared = 69.6% R-squared (adjusted)= 66.9%
s = 7889 with 25 - 3 = 22 degrees of freedom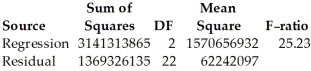
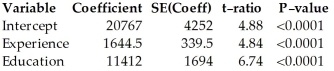
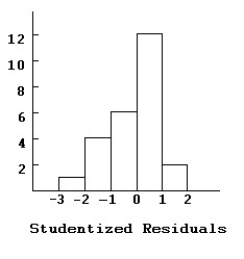
Here are histograms of the leverage and Studentized residuals for the regression model: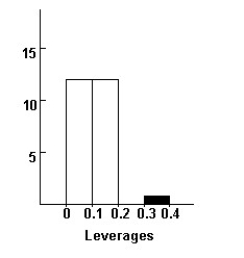
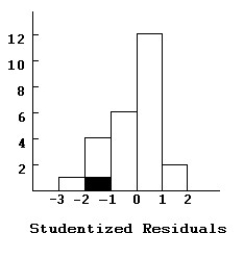
The 14th employee who was hired is highlighted in both displays.Do you think this employee is an influential case?
Dependent variable is: Salary
R-squared = 69.6% R-squared (adjusted)= 66.9%
s = 7889 with 25 - 3 = 22 degrees of freedom
Here are histograms of the leverage and Studentized residuals for the regression model:
The 14th employee who was hired is highlighted in both displays.Do you think this employee is an influential case?
Question
Question
Here are plots of data for Studentized residuals against Length. 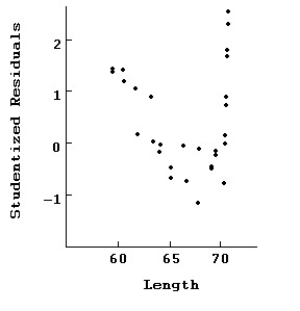
Interpret this plot of the residuals.
Interpret this plot of the residuals.
Question
The manager of a human resources department wishes to predict the salary of an employee based on years of experience,x,and gender,g.(g = 1 for a male employee and 0 for a female employee).A random sample of 50 employees results in the following least-squares regression equation: 
= 40,000 + 2,500 x + 1,500 g +1,000 xg.Predict the salary for a male employee with 15 years of experience.
A)$94,000
B)$77,500
C)$79,000
D)$80,000
E)$86,500
= 40,000 + 2,500 x + 1,500 g +1,000 xg.Predict the salary for a male employee with 15 years of experience.
A)$94,000
B)$77,500
C)$79,000
D)$80,000
E)$86,500
Question
The manager of a human resources department wishes to predict the salary of an employee based on years of experience,x,and gender,g.(g = 1 for a male employee and 0 for a female employee).A random sample of 50 employees results in the following least-squares regression equation: 
= 40,000 + 2,500 x + 1,500 g +1,000 xg.Interpret the value of the coefficient of the interaction term xg.
A)We predict that the growth rate of a male employee's salary will be $1,000 per year higher than that of a female employee.
B)We predict that a man with 0 years of experience will make $1,000 more than a woman with 0 years of experience.
C)We predict that the growth rate of a male employee's salary will be $1,000 per year.
D)We predict that a woman with 0 years of experience will make $1,000 more than a man with 0 years of experience.
E)We predict that the growth rate of a female employee's salary will be $1,000 per year.
Question
The manager of a human resources department wishes to predict the salary of an employee based on years of experience,x,and gender,g.(g = 1 for a male employee and 0 for a female employee).A random sample of 50 employees results in the following least-squares regression equation: 
= 40,000 + 2,500 x + 1,500 g +1,000 xg.What is the least-squares regression line for predicting the salary of male employees?
A)

= 41,500 + 3,500x
B)

= 40,000 + 3,500x
C)

= 40,000 + 2,500x
D)

= 41,500 + 1,500g
E)

= 40,000 + 4,000x
= 40,000 + 2,500 x + 1,500 g +1,000 xg.What is the least-squares regression line for predicting the salary of male employees?
A)
= 41,500 + 3,500x
B)
= 40,000 + 3,500x
C)
= 40,000 + 2,500x
D)
= 41,500 + 1,500g
E)
= 40,000 + 4,000x
Question
A company hired 25 employees for various positions.After the candidates were chosen,they wanted to see what the relationship of starting salary was based on years of experience and education level.They assign a 0,1,2,or 3 for high school diploma,bachelor's degree,master's degree,or a doctorate,respectively.The regression model looks like this:
Dependent variable is: Salary
R-squared = 69.6% R-squared (adjusted)= 66.9%
s = 7889 with 25 - 3 = 22 degrees of freedom
Here are histograms of the leverage and Studentized residuals for the regression model: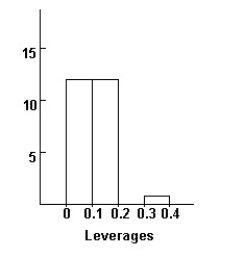
Comment on what these diagnostic displays indicate.
Dependent variable is: Salary
R-squared = 69.6% R-squared (adjusted)= 66.9%
s = 7889 with 25 - 3 = 22 degrees of freedom
Here are histograms of the leverage and Studentized residuals for the regression model:
Comment on what these diagnostic displays indicate.
Question
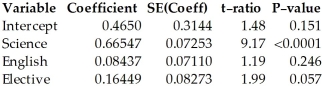
A math professor is trying to determine if her students' math grades are consistent with their grades in three other courses.She has 30 students who are all taking Math,Science,English,and an Elective course.She assigns scores of 4,3,2,and 1 for each grade of A,B,C,and D,respectively.Here's a regression model to predict the math grade based on the other courses:
Dependent variable is: Math
R-squared = 84.4% R-squared (adjusted)= 82.6%
s = 0.3789 with 30 - 4 = 26 degrees of freedom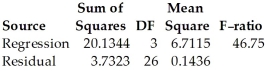
Here is a histogram of leverages for this regression: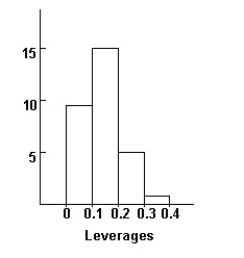
Without doing any calculating,how would you expect the coefficient and t-statistic of English to change if we were to omit the 6 highest leverage points?
Question
Question
The manager of a human resources department wishes to predict the salary of an employee based on years of experience,x,and gender,g.(g = 1 for a male employee and 0 for a female employee).A random sample of 50 employees results in the following least-squares regression equation: 
= 40,000 + 2,500 x + 1,500 g +1,000 xg.What is the least-squares regression line for predicting the salary of female employees?
A)

= 40,000 + 4,000x
B)

= 41,500 + 1,500g
C)

= 40,000 + 2,500x
D)

= 40,000 + 3,500x
E)

= 41,500 + 3,500x
= 40,000 + 2,500 x + 1,500 g +1,000 xg.What is the least-squares regression line for predicting the salary of female employees?
A)
= 40,000 + 4,000x
B)
= 41,500 + 1,500g
C)
= 40,000 + 2,500x
D)
= 40,000 + 3,500x
E)
= 41,500 + 3,500x
Question
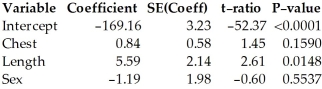
Here are plots for Studentized residuals against Chest. 
Here is the same regression with the two data points with residuals above 2 removed:
Dependent variable is: Weight
30 total bears of which 2 are missing
R-squared = 93.8% R-squared (adjusted)= 93.0%
s = 7.22 with 28 - 4 = 24 degrees of freedom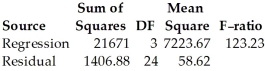
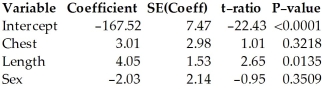
Compare the regression with the previous one.In particular,which model is likely to make the best prediction of weight? Which seems to fit the data better?
Here is the same regression with the two data points with residuals above 2 removed:
Dependent variable is: Weight
30 total bears of which 2 are missing
R-squared = 93.8% R-squared (adjusted)= 93.0%
s = 7.22 with 28 - 4 = 24 degrees of freedom
Compare the regression with the previous one.In particular,which model is likely to make the best prediction of weight? Which seems to fit the data better?
Question
A histogram of the externally Studentized residuals looks like this: 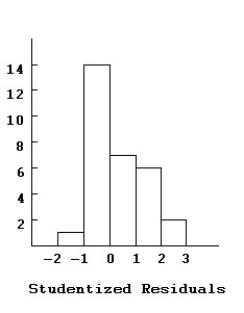
Comment on the distribution of the Studentized Residuals.
Comment on the distribution of the Studentized Residuals.
Question
A math professor is trying to determine if her students' math grades are consistent with their grades in three other courses.She has 30 students who are all taking Math,Science,English,and an Elective course.She assigns scores of 4,3,2,and 1 for each grade of A,B,C,and D,respectively.Here's a regression model to predict the math grade based on the other courses:
Dependent variable is: Math
R-squared = 84.4% R-squared (adjusted)= 82.6%
s = 0.3789 with 30 - 4 = 26 degrees of freedom
How would you interpret the coefficient of Science in the multiple regression?
Dependent variable is: Math
R-squared = 84.4% R-squared (adjusted)= 82.6%
s = 0.3789 with 30 - 4 = 26 degrees of freedom
How would you interpret the coefficient of Science in the multiple regression?
Question
A math professor is trying to determine if her students' math grades are consistent with their grades in three other courses.She has 30 students who are all taking Math,Science,English,and an Elective course.She assigns scores of 4,3,2,and 1 for each grade of A,B,C,and D,respectively.Here's a regression model to predict the math grade based on the other courses:
Dependent variable is: Math
R-squared = 84.4% R-squared (adjusted)= 82.6%
s = 0.3789 with 30 - 4 = 26 degrees of freedom
Here is the scatterplot of externally Studentized residuals against predicted values: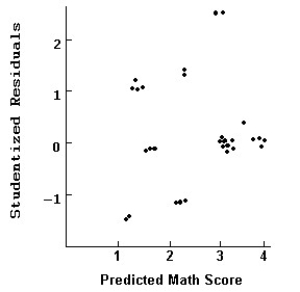
Comment on what this diagnostic display indicates.
Dependent variable is: Math
R-squared = 84.4% R-squared (adjusted)= 82.6%
s = 0.3789 with 30 - 4 = 26 degrees of freedom
Here is the scatterplot of externally Studentized residuals against predicted values:
Comment on what this diagnostic display indicates.
Question
Here are plots of data for Studentized residuals against Length. 
Here is the same regression with all of the points at 70 removed.
Dependent variable is: Weight
30 total bears of which 10 are missing
R-squared = 97.8% R-squared (adjusted)= 97.3%
s = 2.96 with 20 - 4 = 16 degrees of freedom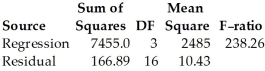
Compare the regression with the previous one.In particular,which model is likely to make the best prediction of weight? Which seems to fit the data better?
Question
The manager of a human resources department wishes to predict the salary of an employee based on years of experience,x,and gender,g.(g = 1 for a male employee and 0 for a female employee).A random sample of 50 employees results in the following least-squares regression equation: 
= 40,000 + 2,500 x + 1,500 g.What is the least-squares regression line for predicting the salary of male employees?
A)

= 40,000 + 2,500x
B)

= 40,000 + 4,000x
C)

= 40,000 + 2,500x + 1,500 g
D)

= 41,500 + 2,500x
E)

= 41,500 + 1,500g
= 40,000 + 2,500 x + 1,500 g.What is the least-squares regression line for predicting the salary of male employees?
A)
= 40,000 + 2,500x
B)
= 40,000 + 4,000x
C)
= 40,000 + 2,500x + 1,500 g
D)
= 41,500 + 2,500x
E)
= 41,500 + 1,500g
Question
Here are plots of data for Studentized residuals against Chest. 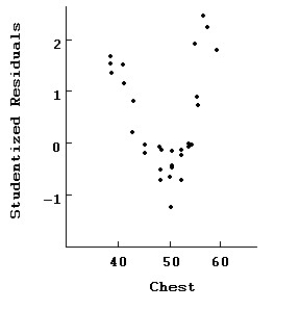
Interpret this plot of the residuals.
Interpret this plot of the residuals.
Question

Unlock Deck
Sign up to unlock the cards in this deck!
Unlock Deck
Unlock Deck
1/21
Play
Full screen (f)
Deck 30: Multiple Regression Wisdom
1
The manager of a human resources department wishes to predict the salary of an employee based on years of experience,x,and gender,g.(g = 1 for a male employee and 0 for a female employee).A random sample of 50 employees results in the following least-squares regression equation:
= 40,000 + 2,500 x + 1,500 g +1,000 xg.Interpret the value of the coefficient of gender (g).
A)We predict that a woman with 0 years of experience will make $1,500 more than a man with 0 years of experience.
B)We predict that a man with 0 years of experience will make $1,000 more than a woman with 0 years of experience.
C)We predict that a man with 0 years of experience will make $2,500 more than a woman with 0 years of experience.
D)We predict that a man with 0 years of experience will make $1,500 more than a woman with 0 years of experience.
E)We predict that a woman with 0 years of experience will make $2,500 more than a man with 0 years of experience.
We predict that a man with 0 years of experience will make $1,500 more than a woman with 0 years of experience.
2
How would you interpret the coefficient of sex in this model?
The coefficient of sex is rather small and it's not statistically significant.We have no evidence that it contributes significantly to weight.
3
The manager of a human resources department wishes to predict the salary of an employee based on years of experience,x,and gender,g.(g = 1 for a male employee and 0 for a female employee).A random sample of 50 employees results in the following least-squares regression equation:
= 40,000 + 2,500 x + 1,500 g.What is the least-squares regression line for predicting the salary of female employees?
A)
= 40,000 + 2,500x
B)
= 40,000 + 2,500x + 1,500 g
C)
= 40,000 + 4,000x
D)
= 41,500 + 1,500g
E)
= 41,500 + 2,500x
= 40,000 + 2,500 x + 1,500 g.What is the least-squares regression line for predicting the salary of female employees?
A)
= 40,000 + 2,500x
B)
= 40,000 + 2,500x + 1,500 g
C)
= 40,000 + 4,000x
D)
= 41,500 + 1,500g
E)
= 41,500 + 2,500x
= 40,000 + 2,500x
4
A company hired 25 employees for various positions.After the candidates were chosen,they wanted to see what the relationship of starting salary was based on years of experience and education level.They assign a 0,1,2,or 3 for high school diploma,bachelor's degree,master's degree,or a doctorate,respectively.The regression model looks like this:
Dependent variable is: Salary
R-squared = 69.6% R-squared (adjusted)= 66.9%
s = 7889 with 25 - 3 = 22 degrees of freedom
Here are histograms of the leverage and Studentized residuals for the regression model:
The 14th employee who was hired is highlighted in both displays.Do you think this employee is an influential case?
Unlock Deck
Unlock for access to all 21 flashcards in this deck.
Unlock Deck
k this deck
5
A real estate agent wishes to predict the selling price of a home based on several variables.One categorical variable of interest is the quality of the home - low,medium,or high.If the real estate agent wished to include "quality" in a regression model,how many indicator variables would he/she need to use in the model?
A)4
B)3
C)0
D)1
E)2
A)4
B)3
C)0
D)1
E)2
Unlock Deck
Unlock for access to all 21 flashcards in this deck.
Unlock Deck
k this deck
6
Here are plots of data for Studentized residuals against Length.
Interpret this plot of the residuals.
Interpret this plot of the residuals.
Unlock Deck
Unlock for access to all 21 flashcards in this deck.
Unlock Deck
k this deck
7
The manager of a human resources department wishes to predict the salary of an employee based on years of experience,x,and gender,g.(g = 1 for a male employee and 0 for a female employee).A random sample of 50 employees results in the following least-squares regression equation:
= 40,000 + 2,500 x + 1,500 g +1,000 xg.Predict the salary for a male employee with 15 years of experience.
A)$94,000
B)$77,500
C)$79,000
D)$80,000
E)$86,500
= 40,000 + 2,500 x + 1,500 g +1,000 xg.Predict the salary for a male employee with 15 years of experience.
A)$94,000
B)$77,500
C)$79,000
D)$80,000
E)$86,500
Unlock Deck
Unlock for access to all 21 flashcards in this deck.
Unlock Deck
k this deck
8
The manager of a human resources department wishes to predict the salary of an employee based on years of experience,x,and gender,g.(g = 1 for a male employee and 0 for a female employee).A random sample of 50 employees results in the following least-squares regression equation:
= 40,000 + 2,500 x + 1,500 g +1,000 xg.Interpret the value of the coefficient of the interaction term xg.
A)We predict that the growth rate of a male employee's salary will be $1,000 per year higher than that of a female employee.
B)We predict that a man with 0 years of experience will make $1,000 more than a woman with 0 years of experience.
C)We predict that the growth rate of a male employee's salary will be $1,000 per year.
D)We predict that a woman with 0 years of experience will make $1,000 more than a man with 0 years of experience.
E)We predict that the growth rate of a female employee's salary will be $1,000 per year.
Unlock Deck
Unlock for access to all 21 flashcards in this deck.
Unlock Deck
k this deck
9
The manager of a human resources department wishes to predict the salary of an employee based on years of experience,x,and gender,g.(g = 1 for a male employee and 0 for a female employee).A random sample of 50 employees results in the following least-squares regression equation:
= 40,000 + 2,500 x + 1,500 g +1,000 xg.What is the least-squares regression line for predicting the salary of male employees?
A)
= 41,500 + 3,500x
B)
= 40,000 + 3,500x
C)
= 40,000 + 2,500x
D)
= 41,500 + 1,500g
E)
= 40,000 + 4,000x
= 40,000 + 2,500 x + 1,500 g +1,000 xg.What is the least-squares regression line for predicting the salary of male employees?
A)
= 41,500 + 3,500x
B)
= 40,000 + 3,500x
C)
= 40,000 + 2,500x
D)
= 41,500 + 1,500g
E)
= 40,000 + 4,000x
Unlock Deck
Unlock for access to all 21 flashcards in this deck.
Unlock Deck
k this deck
10
A company hired 25 employees for various positions.After the candidates were chosen,they wanted to see what the relationship of starting salary was based on years of experience and education level.They assign a 0,1,2,or 3 for high school diploma,bachelor's degree,master's degree,or a doctorate,respectively.The regression model looks like this:
Dependent variable is: Salary
R-squared = 69.6% R-squared (adjusted)= 66.9%
s = 7889 with 25 - 3 = 22 degrees of freedom
Here are histograms of the leverage and Studentized residuals for the regression model:
Comment on what these diagnostic displays indicate.
Dependent variable is: Salary
R-squared = 69.6% R-squared (adjusted)= 66.9%
s = 7889 with 25 - 3 = 22 degrees of freedom
Here are histograms of the leverage and Studentized residuals for the regression model:
Comment on what these diagnostic displays indicate.
Unlock Deck
Unlock for access to all 21 flashcards in this deck.
Unlock Deck
k this deck
11
A math professor is trying to determine if her students' math grades are consistent with their grades in three other courses.She has 30 students who are all taking Math,Science,English,and an Elective course.She assigns scores of 4,3,2,and 1 for each grade of A,B,C,and D,respectively.Here's a regression model to predict the math grade based on the other courses:
Dependent variable is: Math
R-squared = 84.4% R-squared (adjusted)= 82.6%
s = 0.3789 with 30 - 4 = 26 degrees of freedom
Here is a histogram of leverages for this regression:
Without doing any calculating,how would you expect the coefficient and t-statistic of English to change if we were to omit the 6 highest leverage points?
Unlock Deck
Unlock for access to all 21 flashcards in this deck.
Unlock Deck
k this deck
12
An actuary wishes to predict the life expectancy of a person based on several variables.One categorical variable of interest is their relationship status - single,married,divorced,widowed,or common-law.If the actuary wished to include "relationship status" in a regression model,how many indicator variables would he/she need to use in the model?
A)4
B)2
C)3
D)5
E)1
A)4
B)2
C)3
D)5
E)1
Unlock Deck
Unlock for access to all 21 flashcards in this deck.
Unlock Deck
k this deck
13
The manager of a human resources department wishes to predict the salary of an employee based on years of experience,x,and gender,g.(g = 1 for a male employee and 0 for a female employee).A random sample of 50 employees results in the following least-squares regression equation:
= 40,000 + 2,500 x + 1,500 g +1,000 xg.What is the least-squares regression line for predicting the salary of female employees?
A)
= 40,000 + 4,000x
B)
= 41,500 + 1,500g
C)
= 40,000 + 2,500x
D)
= 40,000 + 3,500x
E)
= 41,500 + 3,500x
= 40,000 + 2,500 x + 1,500 g +1,000 xg.What is the least-squares regression line for predicting the salary of female employees?
A)
= 40,000 + 4,000x
B)
= 41,500 + 1,500g
C)
= 40,000 + 2,500x
D)
= 40,000 + 3,500x
E)
= 41,500 + 3,500x
Unlock Deck
Unlock for access to all 21 flashcards in this deck.
Unlock Deck
k this deck
14
Here are plots for Studentized residuals against Chest.
Here is the same regression with the two data points with residuals above 2 removed:
Dependent variable is: Weight
30 total bears of which 2 are missing
R-squared = 93.8% R-squared (adjusted)= 93.0%
s = 7.22 with 28 - 4 = 24 degrees of freedom
Compare the regression with the previous one.In particular,which model is likely to make the best prediction of weight? Which seems to fit the data better?
Unlock Deck
Unlock for access to all 21 flashcards in this deck.
Unlock Deck
k this deck
15
A histogram of the externally Studentized residuals looks like this:
Comment on the distribution of the Studentized Residuals.
Comment on the distribution of the Studentized Residuals.
Unlock Deck
Unlock for access to all 21 flashcards in this deck.
Unlock Deck
k this deck
16
A math professor is trying to determine if her students' math grades are consistent with their grades in three other courses.She has 30 students who are all taking Math,Science,English,and an Elective course.She assigns scores of 4,3,2,and 1 for each grade of A,B,C,and D,respectively.Here's a regression model to predict the math grade based on the other courses:
Dependent variable is: Math
R-squared = 84.4% R-squared (adjusted)= 82.6%
s = 0.3789 with 30 - 4 = 26 degrees of freedom
How would you interpret the coefficient of Science in the multiple regression?
Dependent variable is: Math
R-squared = 84.4% R-squared (adjusted)= 82.6%
s = 0.3789 with 30 - 4 = 26 degrees of freedom
How would you interpret the coefficient of Science in the multiple regression?
Unlock Deck
Unlock for access to all 21 flashcards in this deck.
Unlock Deck
k this deck
17
A math professor is trying to determine if her students' math grades are consistent with their grades in three other courses.She has 30 students who are all taking Math,Science,English,and an Elective course.She assigns scores of 4,3,2,and 1 for each grade of A,B,C,and D,respectively.Here's a regression model to predict the math grade based on the other courses:
Dependent variable is: Math
R-squared = 84.4% R-squared (adjusted)= 82.6%
s = 0.3789 with 30 - 4 = 26 degrees of freedom
Here is the scatterplot of externally Studentized residuals against predicted values:
Comment on what this diagnostic display indicates.
Dependent variable is: Math
R-squared = 84.4% R-squared (adjusted)= 82.6%
s = 0.3789 with 30 - 4 = 26 degrees of freedom
Here is the scatterplot of externally Studentized residuals against predicted values:
Comment on what this diagnostic display indicates.
Unlock Deck
Unlock for access to all 21 flashcards in this deck.
Unlock Deck
k this deck
18
Here are plots of data for Studentized residuals against Length.
Here is the same regression with all of the points at 70 removed.
Dependent variable is: Weight
30 total bears of which 10 are missing
R-squared = 97.8% R-squared (adjusted)= 97.3%
s = 2.96 with 20 - 4 = 16 degrees of freedom
Compare the regression with the previous one.In particular,which model is likely to make the best prediction of weight? Which seems to fit the data better?
Unlock Deck
Unlock for access to all 21 flashcards in this deck.
Unlock Deck
k this deck
19
The manager of a human resources department wishes to predict the salary of an employee based on years of experience,x,and gender,g.(g = 1 for a male employee and 0 for a female employee).A random sample of 50 employees results in the following least-squares regression equation:
= 40,000 + 2,500 x + 1,500 g.What is the least-squares regression line for predicting the salary of male employees?
A)
= 40,000 + 2,500x
B)
= 40,000 + 4,000x
C)
= 40,000 + 2,500x + 1,500 g
D)
= 41,500 + 2,500x
E)
= 41,500 + 1,500g
= 40,000 + 2,500 x + 1,500 g.What is the least-squares regression line for predicting the salary of male employees?
A)
= 40,000 + 2,500x
B)
= 40,000 + 4,000x
C)
= 40,000 + 2,500x + 1,500 g
D)
= 41,500 + 2,500x
E)
= 41,500 + 1,500g
Unlock Deck
Unlock for access to all 21 flashcards in this deck.
Unlock Deck
k this deck
20
Here are plots of data for Studentized residuals against Chest.
Interpret this plot of the residuals.
Interpret this plot of the residuals.
Unlock Deck
Unlock for access to all 21 flashcards in this deck.
Unlock Deck
k this deck
21
What is the purpose of an indicator variable in a regression model?
A)An indicator variable allows us to increase our R-squared value.
B)An indicator variable allows us to include quantitative variables in our model.
C)An indicator variable allows us to fix violations of our constant variance assumption.
D)An indicator variable allows us to fix violations of our normality assumption.
E)An indicator variable allows us to include categorical variables in our model.
Unlock Deck
Unlock for access to all 21 flashcards in this deck.
Unlock Deck
k this deck
Unlock Deck
Unlock for access to all 21 flashcards in this deck.


