Deck 10: Using the Competitive Model
Full screen (f)
Question
The following figure shows the intersection of demand and supply at the price P2 and quantity Q2 in a competitive market.
Figure 10-2
Refer to Figure 10-2.What is the producer surplus at the equilibrium level of output?
A)f + g + j
B)f + g + h + i + j
C)f + g
D)i + h + g + f
Figure 10-2
Refer to Figure 10-2.What is the producer surplus at the equilibrium level of output?
A)f + g + j
B)f + g + h + i + j
C)f + g
D)i + h + g + f
Question
Question
Question
Question
Question
The following figure shows the intersection of demand and supply at the price P2 and quantity Q2 in a competitive market.
Figure 10-2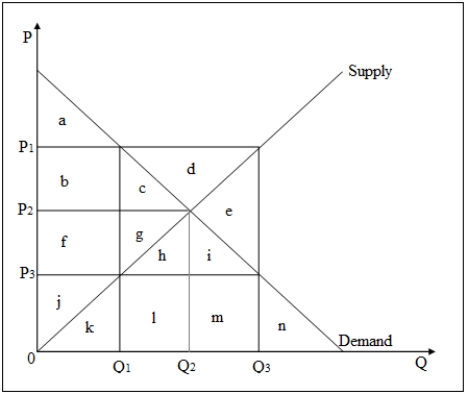
Refer to Figure 10-2.What is the deadweight loss if a price ceiling is imposed at the price level P3 in this market?
A)b + f + c + g
B)b + c + d + e
C)c + g
D)d + e
Figure 10-2
Refer to Figure 10-2.What is the deadweight loss if a price ceiling is imposed at the price level P3 in this market?
A)b + f + c + g
B)b + c + d + e
C)c + g
D)d + e
Question
Question
Question
Question
Question
Question
The following figure shows the effect of a price ceiling in the market for yams.The market was initially in equilibrium at price P2 and quantity B.
Figure 10-1
Refer to Figure 10-1.The total surplus at the initial point of equilibrium,F,is given by _____.
A)LFP2
B)LFGP1
C)LFM
D)LFIP1
Figure 10-1
Refer to Figure 10-1.The total surplus at the initial point of equilibrium,F,is given by _____.
A)LFP2
B)LFGP1
C)LFM
D)LFIP1
Question
Question
Question
Question
Question
The following figure shows the intersection of demand and supply at the price P2 and quantity Q2 in a competitive market.
Figure 10-2
Refer to Figure 10-2.What is the consumer surplus at the equilibrium level of output?
A)a + b + f + g + h
B)a + b + c + d
C)a + b + c + f + g
D)a + b + c
Figure 10-2
Refer to Figure 10-2.What is the consumer surplus at the equilibrium level of output?
A)a + b + f + g + h
B)a + b + c + d
C)a + b + c + f + g
D)a + b + c
Question
Question
The following figure shows the effect of a price ceiling in the market for yams.The market was initially in equilibrium at price P2 and quantity B.
Figure 10-1
In Figure 10-1,the deadweight loss due to a price ceiling set at P1 is area _____.
A)GFH
B)EFI
C)EFK
D)EFHI
Figure 10-1
In Figure 10-1,the deadweight loss due to a price ceiling set at P1 is area _____.
A)GFH
B)EFI
C)EFK
D)EFHI
Question
Question
The following figure shows the effect of a price ceiling in the market for yams.The market was initially in equilibrium at price P2 and quantity B.
Figure 10-1
Refer to Figure 10-1.The change in aggregate producer surplus due to a price ceiling set at P1 is area _____.
A)-EFI
B)EFJ - P2JIP1
C)-P2FIP1
D)P1IM
Figure 10-1
Refer to Figure 10-1.The change in aggregate producer surplus due to a price ceiling set at P1 is area _____.
A)-EFI
B)EFJ - P2JIP1
C)-P2FIP1
D)P1IM
Question
The following figure shows the effect of a price ceiling in the market for yams.The market was initially in equilibrium at price P2 and quantity B.
Figure 10-1
In Figure 10-1,what is the quantity of output produced after the imposition of the price ceiling at P1?
A)OA
B)OB
C)OC
D)ON
Figure 10-1
In Figure 10-1,what is the quantity of output produced after the imposition of the price ceiling at P1?
A)OA
B)OB
C)OC
D)ON
Question
The following figure shows the effect of a price ceiling in the market for yams.The market was initially in equilibrium at price P2 and quantity B.
Figure 10-1
Refer to Figure 10-1.The aggregate consumer surplus at the initial point of equilibrium,F,is _____.
A)EFJ
B)LEJP2
C)LEP3
D)LFP2
Figure 10-1
Refer to Figure 10-1.The aggregate consumer surplus at the initial point of equilibrium,F,is _____.
A)EFJ
B)LEJP2
C)LEP3
D)LFP2
Question
Question
The following figure shows the effect of a price ceiling in the market for yams.The market was initially in equilibrium at price P2 and quantity B.
Figure 10-1
In Figure 10-1,the aggregate consumer surplus after a price ceiling is set at P1 is _____.
A)LFP2
B)LEP3
C)LEJP2
D)LEIP1
Figure 10-1
In Figure 10-1,the aggregate consumer surplus after a price ceiling is set at P1 is _____.
A)LFP2
B)LEP3
C)LEJP2
D)LEIP1
Question
Question
Question
Question
Question
The following figure shows the effect of a price ceiling in the market for yams.The market was initially in equilibrium at price P2 and quantity B.
Figure 10-1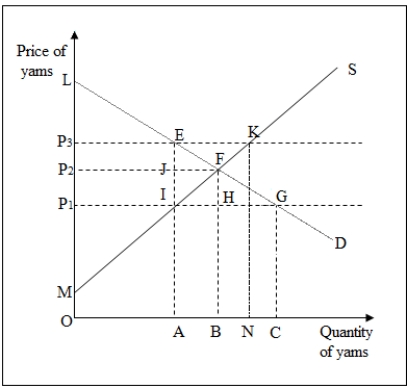
In Figure 10-1,the net change in total surplus due to a price ceiling set at P3 is _____.
A)EKF
B)P3KFP2
C)0
D)EFJ
Figure 10-1
In Figure 10-1,the net change in total surplus due to a price ceiling set at P3 is _____.
A)EKF
B)P3KFP2
C)0
D)EFJ
Question
Question
Question
Question
The following figure shows the effect of a price ceiling in the market for yams.The market was initially in equilibrium at price P2 and quantity B.
Figure 10-1
In Figure 10-1,the aggregate producer surplus after a price ceiling is set at P1 is area _____.
A)MFP2
B)MIEP3
C)MIJP2
D)MIP1
Figure 10-1
In Figure 10-1,the aggregate producer surplus after a price ceiling is set at P1 is area _____.
A)MFP2
B)MIEP3
C)MIJP2
D)MIP1
Question
Question
The following figure shows the effect of a price ceiling in the market for yams.The market was initially in equilibrium at price P2 and quantity B.
Figure 10-1
Refer to Figure 10-1.The change in aggregate consumer surplus due to a price ceiling set at P1 is area _____.
A)-EFJ
B)EFJ + P2JIP1
C)EFJ - P3EJP2
D)P2JIP1 - EFJ
Figure 10-1
Refer to Figure 10-1.The change in aggregate consumer surplus due to a price ceiling set at P1 is area _____.
A)-EFJ
B)EFJ + P2JIP1
C)EFJ - P3EJP2
D)P2JIP1 - EFJ
Question
The following figure shows the effect of a price ceiling in the market for yams.The market was initially in equilibrium at price P2 and quantity B.
Figure 10-1
In Figure 10-1,the aggregate producer surplus at the initial point of equilibrium,F,is area _____.
A)P2FIP1
B)FP2M
C)MIP1
D)LP2F
Figure 10-1
In Figure 10-1,the aggregate producer surplus at the initial point of equilibrium,F,is area _____.
A)P2FIP1
B)FP2M
C)MIP1
D)LP2F
Question
Question
Question
Question
Question
Question
Question
Question
Question
Question
Question
Question
Question
Question
Question
Question
Question
Question
Question
Question
Question
Question
Question
Question
The following figure shows the demand and supply for a commodity in the domestic U.S.market as well as the global market.The commodity is imported from the rest of the world to the U.S.market.
Figure 10-3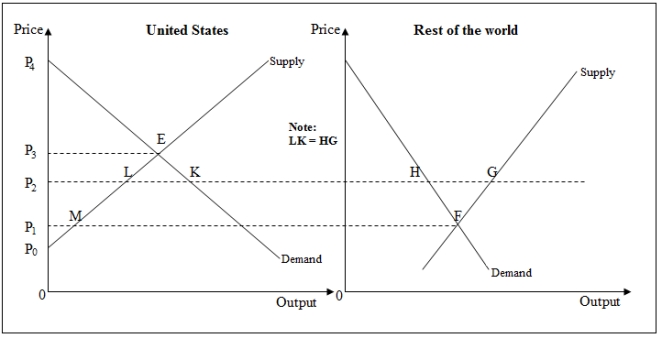
In Figure 10-3,the total producer surplus after trade is _____.
A)P3ELP2
B)ELK
C)P2LP0
D)P2LMP1
Figure 10-3
In Figure 10-3,the total producer surplus after trade is _____.
A)P3ELP2
B)ELK
C)P2LP0
D)P2LMP1
Question
Question
Question
The following figure shows the demand and supply for a commodity in the domestic U.S.market as well as the global market.The commodity is imported from the rest of the world to the U.S.market.
Figure 10-3
Refer to Figure 10-3.The total producer surplus prior to trade was _____.
A)P3EP0
B)P2LP0
C)P1MP0
D)P3EMP1
Figure 10-3
Refer to Figure 10-3.The total producer surplus prior to trade was _____.
A)P3EP0
B)P2LP0
C)P1MP0
D)P3EMP1
Question
The following figure shows the intersection of the demand and supply curves for a commodity in the domestic market at price P2 and quantity Q2,in the absence of trade.With trade,the supply curve shifts to Supplytrade.
Figure 10-4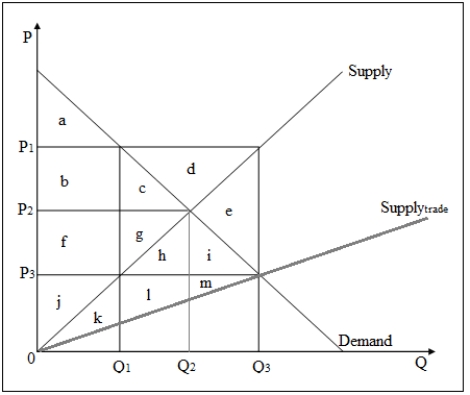
Refer to Figure 10-4.In the absence of trade,the total consumer surplus is given by _____.
A)a + b + c + g + f
B)a + b + c + d
C)d + b + c
D)a + b + c
Figure 10-4
Refer to Figure 10-4.In the absence of trade,the total consumer surplus is given by _____.
A)a + b + c + g + f
B)a + b + c + d
C)d + b + c
D)a + b + c
Question
The following figure shows the intersection of the demand and supply curves for a commodity in the domestic market at price P2 and quantity Q2,in the absence of trade.With trade,the supply curve shifts to Supplytrade.
Figure 10-4
Refer to Figure 10-4.The quantity of imports into the domestic market is given by _____.
A)Q2 - Q1
B)Q3 - Q2
C)Q3 - Q1
D)Q3
Figure 10-4
Refer to Figure 10-4.The quantity of imports into the domestic market is given by _____.
A)Q2 - Q1
B)Q3 - Q2
C)Q3 - Q1
D)Q3
Question
The following figure shows the demand and supply for a commodity in the domestic U.S.market as well as the global market.The commodity is imported from the rest of the world to the U.S.market.
Figure 10-3
In Figure 10-3,trade increases consumer surplus in the U.S.by _____.
A)P3EKP2
B)P3EP0
C)EKL
D)P2LMP1
Figure 10-3
In Figure 10-3,trade increases consumer surplus in the U.S.by _____.
A)P3EKP2
B)P3EP0
C)EKL
D)P2LMP1
Question
Question
The following figure shows the intersection of the demand and supply curves for a commodity in the domestic market at price P2 and quantity Q2,in the absence of trade.With trade,the supply curve shifts to Supplytrade.
Figure 10-4
Refer to Figure 10-4.When foreign suppliers enter the domestic market the total consumer surplus becomes _____.
A)a + b + c + d
B)a + b + c + f + g + h
C)a + b + c + f + g + j
D)a + b + c + f + g + h + i
Figure 10-4
Refer to Figure 10-4.When foreign suppliers enter the domestic market the total consumer surplus becomes _____.
A)a + b + c + d
B)a + b + c + f + g + h
C)a + b + c + f + g + j
D)a + b + c + f + g + h + i
Question
The following figure shows the intersection of the demand and supply curves for a commodity in the domestic market at price P2 and quantity Q2,in the absence of trade.With trade,the supply curve shifts to Supplytrade.
Figure 10-4
Refer to Figure 10-4.In the absence of trade,the total producer surplus is given by _____.
A)f + g + j
B)f + g + h + j
C)f + g + h + i
D)f + g + h + i + j
Figure 10-4
Refer to Figure 10-4.In the absence of trade,the total producer surplus is given by _____.
A)f + g + j
B)f + g + h + j
C)f + g + h + i
D)f + g + h + i + j
Question
The following figure shows the domestic U.S.market for bananas and the global market for bananas.The domestic supply curve is given by SUPPLYUS.With free trade,the equilibrium output in the U.S.market is Q.The import quota imposed by the government is equal to 0A.
Figure 10-5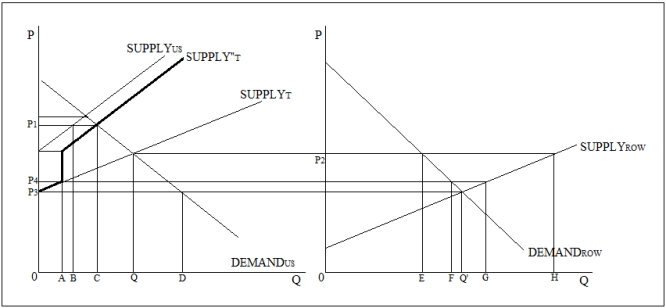
Refer to Figure 10-5.Which of the following should necessarily be true?
A)FG = BC
B)0D = EH
C)EH = 0C + CQ
D)BC = EF
Figure 10-5
Refer to Figure 10-5.Which of the following should necessarily be true?
A)FG = BC
B)0D = EH
C)EH = 0C + CQ
D)BC = EF
Question
Question
The following figure shows the demand and supply for a commodity in the domestic U.S.market as well as the global market.The commodity is imported from the rest of the world to the U.S.market.
Figure 10-3
Refer to Figure 10-3.In the absence of trade,the equilibrium price in the U.S.market is _____.
A)P3
B)P2
C)P1
D)P0
Figure 10-3
Refer to Figure 10-3.In the absence of trade,the equilibrium price in the U.S.market is _____.
A)P3
B)P2
C)P1
D)P0
Question
The following figure shows the intersection of the demand and supply curves for a commodity in the domestic market at price P2 and quantity Q2,in the absence of trade.With trade,the supply curve shifts to Supplytrade.
Figure 10-4
Refer to Figure 10-4.The net gain to domestic residents when they trade with foreign suppliers is represented by _____.
A)d + e
B)h + i
C)k + l + m
D)f + g + j
Figure 10-4
Refer to Figure 10-4.The net gain to domestic residents when they trade with foreign suppliers is represented by _____.
A)d + e
B)h + i
C)k + l + m
D)f + g + j
Question
The following figure shows the demand and supply for a commodity in the domestic U.S.market as well as the global market.The commodity is imported from the rest of the world to the U.S.market.
Figure 10-3
In Figure 10-3,the net gain to the U.S.from trade is _____.
A)P3EP0
B)P3ELP2
C)P4EP0
D)ELK
Figure 10-3
In Figure 10-3,the net gain to the U.S.from trade is _____.
A)P3EP0
B)P3ELP2
C)P4EP0
D)ELK
Question
Question
The following figure shows the demand and supply for a commodity in the domestic U.S.market as well as the global market.The commodity is imported from the rest of the world to the U.S.market.
Figure 10-3
Refer to Figure 10-3.The total consumer surplus prior to trade was _____.
A)P4EP3
B)P4KP2
C)P4ELP2
D)P3EP0
Figure 10-3
Refer to Figure 10-3.The total consumer surplus prior to trade was _____.
A)P4EP3
B)P4KP2
C)P4ELP2
D)P3EP0
Question
The following figure shows the demand and supply for a commodity in the domestic U.S.market as well as the global market.The commodity is imported from the rest of the world to the U.S.market.
Figure 10-3
In Figure 10-3,for the rest of the world:
A)the gain in producer surplus equals the gain in consumer surplus.
B)producer surplus increases while consumer surplus is unchanged.
C)the gain in consumer surplus is greater than the gain in producer surplus.
D)there are no changes in consumer or producer surplus after trade.
Question
Question

Unlock Deck
Sign up to unlock the cards in this deck!
Unlock Deck
Unlock Deck
1/96
Play
Full screen (f)
Deck 10: Using the Competitive Model
1
The following figure shows the intersection of demand and supply at the price P2 and quantity Q2 in a competitive market.
Figure 10-2
Refer to Figure 10-2.What is the producer surplus at the equilibrium level of output?
A)f + g + j
B)f + g + h + i + j
C)f + g
D)i + h + g + f
Figure 10-2
Refer to Figure 10-2.What is the producer surplus at the equilibrium level of output?
A)f + g + j
B)f + g + h + i + j
C)f + g
D)i + h + g + f
A
2
In the long run,aggregate producer surplus is zero in:
A)industries with positive accounting profits.
B)industries with a positive economic profit.
C)decreasing-cost industries.
D)constant-cost competitive industries.
A)industries with positive accounting profits.
B)industries with a positive economic profit.
C)decreasing-cost industries.
D)constant-cost competitive industries.
D
3
What is meant by a deadweight loss?
A)It is the aggregate loss in total surplus in an inefficient market.
B)It is the total loss in producer surplus due to output being at an inefficient level.
C)It is the sum of the consumer and producer surpluses in an inefficient market.
D)It is the loss in consumer surplus due to a price ceiling or floor in the market.
A
4
The equilibrium of a competitive industry is:
A)equitable but not necessarily efficient.
B)efficient.
C)not always efficient.
D)neither efficient nor equitable.
A)equitable but not necessarily efficient.
B)efficient.
C)not always efficient.
D)neither efficient nor equitable.
Unlock Deck
Unlock for access to all 96 flashcards in this deck.
Unlock Deck
k this deck
5
Suppose the demand for raspberry frozen yogurt can be represented by the equation QD = 5 - 2P,and the supply is given by the equation QS = 3P.Which of the following is the best estimate of the consumer surplus in this market?
A)$2
B)$1.25
C)$2.25
D)$3.75
A)$2
B)$1.25
C)$2.25
D)$3.75
Unlock Deck
Unlock for access to all 96 flashcards in this deck.
Unlock Deck
k this deck
6
The following figure shows the intersection of demand and supply at the price P2 and quantity Q2 in a competitive market.
Figure 10-2
Refer to Figure 10-2.What is the deadweight loss if a price ceiling is imposed at the price level P3 in this market?
A)b + f + c + g
B)b + c + d + e
C)c + g
D)d + e
Figure 10-2
Refer to Figure 10-2.What is the deadweight loss if a price ceiling is imposed at the price level P3 in this market?
A)b + f + c + g
B)b + c + d + e
C)c + g
D)d + e
Unlock Deck
Unlock for access to all 96 flashcards in this deck.
Unlock Deck
k this deck
7
What is meant by consumer surplus?
A)It is the total quantity of a good bought by a consumer divided by the price paid.
B)It is a measure of an individual consumer's utility from the consumption of a good.
C)It is the difference between a consumer's maximum willingness to pay and the price.
D)It is a measure of the total benefit to consumers from the purchase of a good.
Unlock Deck
Unlock for access to all 96 flashcards in this deck.
Unlock Deck
k this deck
8
The long-run supply curve in a constant-cost competitive industry is a(n)_____ line.
A)horizontal
B)vertical
C)downward sloping
D)upward sloping
A)horizontal
B)vertical
C)downward sloping
D)upward sloping
Unlock Deck
Unlock for access to all 96 flashcards in this deck.
Unlock Deck
k this deck
9
Producer surplus is calculated as _____.
A)the area between the price line and the supply curve up to the equilibrium level of output
B)the area between the supply curve and the X-axis up to the equilibrium level of output
C)the area between the price line and the demand curve up to the equilibrium level of output
D)the area between the demand curve and the supply curve up to the equilibrium level of output
Unlock Deck
Unlock for access to all 96 flashcards in this deck.
Unlock Deck
k this deck
10
The total surplus gained by all the participants in a competitive market is the area between the _____ up to the equilibrium level of output.
A)demand curve and the equilibrium price line
B)demand curve and the supply curve
C)demand curve and the horizontal axis
D)equilibrium price line and the horizontal axis
A)demand curve and the equilibrium price line
B)demand curve and the supply curve
C)demand curve and the horizontal axis
D)equilibrium price line and the horizontal axis
Unlock Deck
Unlock for access to all 96 flashcards in this deck.
Unlock Deck
k this deck
11
Suppose the demand for ice cream sundaes can be represented by the equation QD = 10 - P,and the supply is given by the equation QS = P.Which of the following is the best estimate of the producer surplus in this market?
A)$5
B)$10
C)$12.5
D)$22.5
A)$5
B)$10
C)$12.5
D)$22.5
Unlock Deck
Unlock for access to all 96 flashcards in this deck.
Unlock Deck
k this deck
12
The following figure shows the effect of a price ceiling in the market for yams.The market was initially in equilibrium at price P2 and quantity B.
Figure 10-1
Refer to Figure 10-1.The total surplus at the initial point of equilibrium,F,is given by _____.
A)LFP2
B)LFGP1
C)LFM
D)LFIP1
Figure 10-1
Refer to Figure 10-1.The total surplus at the initial point of equilibrium,F,is given by _____.
A)LFP2
B)LFGP1
C)LFM
D)LFIP1
Unlock Deck
Unlock for access to all 96 flashcards in this deck.
Unlock Deck
k this deck
13
When a price ceiling is imposed in a competitive market at a level below the equilibrium price:
A)the gain to producers outweighs the loss to consumers.
B)the output level becomes inefficient.
C)the total surplus in the market is not affected.
D)the producer surplus is increased.
A)the gain to producers outweighs the loss to consumers.
B)the output level becomes inefficient.
C)the total surplus in the market is not affected.
D)the producer surplus is increased.
Unlock Deck
Unlock for access to all 96 flashcards in this deck.
Unlock Deck
k this deck
14
The level of output produced by a firm is efficient if _____ at that level of output.
A)marginal benefit equals marginal cost
B)total cost equals total revenue
C)fixed cost equals price
D)average variable cost equals average revenue
A)marginal benefit equals marginal cost
B)total cost equals total revenue
C)fixed cost equals price
D)average variable cost equals average revenue
Unlock Deck
Unlock for access to all 96 flashcards in this deck.
Unlock Deck
k this deck
15
The area under the supply curve represents _____.
A)the variable cost of producing the good or service
B)the fixed cost of producing the good or service
C)the marginal value to the firm from producing the good or service
D)the total revenue earned by the firm from selling the good or service
A)the variable cost of producing the good or service
B)the fixed cost of producing the good or service
C)the marginal value to the firm from producing the good or service
D)the total revenue earned by the firm from selling the good or service
Unlock Deck
Unlock for access to all 96 flashcards in this deck.
Unlock Deck
k this deck
16
What is meant by producer surplus?
A)It is the total quantity of a good produced by the seller.
B)It is the difference between the producer's marginal cost and the price.
C)It is the difference between a producer's minimum selling price and the actual price.
D)It is a measure of the total benefit to producers resulting from the purchase of an input.
Unlock Deck
Unlock for access to all 96 flashcards in this deck.
Unlock Deck
k this deck
17
The following figure shows the intersection of demand and supply at the price P2 and quantity Q2 in a competitive market.
Figure 10-2
Refer to Figure 10-2.What is the consumer surplus at the equilibrium level of output?
A)a + b + f + g + h
B)a + b + c + d
C)a + b + c + f + g
D)a + b + c
Figure 10-2
Refer to Figure 10-2.What is the consumer surplus at the equilibrium level of output?
A)a + b + f + g + h
B)a + b + c + d
C)a + b + c + f + g
D)a + b + c
Unlock Deck
Unlock for access to all 96 flashcards in this deck.
Unlock Deck
k this deck
18
When a price ceiling is imposed in a competitive market at a level below the equilibrium price:
A)the total surplus is reduced.
B)there is no welfare cost associated with it.
C)the consumer surplus increases more than producer surplus.
D)the producer surplus increases more than consumer surplus.
A)the total surplus is reduced.
B)there is no welfare cost associated with it.
C)the consumer surplus increases more than producer surplus.
D)the producer surplus increases more than consumer surplus.
Unlock Deck
Unlock for access to all 96 flashcards in this deck.
Unlock Deck
k this deck
19
The following figure shows the effect of a price ceiling in the market for yams.The market was initially in equilibrium at price P2 and quantity B.
Figure 10-1
In Figure 10-1,the deadweight loss due to a price ceiling set at P1 is area _____.
A)GFH
B)EFI
C)EFK
D)EFHI
Figure 10-1
In Figure 10-1,the deadweight loss due to a price ceiling set at P1 is area _____.
A)GFH
B)EFI
C)EFK
D)EFHI
Unlock Deck
Unlock for access to all 96 flashcards in this deck.
Unlock Deck
k this deck
20
When the efficient rate of output is produced in the short run:
A)marginal cost is greater than marginal benefit.
B)the producer surplus is as large as possible.
C)the total surplus is as large as possible.
D)marginal benefit is greater than marginal cost.
A)marginal cost is greater than marginal benefit.
B)the producer surplus is as large as possible.
C)the total surplus is as large as possible.
D)marginal benefit is greater than marginal cost.
Unlock Deck
Unlock for access to all 96 flashcards in this deck.
Unlock Deck
k this deck
21
The following figure shows the effect of a price ceiling in the market for yams.The market was initially in equilibrium at price P2 and quantity B.
Figure 10-1
Refer to Figure 10-1.The change in aggregate producer surplus due to a price ceiling set at P1 is area _____.
A)-EFI
B)EFJ - P2JIP1
C)-P2FIP1
D)P1IM
Figure 10-1
Refer to Figure 10-1.The change in aggregate producer surplus due to a price ceiling set at P1 is area _____.
A)-EFI
B)EFJ - P2JIP1
C)-P2FIP1
D)P1IM
Unlock Deck
Unlock for access to all 96 flashcards in this deck.
Unlock Deck
k this deck
22
The following figure shows the effect of a price ceiling in the market for yams.The market was initially in equilibrium at price P2 and quantity B.
Figure 10-1
In Figure 10-1,what is the quantity of output produced after the imposition of the price ceiling at P1?
A)OA
B)OB
C)OC
D)ON
Figure 10-1
In Figure 10-1,what is the quantity of output produced after the imposition of the price ceiling at P1?
A)OA
B)OB
C)OC
D)ON
Unlock Deck
Unlock for access to all 96 flashcards in this deck.
Unlock Deck
k this deck
23
The following figure shows the effect of a price ceiling in the market for yams.The market was initially in equilibrium at price P2 and quantity B.
Figure 10-1
Refer to Figure 10-1.The aggregate consumer surplus at the initial point of equilibrium,F,is _____.
A)EFJ
B)LEJP2
C)LEP3
D)LFP2
Figure 10-1
Refer to Figure 10-1.The aggregate consumer surplus at the initial point of equilibrium,F,is _____.
A)EFJ
B)LEJP2
C)LEP3
D)LFP2
Unlock Deck
Unlock for access to all 96 flashcards in this deck.
Unlock Deck
k this deck
24
Consider two increasing-cost competitive industries (A and B)having identical supply curves.However,the demand curve faced by industry A is more inelastic than the demand curve of industry B.Which of the following is true if a per-unit excise tax is levied on the output of both the industries?
A)The consumers of industry A's product will bear a greater burden of the tax than the producers.
B)The consumers of industry A's product will bear a smaller burden of the tax than the producers.
C)The consumers of industry B's product will bear a larger burden of the tax than the consumers of industry A.
D)The consumers of industry B's product will bear the entire burden of the tax imposed on that product.
Unlock Deck
Unlock for access to all 96 flashcards in this deck.
Unlock Deck
k this deck
25
The following figure shows the effect of a price ceiling in the market for yams.The market was initially in equilibrium at price P2 and quantity B.
Figure 10-1
In Figure 10-1,the aggregate consumer surplus after a price ceiling is set at P1 is _____.
A)LFP2
B)LEP3
C)LEJP2
D)LEIP1
Figure 10-1
In Figure 10-1,the aggregate consumer surplus after a price ceiling is set at P1 is _____.
A)LFP2
B)LEP3
C)LEJP2
D)LEIP1
Unlock Deck
Unlock for access to all 96 flashcards in this deck.
Unlock Deck
k this deck
26
In the long run,the imposition of an excise tax in a constant-cost competitive industry will cause price to:
A)rise by the amount of the tax.
B)fall by the amount of the tax.
C)rise by less than the amount of the tax.
D)fall by more than the amount of the tax.
A)rise by the amount of the tax.
B)fall by the amount of the tax.
C)rise by less than the amount of the tax.
D)fall by more than the amount of the tax.
Unlock Deck
Unlock for access to all 96 flashcards in this deck.
Unlock Deck
k this deck
27
An excise tax levied on firms in a constant-cost competitive industry will:
A)increase output more in the short run than in the long run.
B)reduce output more in the long run than in the short run.
C)benefit consumers in the short run but harm them in the long run.
D)increase the product price more in the short run than in the long run.
A)increase output more in the short run than in the long run.
B)reduce output more in the long run than in the short run.
C)benefit consumers in the short run but harm them in the long run.
D)increase the product price more in the short run than in the long run.
Unlock Deck
Unlock for access to all 96 flashcards in this deck.
Unlock Deck
k this deck
28
A per-unit excise tax on a single competitive firm causes:
A)all cost curves,except the total fixed cost curve to increase by the amount of the tax.
B)all per-unit cost curves to increase by less than the amount of the tax.
C)all per-unit cost curves,except the marginal cost curve,to decrease by the amount of the tax.
D)all per-unit cost curves and the marginal cost curve to increase by the amount of the tax.
Unlock Deck
Unlock for access to all 96 flashcards in this deck.
Unlock Deck
k this deck
29
If a good is produced by an increasing-cost competitive industry and the demand for its product is elastic,the imposition of a per-unit tax on producers will cause price to _____ in the short run.
A)rise by the amount of the tax
B)fall by the amount of the tax
C)rise by less than the amount of the tax
D)fall by more than the amount of the tax
A)rise by the amount of the tax
B)fall by the amount of the tax
C)rise by less than the amount of the tax
D)fall by more than the amount of the tax
Unlock Deck
Unlock for access to all 96 flashcards in this deck.
Unlock Deck
k this deck
30
The following figure shows the effect of a price ceiling in the market for yams.The market was initially in equilibrium at price P2 and quantity B.
Figure 10-1
In Figure 10-1,the net change in total surplus due to a price ceiling set at P3 is _____.
A)EKF
B)P3KFP2
C)0
D)EFJ
Figure 10-1
In Figure 10-1,the net change in total surplus due to a price ceiling set at P3 is _____.
A)EKF
B)P3KFP2
C)0
D)EFJ
Unlock Deck
Unlock for access to all 96 flashcards in this deck.
Unlock Deck
k this deck
31
When a price ceiling is imposed on a competitive market at a level above the equilibrium price:
A)the consumer surplus is reduced.
B)producers lose some or all of the producer surplus.
C)the total surplus is not changed by the price ceiling.
D)both the producers and consumers lose surplus.
A)the consumer surplus is reduced.
B)producers lose some or all of the producer surplus.
C)the total surplus is not changed by the price ceiling.
D)both the producers and consumers lose surplus.
Unlock Deck
Unlock for access to all 96 flashcards in this deck.
Unlock Deck
k this deck
32
Presently,the United States produces as well as imports crude oil.Suppose the government imposes a $10 per barrel excise tax on imported oil.What will happen?
A)The price of oil will rise by $10;less oil will be consumed but sales of foreign producers will rise at the expense of domestic producers.
B)The price of oil will rise;less oil will be consumed but sales of domestic producers will rise at the expense of the foreign oil producers.
C)The price of oil will decline and more U.S.-produced oil will be sold in place of the heavily taxed foreign oil.
D)The price of oil will decline and more oil will be consumed but the relative shares of the oil market between the U.S.and foreign oil producers will be unchanged.
Unlock Deck
Unlock for access to all 96 flashcards in this deck.
Unlock Deck
k this deck
33
In the short run,an excise tax placed on all firms in an increasing-cost competitive industry will result in:
A)a fall in price and an increase in output.
B)an increase in output and a fall in price.
C)a fall in both price and output.
D)an increase in price and a fall in output.
A)a fall in price and an increase in output.
B)an increase in output and a fall in price.
C)a fall in both price and output.
D)an increase in price and a fall in output.
Unlock Deck
Unlock for access to all 96 flashcards in this deck.
Unlock Deck
k this deck
34
The following figure shows the effect of a price ceiling in the market for yams.The market was initially in equilibrium at price P2 and quantity B.
Figure 10-1
In Figure 10-1,the aggregate producer surplus after a price ceiling is set at P1 is area _____.
A)MFP2
B)MIEP3
C)MIJP2
D)MIP1
Figure 10-1
In Figure 10-1,the aggregate producer surplus after a price ceiling is set at P1 is area _____.
A)MFP2
B)MIEP3
C)MIJP2
D)MIP1
Unlock Deck
Unlock for access to all 96 flashcards in this deck.
Unlock Deck
k this deck
35
When a price ceiling is imposed on a competitive market at a level equal to the equilibrium price:
A)consumer surplus is increased.
B)producer surplus is increased.
C)both producer and consumer surplus is reduced.
D)total surplus remains unchanged.
A)consumer surplus is increased.
B)producer surplus is increased.
C)both producer and consumer surplus is reduced.
D)total surplus remains unchanged.
Unlock Deck
Unlock for access to all 96 flashcards in this deck.
Unlock Deck
k this deck
36
The following figure shows the effect of a price ceiling in the market for yams.The market was initially in equilibrium at price P2 and quantity B.
Figure 10-1
Refer to Figure 10-1.The change in aggregate consumer surplus due to a price ceiling set at P1 is area _____.
A)-EFJ
B)EFJ + P2JIP1
C)EFJ - P3EJP2
D)P2JIP1 - EFJ
Figure 10-1
Refer to Figure 10-1.The change in aggregate consumer surplus due to a price ceiling set at P1 is area _____.
A)-EFJ
B)EFJ + P2JIP1
C)EFJ - P3EJP2
D)P2JIP1 - EFJ
Unlock Deck
Unlock for access to all 96 flashcards in this deck.
Unlock Deck
k this deck
37
The following figure shows the effect of a price ceiling in the market for yams.The market was initially in equilibrium at price P2 and quantity B.
Figure 10-1
In Figure 10-1,the aggregate producer surplus at the initial point of equilibrium,F,is area _____.
A)P2FIP1
B)FP2M
C)MIP1
D)LP2F
Figure 10-1
In Figure 10-1,the aggregate producer surplus at the initial point of equilibrium,F,is area _____.
A)P2FIP1
B)FP2M
C)MIP1
D)LP2F
Unlock Deck
Unlock for access to all 96 flashcards in this deck.
Unlock Deck
k this deck
38
Consider two increasing cost competitive industries (A and B)having identical demand curves.However,the supply curve faced by industry A is more inelastic than the supply curve of industry B.Which of the following is true if a per-unit excise tax is levied on the output of both the industries?
A)The consumers of industry A's product will bear a greater burden of the tax than the producers.
B)The consumers of industry A's product will bear a smaller burden of the tax than the producers.
C)The consumers of industry B's product will bear a smaller burden of the tax than the consumers of industry A.
D)The consumers of industry B's product will bear the entire burden of the tax imposed on that product.
Unlock Deck
Unlock for access to all 96 flashcards in this deck.
Unlock Deck
k this deck
39
Suppose an increasing-cost competitive industry is in equilibrium at a price of $100 and an output of 1,000 units.When a price ceiling of $80 is imposed the quantity traded in the market reduces to 800 units.Which of the following is true?
A)Consumer surplus will increase and producer surplus will fall,but total surplus stays the same.
B)Consumer surplus will fall and producer surplus will increase,keeping total surplus unchanged.
C)Consumer surplus may or may not fall but producer surplus will fall.
D)Consumer surplus will remain unchanged,but producer surplus and total surplus will fall.
Unlock Deck
Unlock for access to all 96 flashcards in this deck.
Unlock Deck
k this deck
40
A given per-unit excise tax will increase the short run product price by the highest amount when:
A)demand is elastic and supply is inelastic.
B)supply is inelastic and demand is elastic.
C)demand is inelastic and supply is elastic.
D)supply is perfectly inelastic and demand is elastic.
A)demand is elastic and supply is inelastic.
B)supply is inelastic and demand is elastic.
C)demand is inelastic and supply is elastic.
D)supply is perfectly inelastic and demand is elastic.
Unlock Deck
Unlock for access to all 96 flashcards in this deck.
Unlock Deck
k this deck
41
The U.S.airline industry,prior to deregulation,was characterized by _____.
A)excessive profits
B)a high level of efficiency
C)excess demand
D)nonprice competition
A)excessive profits
B)a high level of efficiency
C)excess demand
D)nonprice competition
Unlock Deck
Unlock for access to all 96 flashcards in this deck.
Unlock Deck
k this deck
42
One of the reasons for the low profitability of U.S.airlines during the era of regulation by the Civil Aeronautics Board (CAB)was _____.
A)the absence of organized labor unions
B)low airline safety
C)the scheduling of airline flights to sparsely populated areas
D)the price ceiling imposed by the CAB
A)the absence of organized labor unions
B)low airline safety
C)the scheduling of airline flights to sparsely populated areas
D)the price ceiling imposed by the CAB
Unlock Deck
Unlock for access to all 96 flashcards in this deck.
Unlock Deck
k this deck
43
The Civil Aeronautics Board (CAB)allowed airlines to charge prices above the equilibrium price.Even then the airlines were not profitable because:
A)their economic profits were zero.
B)nonprice competition between the airlines raised costs and eroded profits.
C)the demand was too low to make profit.
D)they were subject to heavy taxes by the government which drove down profits.
A)their economic profits were zero.
B)nonprice competition between the airlines raised costs and eroded profits.
C)the demand was too low to make profit.
D)they were subject to heavy taxes by the government which drove down profits.
Unlock Deck
Unlock for access to all 96 flashcards in this deck.
Unlock Deck
k this deck
44
Although U.S.airline fares fell significantly after deregulation,profits did not fall.This was because:
A)the airline industry is a decreasing cost industry.
B)the airlines reduced costs by lowering wages to workers.
C)the demand for air travel did not increase by a significant percentage.
D)the airlines received subsidies from the federal government.
A)the airline industry is a decreasing cost industry.
B)the airlines reduced costs by lowering wages to workers.
C)the demand for air travel did not increase by a significant percentage.
D)the airlines received subsidies from the federal government.
Unlock Deck
Unlock for access to all 96 flashcards in this deck.
Unlock Deck
k this deck
45
Deregulation of the airline industry has resulted in:
A)a reduction in the number of airline passengers.
B)a reduction in the wages and salaries in the airline industry.
C)an increase in airfares.
D)a rapid expansion of airport capacity.
A)a reduction in the number of airline passengers.
B)a reduction in the wages and salaries in the airline industry.
C)an increase in airfares.
D)a rapid expansion of airport capacity.
Unlock Deck
Unlock for access to all 96 flashcards in this deck.
Unlock Deck
k this deck
46
A contestable market is one in which:
A)a small number of firms operate,keeping price above marginal cost.
B)the market price is independent of the number of firms.
C)the price in the market depends upon the number of firms because entry is free.
D)the lack of barriers to entry causes price to remain low.
A)a small number of firms operate,keeping price above marginal cost.
B)the market price is independent of the number of firms.
C)the price in the market depends upon the number of firms because entry is free.
D)the lack of barriers to entry causes price to remain low.
Unlock Deck
Unlock for access to all 96 flashcards in this deck.
Unlock Deck
k this deck
47
Suppose the government limits the number of cabs that can operate in the city by issuing a limited number of medallions.Later,if the government decides to regulate fares instead and sets them below current levels:
A)surpluses will result in the taxicab market.
B)the resale value of the medallion will fall.
C)the demand for taxicabs will decline.
D)congestion during peak traffic hours will decrease.
A)surpluses will result in the taxicab market.
B)the resale value of the medallion will fall.
C)the demand for taxicabs will decline.
D)congestion during peak traffic hours will decrease.
Unlock Deck
Unlock for access to all 96 flashcards in this deck.
Unlock Deck
k this deck
48
A rent control has been imposed on the market for rental housing in a country.If the long run supply curve in this competitive market is more price elastic than the short run supply curve,it implies that:
A)the deadweight loss of the rent control is higher in the long run compared to the short run.
B)the deadweight loss of the rent control is higher in the short run compared to the long run.
C)the deadweight loss of the rent control is zero in the long run.
D)the deadweight loss of the rent control is zero in the short run.
Unlock Deck
Unlock for access to all 96 flashcards in this deck.
Unlock Deck
k this deck
49
If a commodity has a(n)_____,a greater share of the burden of an excise tax levied on the commodity would be borne by the producers.
A)relatively elastic supply curve and a perfectly inelastic demand curve
B)perfectly elastic supply curve
C)relatively inelastic demand curve and a relatively elastic supply curve
D)perfectly elastic demand curve
A)relatively elastic supply curve and a perfectly inelastic demand curve
B)perfectly elastic supply curve
C)relatively inelastic demand curve and a relatively elastic supply curve
D)perfectly elastic demand curve
Unlock Deck
Unlock for access to all 96 flashcards in this deck.
Unlock Deck
k this deck
50
Issuing a fixed number of licenses to operate a taxicab in a city would mean that the number of:
A)cabs and fares are both above the efficient level.
B)cabs is less than the efficient quantity and fares are above free-market levels.
C)cabs is above the efficient level and fares are depressed below the free-market level.
D)cabs and fares are both below the efficient level.
A)cabs and fares are both above the efficient level.
B)cabs is less than the efficient quantity and fares are above free-market levels.
C)cabs is above the efficient level and fares are depressed below the free-market level.
D)cabs and fares are both below the efficient level.
Unlock Deck
Unlock for access to all 96 flashcards in this deck.
Unlock Deck
k this deck
51
Restrictions on entry in the taxicab market tends to benefit _____ the most.
A)the government
B)original recipients of medallions
C)current taxicab drivers
D)taxicab passengers
A)the government
B)original recipients of medallions
C)current taxicab drivers
D)taxicab passengers
Unlock Deck
Unlock for access to all 96 flashcards in this deck.
Unlock Deck
k this deck
52
Which of the following is true of deregulation and airline safety in the U.S.?
A)Airline safety has deteriorated since the deregulation of the airline industry because safety standards are determined by the airlines themselves.
B)Airline safety has deteriorated since airline deregulation because increased competition does not give airlines any incentive to reduce the number of accidents.
C)Since airline safety standards are set by a government agency,deregulation of routes and fares is not directly linked to airline safety.
D)Airline safety has increased post-deregulation because airlines are now not required to insure their aircrafts against accidents.
Unlock Deck
Unlock for access to all 96 flashcards in this deck.
Unlock Deck
k this deck
53
When the U.S.airline industry was regulated by the Civil Aeronautics Board (CAB),airline workers' unions:
A)did not benefit since the airlines were unprofitable and could not pay high wages.
B)negotiated higher-than-competitive fares from the airlines.
C)received lesser pay than what they received after deregulation.
D)were not organized and so did not have any bargaining power.
A)did not benefit since the airlines were unprofitable and could not pay high wages.
B)negotiated higher-than-competitive fares from the airlines.
C)received lesser pay than what they received after deregulation.
D)were not organized and so did not have any bargaining power.
Unlock Deck
Unlock for access to all 96 flashcards in this deck.
Unlock Deck
k this deck
54
Rent controls in the rental housing market:
A)will lead to the deterioration of the quality of rental housing.
B)will not significantly affect supply in the long run.
C)does not have any adverse effects in the short run.
D)benefits tenants but not landlords.
A)will lead to the deterioration of the quality of rental housing.
B)will not significantly affect supply in the long run.
C)does not have any adverse effects in the short run.
D)benefits tenants but not landlords.
Unlock Deck
Unlock for access to all 96 flashcards in this deck.
Unlock Deck
k this deck
55
If a commodity has a(n)_____,a greater share of the burden of an excise tax levied on the commodity would be borne by the consumers.
A)perfectly elastic demand curve and an elastic supply curve
B)perfectly elastic demand curve and perfectly inelastic supply curve
C)relatively inelastic supply curve
D)perfectly inelastic demand curve
A)perfectly elastic demand curve and an elastic supply curve
B)perfectly elastic demand curve and perfectly inelastic supply curve
C)relatively inelastic supply curve
D)perfectly inelastic demand curve
Unlock Deck
Unlock for access to all 96 flashcards in this deck.
Unlock Deck
k this deck
56
An excise tax imposed on junk food reduces consumer surplus by $50,producer surplus by $80,and results in tax revenue of $40 for the government.What is the welfare effect of this tax?
A)A net loss of $10
B)A net gain of $40
C)A net loss of $90
D)A net loss of $130
A)A net loss of $10
B)A net gain of $40
C)A net loss of $90
D)A net loss of $130
Unlock Deck
Unlock for access to all 96 flashcards in this deck.
Unlock Deck
k this deck
57
Which of the following strengthens the possibility that the airline market is a contestable market?
A)Since other airlines can enter the market at no cost and charge lower fares,the fare charged by a single airline is always equal to the marginal cost.
B)The barriers to entry in the airline market lead to nonprice competition between the airlines operating in the market.
C)The fares that are charged for routes with more than one airline are significantly higher than the fares charged for a route with only one airline.
D)Airlines regularly charge fares that are above the competitive levels irrespective of the number of airlines plying a particular route.
Unlock Deck
Unlock for access to all 96 flashcards in this deck.
Unlock Deck
k this deck
58
Suppose a city limits the number of cabs that can provide taxi service by issuing medallions. If the medallions can be bought and sold and they command a positive price,you can conclude that:
A)fares are above the competitive levels.
B)no illegal cabs will operate in the city.
C)the demand for cabs is lesser than the supply of cabs.
D)the supply curve for taxicabs is horizontal.
A)fares are above the competitive levels.
B)no illegal cabs will operate in the city.
C)the demand for cabs is lesser than the supply of cabs.
D)the supply curve for taxicabs is horizontal.
Unlock Deck
Unlock for access to all 96 flashcards in this deck.
Unlock Deck
k this deck
59
For an excise tax which causes output in a market to fall to zero:
A)the tax revenue and deadweight loss are both zero.
B)the tax revenue is positive but there is no deadweight loss.
C)the deadweight loss is equal to the total surplus before the tax.
D)the deadweight loss is equal to the producer's surplus.
A)the tax revenue and deadweight loss are both zero.
B)the tax revenue is positive but there is no deadweight loss.
C)the deadweight loss is equal to the total surplus before the tax.
D)the deadweight loss is equal to the producer's surplus.
Unlock Deck
Unlock for access to all 96 flashcards in this deck.
Unlock Deck
k this deck
60
How do price ceilings in the rental housing market affect tenants?
A)Since price ceilings keep rents from rising above a certain level,the net gain to tenants is positive.
B)Tenants are worse off from price ceilings since the supply of rental housing falls in the long run.
C)Tenants benefit from price ceilings since landlords have incentives to improve the quality of existing rental housing
D)Since the supply of rental housing is inelastic in the short run,tenants are not affected by a price ceiling.
Unlock Deck
Unlock for access to all 96 flashcards in this deck.
Unlock Deck
k this deck
61
The following figure shows the demand and supply for a commodity in the domestic U.S.market as well as the global market.The commodity is imported from the rest of the world to the U.S.market.
Figure 10-3
In Figure 10-3,the total producer surplus after trade is _____.
A)P3ELP2
B)ELK
C)P2LP0
D)P2LMP1
Figure 10-3
In Figure 10-3,the total producer surplus after trade is _____.
A)P3ELP2
B)ELK
C)P2LP0
D)P2LMP1
Unlock Deck
Unlock for access to all 96 flashcards in this deck.
Unlock Deck
k this deck
62
Deregulation of the taxicab industry is most likely to result in:
A)an increase in the operation of illegal cabs.
B)reduced safety of passengers.
C)a shift of taxicab services from poor neighborhoods to the city.
D)a large financial loss for those who own medallions.
A)an increase in the operation of illegal cabs.
B)reduced safety of passengers.
C)a shift of taxicab services from poor neighborhoods to the city.
D)a large financial loss for those who own medallions.
Unlock Deck
Unlock for access to all 96 flashcards in this deck.
Unlock Deck
k this deck
63
In which of the following cases is it likely that the entire U.S.domestic demand for corn is met through imports?
A)The price of corn in the rest of the world is equal to the domestic price of corn in the U.S.
B)The uniform world price of corn is less than the minimum price at which the U.S.producers are willing to supply.
C)The price of corn in the rest of the world exceeds the domestic U.S.price of corn.
D)The uniform world price of corn exceeds the cost of U.S.production of corn.
Unlock Deck
Unlock for access to all 96 flashcards in this deck.
Unlock Deck
k this deck
64
The following figure shows the demand and supply for a commodity in the domestic U.S.market as well as the global market.The commodity is imported from the rest of the world to the U.S.market.
Figure 10-3
Refer to Figure 10-3.The total producer surplus prior to trade was _____.
A)P3EP0
B)P2LP0
C)P1MP0
D)P3EMP1
Figure 10-3
Refer to Figure 10-3.The total producer surplus prior to trade was _____.
A)P3EP0
B)P2LP0
C)P1MP0
D)P3EMP1
Unlock Deck
Unlock for access to all 96 flashcards in this deck.
Unlock Deck
k this deck
65
The following figure shows the intersection of the demand and supply curves for a commodity in the domestic market at price P2 and quantity Q2,in the absence of trade.With trade,the supply curve shifts to Supplytrade.
Figure 10-4
Refer to Figure 10-4.In the absence of trade,the total consumer surplus is given by _____.
A)a + b + c + g + f
B)a + b + c + d
C)d + b + c
D)a + b + c
Figure 10-4
Refer to Figure 10-4.In the absence of trade,the total consumer surplus is given by _____.
A)a + b + c + g + f
B)a + b + c + d
C)d + b + c
D)a + b + c
Unlock Deck
Unlock for access to all 96 flashcards in this deck.
Unlock Deck
k this deck
66
The following figure shows the intersection of the demand and supply curves for a commodity in the domestic market at price P2 and quantity Q2,in the absence of trade.With trade,the supply curve shifts to Supplytrade.
Figure 10-4
Refer to Figure 10-4.The quantity of imports into the domestic market is given by _____.
A)Q2 - Q1
B)Q3 - Q2
C)Q3 - Q1
D)Q3
Figure 10-4
Refer to Figure 10-4.The quantity of imports into the domestic market is given by _____.
A)Q2 - Q1
B)Q3 - Q2
C)Q3 - Q1
D)Q3
Unlock Deck
Unlock for access to all 96 flashcards in this deck.
Unlock Deck
k this deck
67
The following figure shows the demand and supply for a commodity in the domestic U.S.market as well as the global market.The commodity is imported from the rest of the world to the U.S.market.
Figure 10-3
In Figure 10-3,trade increases consumer surplus in the U.S.by _____.
A)P3EKP2
B)P3EP0
C)EKL
D)P2LMP1
Figure 10-3
In Figure 10-3,trade increases consumer surplus in the U.S.by _____.
A)P3EKP2
B)P3EP0
C)EKL
D)P2LMP1
Unlock Deck
Unlock for access to all 96 flashcards in this deck.
Unlock Deck
k this deck
68
The Candlemakers' petition was a satire of protectionism written and published in 1845.In the petition,candlemakers advocated that all businesses should shut their blinds and curtains and block all sunlight from entering their buildings.Although satirical,which of the following would be expected to take place if this policy were implemented?
A)The net effect on employment would be negative since the demand for candles would decrease the number of jobs associated with the candlemaking industry.
B)Since consumers would have to spend a larger proportion of their income on candles than before,the net effect of this policy would be to reduce spending on other domestic goods.
C)Domestic citizens would be better off because it would increase consumer surplus.
D)Although sunlight is a free alternative to candlelight during the daytime,a policy to block sunlight would productively allocate resources to domestic industries.
Unlock Deck
Unlock for access to all 96 flashcards in this deck.
Unlock Deck
k this deck
69
The following figure shows the intersection of the demand and supply curves for a commodity in the domestic market at price P2 and quantity Q2,in the absence of trade.With trade,the supply curve shifts to Supplytrade.
Figure 10-4
Refer to Figure 10-4.When foreign suppliers enter the domestic market the total consumer surplus becomes _____.
A)a + b + c + d
B)a + b + c + f + g + h
C)a + b + c + f + g + j
D)a + b + c + f + g + h + i
Figure 10-4
Refer to Figure 10-4.When foreign suppliers enter the domestic market the total consumer surplus becomes _____.
A)a + b + c + d
B)a + b + c + f + g + h
C)a + b + c + f + g + j
D)a + b + c + f + g + h + i
Unlock Deck
Unlock for access to all 96 flashcards in this deck.
Unlock Deck
k this deck
70
The following figure shows the intersection of the demand and supply curves for a commodity in the domestic market at price P2 and quantity Q2,in the absence of trade.With trade,the supply curve shifts to Supplytrade.
Figure 10-4
Refer to Figure 10-4.In the absence of trade,the total producer surplus is given by _____.
A)f + g + j
B)f + g + h + j
C)f + g + h + i
D)f + g + h + i + j
Figure 10-4
Refer to Figure 10-4.In the absence of trade,the total producer surplus is given by _____.
A)f + g + j
B)f + g + h + j
C)f + g + h + i
D)f + g + h + i + j
Unlock Deck
Unlock for access to all 96 flashcards in this deck.
Unlock Deck
k this deck
71
The following figure shows the domestic U.S.market for bananas and the global market for bananas.The domestic supply curve is given by SUPPLYUS.With free trade,the equilibrium output in the U.S.market is Q.The import quota imposed by the government is equal to 0A.
Figure 10-5
Refer to Figure 10-5.Which of the following should necessarily be true?
A)FG = BC
B)0D = EH
C)EH = 0C + CQ
D)BC = EF
Figure 10-5
Refer to Figure 10-5.Which of the following should necessarily be true?
A)FG = BC
B)0D = EH
C)EH = 0C + CQ
D)BC = EF
Unlock Deck
Unlock for access to all 96 flashcards in this deck.
Unlock Deck
k this deck
72
In 2002,the U.S.imposed higher tariffs on steel imports to save American jobs.How did these tariffs reduce U.S exports?
A)The dollars that foreigners could have earned on U.S.imports decreased,thus reducing U.S.exports.
B)The tariffs led to lower imports of steel,a depreciation of the dollar,and consequently lower U.S.exports.
C)The country's trading partners have always imposed high tariffs on their own imports.
D)The tariffs increased domestic inflation leading to a depreciation of the dollar and consequently,lower U.S.exports.
Unlock Deck
Unlock for access to all 96 flashcards in this deck.
Unlock Deck
k this deck
73
The following figure shows the demand and supply for a commodity in the domestic U.S.market as well as the global market.The commodity is imported from the rest of the world to the U.S.market.
Figure 10-3
Refer to Figure 10-3.In the absence of trade,the equilibrium price in the U.S.market is _____.
A)P3
B)P2
C)P1
D)P0
Figure 10-3
Refer to Figure 10-3.In the absence of trade,the equilibrium price in the U.S.market is _____.
A)P3
B)P2
C)P1
D)P0
Unlock Deck
Unlock for access to all 96 flashcards in this deck.
Unlock Deck
k this deck
74
The following figure shows the intersection of the demand and supply curves for a commodity in the domestic market at price P2 and quantity Q2,in the absence of trade.With trade,the supply curve shifts to Supplytrade.
Figure 10-4
Refer to Figure 10-4.The net gain to domestic residents when they trade with foreign suppliers is represented by _____.
A)d + e
B)h + i
C)k + l + m
D)f + g + j
Figure 10-4
Refer to Figure 10-4.The net gain to domestic residents when they trade with foreign suppliers is represented by _____.
A)d + e
B)h + i
C)k + l + m
D)f + g + j
Unlock Deck
Unlock for access to all 96 flashcards in this deck.
Unlock Deck
k this deck
75
The following figure shows the demand and supply for a commodity in the domestic U.S.market as well as the global market.The commodity is imported from the rest of the world to the U.S.market.
Figure 10-3
In Figure 10-3,the net gain to the U.S.from trade is _____.
A)P3EP0
B)P3ELP2
C)P4EP0
D)ELK
Figure 10-3
In Figure 10-3,the net gain to the U.S.from trade is _____.
A)P3EP0
B)P3ELP2
C)P4EP0
D)ELK
Unlock Deck
Unlock for access to all 96 flashcards in this deck.
Unlock Deck
k this deck
76
In 2002,the U.S.imposed higher tariffs on steel imports to save American jobs.However,the 30 percent increase in tariffs on steel imports imposed a net job loss on the U.S.in part because:
A)the substitution effect of the tax led consumers to buy more of other domestic goods.
B)the tariff led to the depreciation of the dollar and an increase in exports.
C)consumers spent less on other goods as a result of higher steel prices.
D)the tariff was not high enough to sustain employment in the American steel industry.
Unlock Deck
Unlock for access to all 96 flashcards in this deck.
Unlock Deck
k this deck
77
The following figure shows the demand and supply for a commodity in the domestic U.S.market as well as the global market.The commodity is imported from the rest of the world to the U.S.market.
Figure 10-3
Refer to Figure 10-3.The total consumer surplus prior to trade was _____.
A)P4EP3
B)P4KP2
C)P4ELP2
D)P3EP0
Figure 10-3
Refer to Figure 10-3.The total consumer surplus prior to trade was _____.
A)P4EP3
B)P4KP2
C)P4ELP2
D)P3EP0
Unlock Deck
Unlock for access to all 96 flashcards in this deck.
Unlock Deck
k this deck
78
The following figure shows the demand and supply for a commodity in the domestic U.S.market as well as the global market.The commodity is imported from the rest of the world to the U.S.market.
Figure 10-3
In Figure 10-3,for the rest of the world:
A)the gain in producer surplus equals the gain in consumer surplus.
B)producer surplus increases while consumer surplus is unchanged.
C)the gain in consumer surplus is greater than the gain in producer surplus.
D)there are no changes in consumer or producer surplus after trade.
Unlock Deck
Unlock for access to all 96 flashcards in this deck.
Unlock Deck
k this deck
79
Which of the following is true of international trade?
A)Free international trade benefits foreign producers at the cost of domestic industry.
B)The net gain to a country from free international trade is positive.
C)The proportion of international trade in the world is on the decline.
D)Free trade is a zero-sum game;one nation gains at another's expense.
Unlock Deck
Unlock for access to all 96 flashcards in this deck.
Unlock Deck
k this deck
80
Suppose there is a city which licenses cabs,but cab owners find they cannot get anyone to buy their medallions at any price.You can conclude that:
A)selling medallions is illegal.
B)cab owners are making a normal profit.
C)cab fares are higher than the efficient level.
D)the number of licenses issued are limited.
A)selling medallions is illegal.
B)cab owners are making a normal profit.
C)cab fares are higher than the efficient level.
D)the number of licenses issued are limited.
Unlock Deck
Unlock for access to all 96 flashcards in this deck.
Unlock Deck
k this deck
Unlock Deck
Unlock for access to all 96 flashcards in this deck.


