Deck 14: Time Series Analysis
Full screen (f)
Question
Question
Question
Question
Question
Question
Question
Question
Question
Question
Question
Question
Question
Question
Question
Question
Question
Question
Question
Question
Question
Question
Question
Question
Question
Question
Question
Question
Question
Question
Question
Question
Question
Question
Question
Question
Question
Question
Question
Question
Question
Question
Which statement is most defensible regarding the time series shown below? 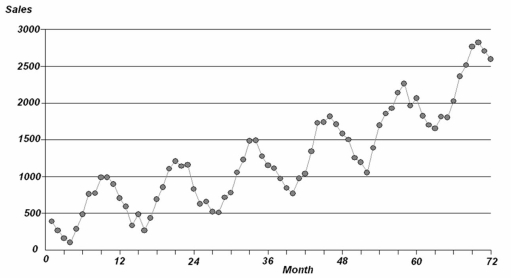
A)There appears to be strong seasonality.
B)There appears to be a six-month seasonal cycle.
C)The trend appears to be exponential.
D)The quadratic trend would be required.
A)There appears to be strong seasonality.
B)There appears to be a six-month seasonal cycle.
C)The trend appears to be exponential.
D)The quadratic trend would be required.
Question
Question
Question
Question
Question
Question
Might it be OK to use exponential smoothing to forecast 2010 for Bob's data? 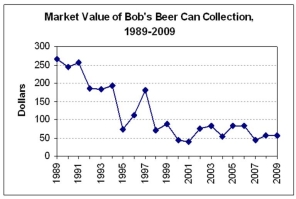
A)No, under no circumstances
B)Yes, if you use only the most recent 10 years
C)Yes, if you need a long-term forecast
D)No, since the data appear to be erratic
A)No, under no circumstances
B)Yes, if you use only the most recent 10 years
C)Yes, if you need a long-term forecast
D)No, since the data appear to be erratic
Question
Which trend would you choose to forecast the number of tractors sold in 2010? 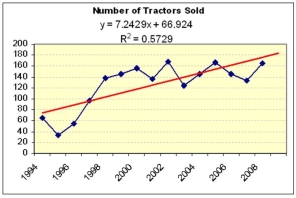
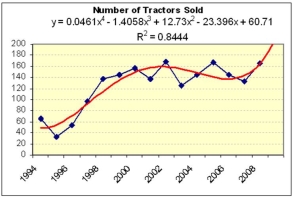
A)Linear model.
B)Polynomial model.
C)The forecasts are equivalent.
A)Linear model.
B)Polynomial model.
C)The forecasts are equivalent.
Question
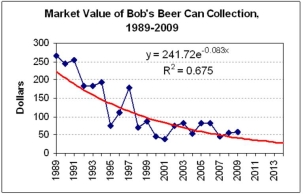
Which trend would you choose to forecast the 2013 value of Bob's beer can collection? 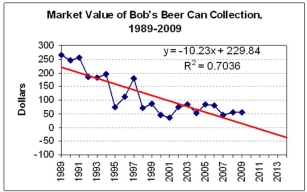
A)Linear model.
B)Exponential model.
C)They are equivalent.
A)Linear model.
B)Exponential model.
C)They are equivalent.
Question
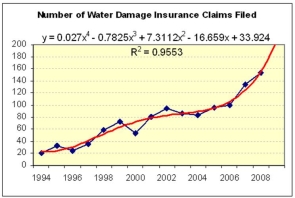
Which trend would you choose to forecast the number of water damage claims in 2010? 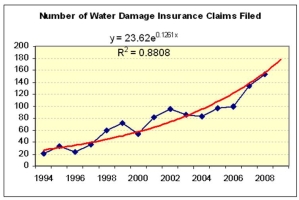
A)Exponential model.
B)Polynomial model.
C)They are equivalent.
A)Exponential model.
B)Polynomial model.
C)They are equivalent.
Question
Question
Question
Question
Question
Question
Question
Question
What is the approximate slope of a linear trend for the value of Bob's beer can collection? 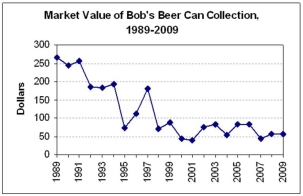
A)-25
B)-50
C)-15
D)-10
A)-25
B)-50
C)-15
D)-10
Question
Which trend would you choose to forecast the 2013 value of Bob's beer can collection? 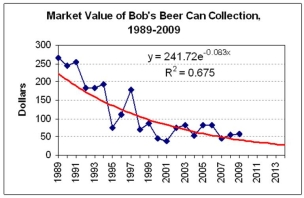
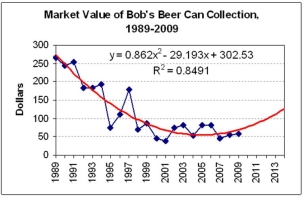
A)Exponential model.
B)Quadratic model.
C)They are equivalent.
A)Exponential model.
B)Quadratic model.
C)They are equivalent.
Question
Question
Question
Question
Question
Question
Question
Question
Question
Question
Question
Question
Question
Question
Question
Question
Question
Question
Question
Question

Unlock Deck
Sign up to unlock the cards in this deck!
Unlock Deck
Unlock Deck
1/114
Play
Full screen (f)
Deck 14: Time Series Analysis
1
An exponential trend can have a turning point (peak or trough).
False
2
Multiplicative models are avoided in business because they are too complicated.
False
3
Multiplicative models are most appropriate over longer periods of time or when the data magnitude is growing rapidly over time.
True
4
Additive models are most appropriate over longer periods of time or when the data magnitude is growing rapidly over time.
Unlock Deck
Unlock for access to all 114 flashcards in this deck.
Unlock Deck
k this deck
5
The shape of the fitted quadratic model yt = 544 + 62t - 3.2t2 is declining, then rising.
Unlock Deck
Unlock for access to all 114 flashcards in this deck.
Unlock Deck
k this deck
6
Over the short run, exponential and linear trends may look alike.
Unlock Deck
Unlock for access to all 114 flashcards in this deck.
Unlock Deck
k this deck
7
The shape of the fitted quadratic model yt = 823 + 72t - 5.1t2 is rising, then declining.
Unlock Deck
Unlock for access to all 114 flashcards in this deck.
Unlock Deck
k this deck
8
The shape of the fitted quadratic model yt = 324 - 42t - 1.3t2 is declining, then rising.
Unlock Deck
Unlock for access to all 114 flashcards in this deck.
Unlock Deck
k this deck
9
Exponential smoothing and moving averages are especially useful for data with a clear trend.
Unlock Deck
Unlock for access to all 114 flashcards in this deck.
Unlock Deck
k this deck
10
The linear model's R2 may exceed the quadratic model's R2 fitted to the same data.
Unlock Deck
Unlock for access to all 114 flashcards in this deck.
Unlock Deck
k this deck
11
An exponential trend allows growth but cannot be used if the time series is declining.
Unlock Deck
Unlock for access to all 114 flashcards in this deck.
Unlock Deck
k this deck
12
Moving average models are causal models (as opposed to time-series models).
Unlock Deck
Unlock for access to all 114 flashcards in this deck.
Unlock Deck
k this deck
13
A firm's balance sheet contains data measured over a period of time, as opposed to being measured at a point in time.
Unlock Deck
Unlock for access to all 114 flashcards in this deck.
Unlock Deck
k this deck
14
The shape of the fitted exponential model yt = 256e-.07t is always declining.
Unlock Deck
Unlock for access to all 114 flashcards in this deck.
Unlock Deck
k this deck
15
A firm's income statement contains data measured over a period of time, as opposed to being measured at a point in time.
Unlock Deck
Unlock for access to all 114 flashcards in this deck.
Unlock Deck
k this deck
16
The quadratic model can never have more than one turning point (peaks or troughs).
Unlock Deck
Unlock for access to all 114 flashcards in this deck.
Unlock Deck
k this deck
17
The quadratic model's R2 is always at least as high as the linear model fitted to the same data.
Unlock Deck
Unlock for access to all 114 flashcards in this deck.
Unlock Deck
k this deck
18
Cycles are usually ignored because there is no general theory to describe them.
Unlock Deck
Unlock for access to all 114 flashcards in this deck.
Unlock Deck
k this deck
19
A multiplicative time-series model Y = T × C × S × I becomes an additive model if we take the logarithm of each side of the equation.
Unlock Deck
Unlock for access to all 114 flashcards in this deck.
Unlock Deck
k this deck
20
Seasonality is usually ignored because there is no statistical way to describe it.
Unlock Deck
Unlock for access to all 114 flashcards in this deck.
Unlock Deck
k this deck
21
Moving averages are most useful for irregular data with no clear trend.
Unlock Deck
Unlock for access to all 114 flashcards in this deck.
Unlock Deck
k this deck
22
Increasing the smoothing constant α increases the weight assigned to the most recent observation.
Unlock Deck
Unlock for access to all 114 flashcards in this deck.
Unlock Deck
k this deck
23
The smoothing constant α indicates the weight assigned to the most recent forecast.
Unlock Deck
Unlock for access to all 114 flashcards in this deck.
Unlock Deck
k this deck
24
Over long periods of time, multiplicative time-series models may be favored over additive time-series models, because the data magnitude often changes over time.
Unlock Deck
Unlock for access to all 114 flashcards in this deck.
Unlock Deck
k this deck
25
Averaging the first six data values is a way of initializing the forecasts in an exponential smoothing process.
Unlock Deck
Unlock for access to all 114 flashcards in this deck.
Unlock Deck
k this deck
26
The shape of the fitted exponential model yt = 256e-.07t is rising at first, then declining.
Unlock Deck
Unlock for access to all 114 flashcards in this deck.
Unlock Deck
k this deck
27
Occam's Razor says always to choose the simplest model.
Unlock Deck
Unlock for access to all 114 flashcards in this deck.
Unlock Deck
k this deck
28
Moving averages are often used for making long-term forecasts (e.g., five periods ahead).
Unlock Deck
Unlock for access to all 114 flashcards in this deck.
Unlock Deck
k this deck
29
The exponential model would be attractive for analyzing a growing company's revenues over time.
Unlock Deck
Unlock for access to all 114 flashcards in this deck.
Unlock Deck
k this deck
30
A higher value of the smoothing constant α makes the forecast less responsive to recent data.
Unlock Deck
Unlock for access to all 114 flashcards in this deck.
Unlock Deck
k this deck
31
Regression analysis can be used for forecasting monthly time-series data using a trend variable and 11 binary predictors (one for each month except omitting one month).
Unlock Deck
Unlock for access to all 114 flashcards in this deck.
Unlock Deck
k this deck
32
In exponential smoothing, using α = .20 will give a smoother series than using α = .05.
Unlock Deck
Unlock for access to all 114 flashcards in this deck.
Unlock Deck
k this deck
33
An attraction of MAPE as a measure of fit is its simple interpretation.
Unlock Deck
Unlock for access to all 114 flashcards in this deck.
Unlock Deck
k this deck
34
Monthly seasonal factors should be adjusted so they sum to 12.
Unlock Deck
Unlock for access to all 114 flashcards in this deck.
Unlock Deck
k this deck
35
A centered moving average provides good forecasts when there is a strong upward trend in the data.
Unlock Deck
Unlock for access to all 114 flashcards in this deck.
Unlock Deck
k this deck
36
The MAD measures the average absolute size of the forecast error.
Unlock Deck
Unlock for access to all 114 flashcards in this deck.
Unlock Deck
k this deck
37
Using the first observed data value is a common way of initializing the forecasts in the exponential smoothing model.
Unlock Deck
Unlock for access to all 114 flashcards in this deck.
Unlock Deck
k this deck
38
Quarterly seasonal factors will sum to 4.
Unlock Deck
Unlock for access to all 114 flashcards in this deck.
Unlock Deck
k this deck
39
The shape of the fitted quadratic model yt = 248 - 84t + 2.4t2 is declining, then rising.
Unlock Deck
Unlock for access to all 114 flashcards in this deck.
Unlock Deck
k this deck
40
In exponential smoothing, using α = .20 will provide less smoothing than using α = .10.
Unlock Deck
Unlock for access to all 114 flashcards in this deck.
Unlock Deck
k this deck
41
Suppose the estimated quadratic model yt = 500 + 20t - t2 is the best-fitting trend of sales of XYZ Inc. using data for the past 20 years (t = 1, 2, …, 20). Which statement is incorrect?
A)Sales are increasing by about 20 units per year.
B)The turning point would be in period 10.
C)Latest year sales are no better than in year zero.
D)The trend was higher in year 10 than in year 20.
A)Sales are increasing by about 20 units per year.
B)The turning point would be in period 10.
C)Latest year sales are no better than in year zero.
D)The trend was higher in year 10 than in year 20.
Unlock Deck
Unlock for access to all 114 flashcards in this deck.
Unlock Deck
k this deck
42
Which statement is most defensible regarding the time series shown below?
A)There appears to be strong seasonality.
B)There appears to be a six-month seasonal cycle.
C)The trend appears to be exponential.
D)The quadratic trend would be required.
A)There appears to be strong seasonality.
B)There appears to be a six-month seasonal cycle.
C)The trend appears to be exponential.
D)The quadratic trend would be required.
Unlock Deck
Unlock for access to all 114 flashcards in this deck.
Unlock Deck
k this deck
43
In the model yt = 516 - 42t + 3t2 the turning point:
A)is a peak.
B)is a trough.
C)could be either a peak or a trough.
D)is neither a peak nor a trough.
A)is a peak.
B)is a trough.
C)could be either a peak or a trough.
D)is neither a peak nor a trough.
Unlock Deck
Unlock for access to all 114 flashcards in this deck.
Unlock Deck
k this deck
44
The time-series model Y = T × C × S × I:
A)is an additive model.
B)is a multiplicative model.
C)is an exponential model.
D)is a polynomial model.
A)is an additive model.
B)is a multiplicative model.
C)is an exponential model.
D)is a polynomial model.
Unlock Deck
Unlock for access to all 114 flashcards in this deck.
Unlock Deck
k this deck
45
If the trend model yt = a + bt + ct² is fitted to a time series, we would get:
A)R² that could be lower than the linear model.
B)R² that could be either higher or lower than the linear model.
C)R² that is at least as high as the linear model.
D)no R² for this type of model because it is nonlinear.
A)R² that could be lower than the linear model.
B)R² that could be either higher or lower than the linear model.
C)R² that is at least as high as the linear model.
D)no R² for this type of model because it is nonlinear.
Unlock Deck
Unlock for access to all 114 flashcards in this deck.
Unlock Deck
k this deck
46
If a fitted trend equation is yt = 120 - 40t + 2.5t2, then the turning point will be:
A)a peak in period 40.
B)a trough in period 5.
C)a peak in period 4.
D)a trough in period 8.
A)a peak in period 40.
B)a trough in period 5.
C)a peak in period 4.
D)a trough in period 8.
Unlock Deck
Unlock for access to all 114 flashcards in this deck.
Unlock Deck
k this deck
47
The implied turning point (peak or trough) of yt = 516 - 42t + 3t2 would be in which period? Hint: Use calculus to solve for the value of t that would maximize or minimize yt.
A)t = 7
B)t = -7
C)t = 6
D)t = -42
A)t = 7
B)t = -7
C)t = 6
D)t = -42
Unlock Deck
Unlock for access to all 114 flashcards in this deck.
Unlock Deck
k this deck
48
Might it be OK to use exponential smoothing to forecast 2010 for Bob's data?
A)No, under no circumstances
B)Yes, if you use only the most recent 10 years
C)Yes, if you need a long-term forecast
D)No, since the data appear to be erratic
A)No, under no circumstances
B)Yes, if you use only the most recent 10 years
C)Yes, if you need a long-term forecast
D)No, since the data appear to be erratic
Unlock Deck
Unlock for access to all 114 flashcards in this deck.
Unlock Deck
k this deck
49
Which trend would you choose to forecast the number of tractors sold in 2010?
A)Linear model.
B)Polynomial model.
C)The forecasts are equivalent.
A)Linear model.
B)Polynomial model.
C)The forecasts are equivalent.
Unlock Deck
Unlock for access to all 114 flashcards in this deck.
Unlock Deck
k this deck
50
Which trend would you choose to forecast the 2013 value of Bob's beer can collection?
A)Linear model.
B)Exponential model.
C)They are equivalent.
A)Linear model.
B)Exponential model.
C)They are equivalent.
Unlock Deck
Unlock for access to all 114 flashcards in this deck.
Unlock Deck
k this deck
51
Which trend would you choose to forecast the number of water damage claims in 2010?
A)Exponential model.
B)Polynomial model.
C)They are equivalent.
A)Exponential model.
B)Polynomial model.
C)They are equivalent.
Unlock Deck
Unlock for access to all 114 flashcards in this deck.
Unlock Deck
k this deck
52
If the fitted annual trend for a stock price is yt = 27e0.213t, then:
A)the slow growth rate is not very attractive.
B)the stock price seems to be approaching an asymptote.
C)the stock is probably undervalued in today's markets.
D)the stock would more than double every four years.
A)the slow growth rate is not very attractive.
B)the stock price seems to be approaching an asymptote.
C)the stock is probably undervalued in today's markets.
D)the stock would more than double every four years.
Unlock Deck
Unlock for access to all 114 flashcards in this deck.
Unlock Deck
k this deck
53
A quadratic trend equation yt = 900 + 80t - 5t2 was fitted to a company's sales. This result implies that the sales trend:
A)hit a peak in period 8.
B)hit a peak in period 5.
C)hit a trough in period 8.
D)hit a trough in period 5.
A)hit a peak in period 8.
B)hit a peak in period 5.
C)hit a trough in period 8.
D)hit a trough in period 5.
Unlock Deck
Unlock for access to all 114 flashcards in this deck.
Unlock Deck
k this deck
54
The fitted annual sales trend is yt = 187e-.047t. The sales forecast for year 5 would be:
A)236.9.
B)178.7.
C)175.3.
D)147.8.
A)236.9.
B)178.7.
C)175.3.
D)147.8.
Unlock Deck
Unlock for access to all 114 flashcards in this deck.
Unlock Deck
k this deck
55
If we fit a linear trend to 10 observations on time-series data that are growing exponentially, then it is most likely that:
A)the fitted trend will be too high at t = 1 and t = 10.
B)the fitted trend will be too low in the middle.
C)the forecasts (if extrapolated) will be too low.
D)the residuals will show a pattern like - - - + + + + - - -.
A)the fitted trend will be too high at t = 1 and t = 10.
B)the fitted trend will be too low in the middle.
C)the forecasts (if extrapolated) will be too low.
D)the residuals will show a pattern like - - - + + + + - - -.
Unlock Deck
Unlock for access to all 114 flashcards in this deck.
Unlock Deck
k this deck
56
If Y1 = 216 and Y5 = 332, then the simple index number for period 5 is I5 = 153.7.
Unlock Deck
Unlock for access to all 114 flashcards in this deck.
Unlock Deck
k this deck
57
The fitted annual sales trend is yt = 227e.037t. The values of yt are:
A)rising by an increasing amount each period.
B)rising by a declining amount each period.
C)declining by a declining amount each period.
D)declining by an increasing amount each period.
A)rising by an increasing amount each period.
B)rising by a declining amount each period.
C)declining by a declining amount each period.
D)declining by an increasing amount each period.
Unlock Deck
Unlock for access to all 114 flashcards in this deck.
Unlock Deck
k this deck
58
A computer analysis reveals that the best-fitting trend model is yt = 4.12e0.987t. The trend was fitted using year-end common stock prices for Melodic Kortholt Outlet for the last six years. The R2 is 0.8571. Which conclusion is not supportable?
A)The absolute annual growth (in dollars per share) is increasing.
B)Few investments could match the astounding growth rate.
C)At the end of year 3 the stock price would be nearly $80.
D)The exponential model is inappropriate for financial data.
A)The absolute annual growth (in dollars per share) is increasing.
B)Few investments could match the astounding growth rate.
C)At the end of year 3 the stock price would be nearly $80.
D)The exponential model is inappropriate for financial data.
Unlock Deck
Unlock for access to all 114 flashcards in this deck.
Unlock Deck
k this deck
59
What is the approximate slope of a linear trend for the value of Bob's beer can collection?
A)-25
B)-50
C)-15
D)-10
A)-25
B)-50
C)-15
D)-10
Unlock Deck
Unlock for access to all 114 flashcards in this deck.
Unlock Deck
k this deck
60
Which trend would you choose to forecast the 2013 value of Bob's beer can collection?
A)Exponential model.
B)Quadratic model.
C)They are equivalent.
A)Exponential model.
B)Quadratic model.
C)They are equivalent.
Unlock Deck
Unlock for access to all 114 flashcards in this deck.
Unlock Deck
k this deck
61
Which data would be measured over an interval of time as opposed to at a point in time?
A)Toyota's total revenue for fiscal 2010
B)Toyota's salaried employee head count at the end of June 2010
C)Toyota's short-term indebtedness at the end of fiscal 2010
D)Toyota's inventory of unsold vehicles on December 31, 2010
A)Toyota's total revenue for fiscal 2010
B)Toyota's salaried employee head count at the end of June 2010
C)Toyota's short-term indebtedness at the end of fiscal 2010
D)Toyota's inventory of unsold vehicles on December 31, 2010
Unlock Deck
Unlock for access to all 114 flashcards in this deck.
Unlock Deck
k this deck
62
In a multiplicative model, if the seasonal factor is 1.15 for a particular season, then we expect that the time series in that season would be (other things being equal):
A)115% above the trend.
B)115% below the trend.
C)15% above the trend.
D)15% below the trend.
A)115% above the trend.
B)115% below the trend.
C)15% above the trend.
D)15% below the trend.
Unlock Deck
Unlock for access to all 114 flashcards in this deck.
Unlock Deck
k this deck
63
MegaStat's seasonal factor of 1.073 applied to a monthly trend forecast of 125.820 yields:
A)135.005.
B)126.893.
C)137.044.
D)124.228.
A)135.005.
B)126.893.
C)137.044.
D)124.228.
Unlock Deck
Unlock for access to all 114 flashcards in this deck.
Unlock Deck
k this deck
64
If yt = 256e-0.07t, then the forecast for period 6 is approximately:
A)390.
B)203.
C)179.
D)168.
A)390.
B)203.
C)179.
D)168.
Unlock Deck
Unlock for access to all 114 flashcards in this deck.
Unlock Deck
k this deck
65
Which of the following best describes the decomposition modeling approach to forecasting?
A)The values of certain variables are used to predict the values of others.
B)Series are separated into trend, seasonal, irregular, and cyclical components.
C)Forecasts are based on an average of recent values.
D)Sophisticated models such as regression with binaries are preferred.
A)The values of certain variables are used to predict the values of others.
B)Series are separated into trend, seasonal, irregular, and cyclical components.
C)Forecasts are based on an average of recent values.
D)Sophisticated models such as regression with binaries are preferred.
Unlock Deck
Unlock for access to all 114 flashcards in this deck.
Unlock Deck
k this deck
66
A quadratic trend equation was estimated from monthly sales of trucks in the United States from July 2006 to July 2011. The estimated trend is yt = 106 + 1.03t + 0.048t2, where yt units are in thousands. From this trend, how many trucks would be sold in July 2012?
A)About 308,419
B)About 524,889
C)About 436,982
D)About 223,831
A)About 308,419
B)About 524,889
C)About 436,982
D)About 223,831
Unlock Deck
Unlock for access to all 114 flashcards in this deck.
Unlock Deck
k this deck
67
For the fitted time-series trend model yt = 9.23e-0.0867t, it is correct to say that:
A)the series is growing by 9.23 percent.
B)the series is growing by 8.67 percent.
C)the model probably shows a low R2.
D)the time series would be declining.
A)the series is growing by 9.23 percent.
B)the series is growing by 8.67 percent.
C)the model probably shows a low R2.
D)the time series would be declining.
Unlock Deck
Unlock for access to all 114 flashcards in this deck.
Unlock Deck
k this deck
68
If yt = 50e0.07t, then the forecast for period 10 is approximately:
A)100.7.
B)90.7.
C)80.7.
D)70.7.
A)100.7.
B)90.7.
C)80.7.
D)70.7.
Unlock Deck
Unlock for access to all 114 flashcards in this deck.
Unlock Deck
k this deck
69
If we fit a linear trend to data that are growing exponentially, which is least likely?
A)The fitted trend will be too low at the beginning and end.
B)The fitted trend will be too high in the middle.
C)The forecasts (if extrapolated) will be too low.
D)The fit will be poor to the most recent data.
A)The fitted trend will be too low at the beginning and end.
B)The fitted trend will be too high in the middle.
C)The forecasts (if extrapolated) will be too low.
D)The fit will be poor to the most recent data.
Unlock Deck
Unlock for access to all 114 flashcards in this deck.
Unlock Deck
k this deck
70
Which of the following is the least useful time-series forecasting model when there is a strong upward trend in the data?
A)Estimated exponential trend model
B)A five-period centered moving average
C)Exponential smoothing with a high α
D)Regression model with trend and seasonal binaries
A)Estimated exponential trend model
B)A five-period centered moving average
C)Exponential smoothing with a high α
D)Regression model with trend and seasonal binaries
Unlock Deck
Unlock for access to all 114 flashcards in this deck.
Unlock Deck
k this deck
71
A trend line has been fitted to a company's annual sales. The trend is given by yt = 50 + 5t, where t is the time index (t = 1, 2, …, n) and yt is annual sales (in millions of dollars). The implication of this trend line is:
A)sales will increase by $5 million every year.
B)sales increase exactly 5 percent every year.
C)sales increase on the average 5 percent per year.
D)sales increase on the average $5 million per year.
A)sales will increase by $5 million every year.
B)sales increase exactly 5 percent every year.
C)sales increase on the average 5 percent per year.
D)sales increase on the average $5 million per year.
Unlock Deck
Unlock for access to all 114 flashcards in this deck.
Unlock Deck
k this deck
72
Which data would be measured over an interval of time as opposed to at a point in time?
A)Toyota's accounts receivable on December 31, 2011
B)Costco's sales for fiscal year 2010
C)The Canadian unemployment rate on December 1, 2010
D)The closing price of Wal-Mart's stock last Friday
A)Toyota's accounts receivable on December 31, 2011
B)Costco's sales for fiscal year 2010
C)The Canadian unemployment rate on December 1, 2010
D)The closing price of Wal-Mart's stock last Friday
Unlock Deck
Unlock for access to all 114 flashcards in this deck.
Unlock Deck
k this deck
73
If yt = 544e0.07t, then the forecast for period 7 is approximately:
A)989.
B)888.
C)678.
D)589.
A)989.
B)888.
C)678.
D)589.
Unlock Deck
Unlock for access to all 114 flashcards in this deck.
Unlock Deck
k this deck
74
The fitted sales trend over the last 12 years is yt = 14.7e0.063t. We can say that:
A)sales grew (on average) at 63 percent per annum.
B)sales in year 10 would be about 39.
C)a continuously compounded model was used.
D)sales in year 1 were 14.7.
A)sales grew (on average) at 63 percent per annum.
B)sales in year 10 would be about 39.
C)a continuously compounded model was used.
D)sales in year 1 were 14.7.
Unlock Deck
Unlock for access to all 114 flashcards in this deck.
Unlock Deck
k this deck
75
Which is a characteristic of an additive (as opposed to multiplicative) time-series model?
A)Appropriate for financial data over a longer time period
B)Appropriate for rapidly growing financial data
C)Appropriate for data that vary by an order of magnitude
D)Appropriate for short-term data with a steady dollar growth
A)Appropriate for financial data over a longer time period
B)Appropriate for rapidly growing financial data
C)Appropriate for data that vary by an order of magnitude
D)Appropriate for short-term data with a steady dollar growth
Unlock Deck
Unlock for access to all 114 flashcards in this deck.
Unlock Deck
k this deck
76
Which statement is correct regarding forecasting using an exponential smoothing model?
A)A model with low α is more responsive to new data than a model with high α.
B)Increasing α will typically increase the forecast accuracy.
C)As α increases, more weight is put on recent data.
D)When data have an upward trend, the forecasts will have an upward bias.
A)A model with low α is more responsive to new data than a model with high α.
B)Increasing α will typically increase the forecast accuracy.
C)As α increases, more weight is put on recent data.
D)When data have an upward trend, the forecasts will have an upward bias.
Unlock Deck
Unlock for access to all 114 flashcards in this deck.
Unlock Deck
k this deck
77
Consider the following linear trend equation of an industry's sales: yt = 120 + 12t, where t is measured in years and sales are measured in millions of dollars. Which is the most reasonable conclusion?
A)We would forecast that sales will increase $12 million in the next year.
B)We would forecast that sales will increase 12 percent in the next year.
C)On the average, sales will increase 12/(120 + 12 × 10) = 0.05, or 5 percent next year.
D)The year-to-year change will depend on the value of t.
A)We would forecast that sales will increase $12 million in the next year.
B)We would forecast that sales will increase 12 percent in the next year.
C)On the average, sales will increase 12/(120 + 12 × 10) = 0.05, or 5 percent next year.
D)The year-to-year change will depend on the value of t.
Unlock Deck
Unlock for access to all 114 flashcards in this deck.
Unlock Deck
k this deck
78
Suppose you fit a (linear or nonlinear) trend regression to a monthly time series and discover that the R2 is only 18 percent. The best conclusion is that:
A)adding seasonal factors might make things worse.
B)fitting a seasonal component could raise the R2.
C)there is no seasonality in the time series.
D)the overall trend is probably negative.
A)adding seasonal factors might make things worse.
B)fitting a seasonal component could raise the R2.
C)there is no seasonality in the time series.
D)the overall trend is probably negative.
Unlock Deck
Unlock for access to all 114 flashcards in this deck.
Unlock Deck
k this deck
79
If a trend is given by yt = aebt, then:
A)the fitted trend value in period 0 is b.
B)the trend is exponentially increasing.
C)the trend is exponentially decreasing.
D)the trend is increasing if b > 0 and decreasing if b < 0.
A)the fitted trend value in period 0 is b.
B)the trend is exponentially increasing.
C)the trend is exponentially decreasing.
D)the trend is increasing if b > 0 and decreasing if b < 0.
Unlock Deck
Unlock for access to all 114 flashcards in this deck.
Unlock Deck
k this deck
80
A quadratic trend equation yt = 900 + 30t - 2.5t2 was fitted to a company's sales. This result implies that the sales trend:
A)hit a maximum in period t = 30.
B)hit a maximum in period t = 6.
C)hit a minimum in period t = 5.
D)hit a minimum in period t = 6.
A)hit a maximum in period t = 30.
B)hit a maximum in period t = 6.
C)hit a minimum in period t = 5.
D)hit a minimum in period t = 6.
Unlock Deck
Unlock for access to all 114 flashcards in this deck.
Unlock Deck
k this deck
Unlock Deck
Unlock for access to all 114 flashcards in this deck.


