Deck 4: Descriptive Statistics
Full screen (f)
Question
Question
Question
Question
Question
Question
Question
Question
Question
Question
Question
Question
Question
Question
Question
Question
Question
Referring to this box plot of ice cream fat content, the median seems more "typical" of fat content than the midrange as a measure of center. 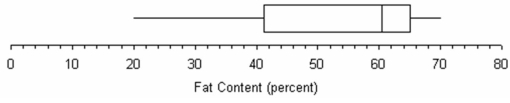
Question
Question
Question
Question
Referring to this box plot of ice cream fat content, the skewness would be negative. 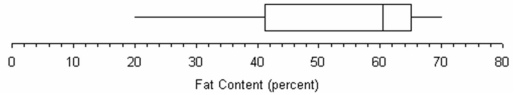
Question
Question
Question
Question
Question
Question
Question
Question
Referring to this box plot of ice cream fat content, the mean would exceed the median. 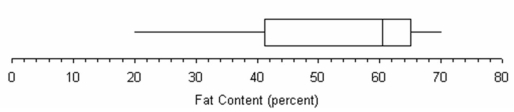
Question
Question
Question
Question
Question
Question
Question
Question
Question
Question
Referring to this graph of ice cream fat content, the second quartile is about 61. 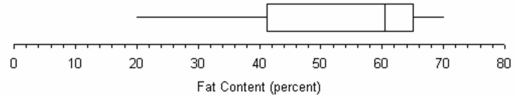
Question
Question
Question
Question
Question
Question
Question
Question
Question
Question
Question
Question
Question
Question
Question
Question
Question
Question
Question
Question
Question
Question
VenalCo Market Research surveyed 50 individuals who recently purchased a certain CD, revealing the age distribution shown below. Which statement is least defensible? 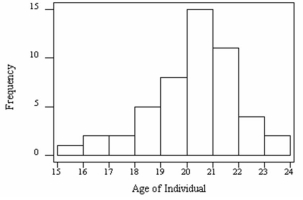
A)The mean age probably exceeds the median age.
B)The mode would be a reasonable measure of center.
C)The data are somewhat skewed to the left.
D)The CD is unlikely to appeal to retirees.
A)The mean age probably exceeds the median age.
B)The mode would be a reasonable measure of center.
C)The data are somewhat skewed to the left.
D)The CD is unlikely to appeal to retirees.
Question
Question
Question
Question
Question
Question
Question
Question
Question
Question
Question
Question
Question
Question
Question
Question
A sample of 50 breakfast customers of McDonald's showed the spending below. Which statement is least likely to be correct? 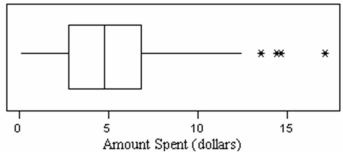
A)The median is very close to the midhinge.
B)The median purchase is slightly less than $5.
C)About 75 percent of the customers spend less than $7.
D)The mean is a reasonable measure of center.
A)The median is very close to the midhinge.
B)The median purchase is slightly less than $5.
C)About 75 percent of the customers spend less than $7.
D)The mean is a reasonable measure of center.
Question
Question
Question

Unlock Deck
Sign up to unlock the cards in this deck!
Unlock Deck
Unlock Deck
1/150
Play
Full screen (f)
Deck 4: Descriptive Statistics
1
It is inappropriate to apply the Empirical Rule to a population that is right-skewed.
E.R. applies to normal populations.
E.R. applies to normal populations.
True
2
In a left-skewed distribution, we expect that the median will be greater than the mean.
True
3
The midhinge is a robust measure of center when there are outliers.
True
4
When data are right-skewed, we expect the median to be greater than the mean.
Unlock Deck
Unlock for access to all 150 flashcards in this deck.
Unlock Deck
k this deck
5
The second quartile is the same as the median.
Unlock Deck
Unlock for access to all 150 flashcards in this deck.
Unlock Deck
k this deck
6
If the standard deviations of two samples are the same, so are their coefficients of variation.C.V.
Unlock Deck
Unlock for access to all 150 flashcards in this deck.
Unlock Deck
k this deck
7
One benefit of the box plot is that it clearly displays the standard deviation.
Unlock Deck
Unlock for access to all 150 flashcards in this deck.
Unlock Deck
k this deck
8
Chebyshev's Theorem says that at least 95 percent of the data lie within 2 standard deviations of the mean.
Unlock Deck
Unlock for access to all 150 flashcards in this deck.
Unlock Deck
k this deck
9
A certain health maintenance organization (HMO) examined the number of office visits by its members in the last year. For this data set, the mean is probably not a very good measure of a "typical" person's office visits.
Unlock Deck
Unlock for access to all 150 flashcards in this deck.
Unlock Deck
k this deck
10
If there are 20 data values, the median will be halfway between two data values.
Unlock Deck
Unlock for access to all 150 flashcards in this deck.
Unlock Deck
k this deck
11
If there are 19 data values, the median will have 10 values above it and 9 below it since n is odd.
Unlock Deck
Unlock for access to all 150 flashcards in this deck.
Unlock Deck
k this deck
12
Given the data set 2, 5, 10, 6, 3, the median value is 3.
Unlock Deck
Unlock for access to all 150 flashcards in this deck.
Unlock Deck
k this deck
13
Given the data set 10, 5, 2, 6, 3, 4, 20, the median value is 5.
Unlock Deck
Unlock for access to all 150 flashcards in this deck.
Unlock Deck
k this deck
14
A trimmed mean may be preferable to a mean when a data set has extreme values.
Unlock Deck
Unlock for access to all 150 flashcards in this deck.
Unlock Deck
k this deck
15
A certain health maintenance organization (HMO) examined the number of office visits by its members in the last year. This data set would probably be skewed to the left due to low outliers.
Unlock Deck
Unlock for access to all 150 flashcards in this deck.
Unlock Deck
k this deck
16
The sum of the deviations around the mean is always zero.
Unlock Deck
Unlock for access to all 150 flashcards in this deck.
Unlock Deck
k this deck
17
Referring to this box plot of ice cream fat content, the median seems more "typical" of fat content than the midrange as a measure of center.
Unlock Deck
Unlock for access to all 150 flashcards in this deck.
Unlock Deck
k this deck
18
Chebyshev's Theorem says that at most 50 percent of the data lie within 2 standard deviations of the mean.
Unlock Deck
Unlock for access to all 150 flashcards in this deck.
Unlock Deck
k this deck
19
A data set with two values that are tied for the highest number of occurrences is called bimodal.
Unlock Deck
Unlock for access to all 150 flashcards in this deck.
Unlock Deck
k this deck
20
The midrange is not greatly affected by outliers.
Unlock Deck
Unlock for access to all 150 flashcards in this deck.
Unlock Deck
k this deck
21
Referring to this box plot of ice cream fat content, the skewness would be negative.
Unlock Deck
Unlock for access to all 150 flashcards in this deck.
Unlock Deck
k this deck
22
The range as a measure of variability is very sensitive to extreme data values.
Unlock Deck
Unlock for access to all 150 flashcards in this deck.
Unlock Deck
k this deck
23
The Empirical Rule can be applied to any distribution, unlike Chebyshev's theorem.
E.R. assumes a normal population, while Chebyshev applies to any population.
E.R. assumes a normal population, while Chebyshev applies to any population.
Unlock Deck
Unlock for access to all 150 flashcards in this deck.
Unlock Deck
k this deck
24
The position of the median is:
A)n/2 in any sample.
B)n/2 if n is even.
C)n/2 if n is odd.
D)(n + 1)/2 in any sample.
A)n/2 in any sample.
B)n/2 if n is even.
C)n/2 if n is odd.
D)(n + 1)/2 in any sample.
Unlock Deck
Unlock for access to all 150 flashcards in this deck.
Unlock Deck
k this deck
25
Which is a characteristic of the mean as a measure of center?
A)Deviations do not sum to zero when there are extreme values.
B)It is less reliable than the mode when the data are continuous.
C)It utilizes all the information in a sample.
D)It is usually equal to the median in business data.
A)Deviations do not sum to zero when there are extreme values.
B)It is less reliable than the mode when the data are continuous.
C)It utilizes all the information in a sample.
D)It is usually equal to the median in business data.
Unlock Deck
Unlock for access to all 150 flashcards in this deck.
Unlock Deck
k this deck
26
A sample consists of the following data: 7, 11, 12, 18, 20, 22, 43. Using the "three standard deviation" criterion, the last observation (X = 43) would be considered an outlier.
Unlock Deck
Unlock for access to all 150 flashcards in this deck.
Unlock Deck
k this deck
27
Which is not a characteristic of the geometric mean as a measure of center?
A)It is similar to the mean if the data are skewed right.
B)It mitigates the effects of large data values.
C)It is useful in business data to calculate average growth rates.
D)It cannot be calculated when the data contain negative or zero values.
A)It is similar to the mean if the data are skewed right.
B)It mitigates the effects of large data values.
C)It is useful in business data to calculate average growth rates.
D)It cannot be calculated when the data contain negative or zero values.
Unlock Deck
Unlock for access to all 150 flashcards in this deck.
Unlock Deck
k this deck
28
A leptokurtic distribution is more sharply peaked (i.e., thinner tails) than a normal distribution.
Unlock Deck
Unlock for access to all 150 flashcards in this deck.
Unlock Deck
k this deck
29
Referring to this box plot of ice cream fat content, the mean would exceed the median.
Unlock Deck
Unlock for access to all 150 flashcards in this deck.
Unlock Deck
k this deck
30
A platykurtic distribution is more sharply peaked (i.e., thinner tails) than a normal distribution.
Unlock Deck
Unlock for access to all 150 flashcards in this deck.
Unlock Deck
k this deck
31
A positive kurtosis coefficient in Excel indicates a leptokurtic condition in a distribution.
Unlock Deck
Unlock for access to all 150 flashcards in this deck.
Unlock Deck
k this deck
32
The Empirical Rule assumes that the distribution of data follows a normal curve.
E.R. assumes a normal population.
E.R. assumes a normal population.
Unlock Deck
Unlock for access to all 150 flashcards in this deck.
Unlock Deck
k this deck
33
Kurtosis cannot be judged accurately by looking at a histogram.
Unlock Deck
Unlock for access to all 150 flashcards in this deck.
Unlock Deck
k this deck
34
Outliers are data values that fall beyond ±2 standard deviations from the mean.
Unlock Deck
Unlock for access to all 150 flashcards in this deck.
Unlock Deck
k this deck
35
Which is not a characteristic of the standard deviation?
A)It is always the square root of the variance.
B)It is not applicable when data are continuous.
C)It can be calculated when the data contain negative or zero values.
D)Its physical interpretation is not as easy as the MAD.
A)It is always the square root of the variance.
B)It is not applicable when data are continuous.
C)It can be calculated when the data contain negative or zero values.
D)Its physical interpretation is not as easy as the MAD.
Unlock Deck
Unlock for access to all 150 flashcards in this deck.
Unlock Deck
k this deck
36
In calculating the sample variance, the sum of the squared deviations around the mean is divided by n - 1 to avoid underestimating the unknown population variance.
Unlock Deck
Unlock for access to all 150 flashcards in this deck.
Unlock Deck
k this deck
37
When applying the Empirical Rule to a distribution of grades, if a student scored one standard deviation below the mean, then she would be at the 25th percentile of the distribution.
Unlock Deck
Unlock for access to all 150 flashcards in this deck.
Unlock Deck
k this deck
38
Which is a characteristic of the trimmed mean as a measure of center?
A)It is similar to the mean if there are offsetting high and low extremes.
B)It is especially helpful in a small sample.
C)It does not require sorting the sample.
D)It is basically the same as the midrange.
A)It is similar to the mean if there are offsetting high and low extremes.
B)It is especially helpful in a small sample.
C)It does not require sorting the sample.
D)It is basically the same as the midrange.
Unlock Deck
Unlock for access to all 150 flashcards in this deck.
Unlock Deck
k this deck
39
Referring to this graph of ice cream fat content, the second quartile is about 61.
Unlock Deck
Unlock for access to all 150 flashcards in this deck.
Unlock Deck
k this deck
40
Which is not an advantage of the method of medians to find Q1 and Q3?
A)Ease of interpolating quartile positions
B)Ease of application in small data sets
C)Intuitive definitions without complex formulas
D)Same method as Excel's =QUARTILE.EXC function.
A)Ease of interpolating quartile positions
B)Ease of application in small data sets
C)Intuitive definitions without complex formulas
D)Same method as Excel's =QUARTILE.EXC function.
Unlock Deck
Unlock for access to all 150 flashcards in this deck.
Unlock Deck
k this deck
41
Which is not true of an outlier?
A)It is likely to be from a different population.
B)It suggests an error in recording the data.
C)It is best discarded to get a better mean.
D)It is an anomaly that may tell the researcher something.
A)It is likely to be from a different population.
B)It suggests an error in recording the data.
C)It is best discarded to get a better mean.
D)It is an anomaly that may tell the researcher something.
Unlock Deck
Unlock for access to all 150 flashcards in this deck.
Unlock Deck
k this deck
42
Exam scores in a small class were 10, 10, 20, 20, 40, 60, 80, 80, 90, 100, 100. For this data set, which statement is incorrect concerning measures of center?
A)The median is 60.00.
B)The mode is not helpful.
C)The 5 percent trimmed mean would be awkward.
D)The geometric mean is 35.05.
A)The median is 60.00.
B)The mode is not helpful.
C)The 5 percent trimmed mean would be awkward.
D)The geometric mean is 35.05.
Unlock Deck
Unlock for access to all 150 flashcards in this deck.
Unlock Deck
k this deck
43
Exam scores in a small class were 0, 50, 50, 70, 70, 80, 90, 90, 100, 100. For this data set, which statement is incorrect concerning measures of center?
A)The median is 70.
B)The mode is not helpful.
C)The geometric mean is useless.
D)The mean is 70.
A)The median is 70.
B)The mode is not helpful.
C)The geometric mean is useless.
D)The mean is 70.
Unlock Deck
Unlock for access to all 150 flashcards in this deck.
Unlock Deck
k this deck
44
Chebyshev's Theorem:
A)applies to all samples.
B)applies only to samples from a normal population.
C)gives a narrower range of predictions than the Empirical Rule.
D)is based on Sturges' Rule for data classification.The strength of Chebyshev's Theorem is that it makes no assumption about normality, while the
A)applies to all samples.
B)applies only to samples from a normal population.
C)gives a narrower range of predictions than the Empirical Rule.
D)is based on Sturges' Rule for data classification.The strength of Chebyshev's Theorem is that it makes no assumption about normality, while the
Unlock Deck
Unlock for access to all 150 flashcards in this deck.
Unlock Deck
k this deck
45
Which is true of the kurtosis of a distribution?
A)A distribution that is flatter than a normal distribution (i.e., thicker tails) is mesokurtic.
B)A distribution that is more peaked than a normal distribution (i.e., thinner tails) is platykurtic.
C)It is risky to assess kurtosis if the sample size is less than 50.
D)The expected range of the kurtosis coefficient increases as n increases.
Unlock Deck
Unlock for access to all 150 flashcards in this deck.
Unlock Deck
k this deck
46
Which is a correct statement concerning the median?
A)In a left-skewed distribution, we expect that the median will exceed the mean.
B)The sum of the deviations around the median is zero.
C)The median is an observed data value in any data set.
D)The median is halfway between Q1 and Q3 on a box plot.
A)In a left-skewed distribution, we expect that the median will exceed the mean.
B)The sum of the deviations around the median is zero.
C)The median is an observed data value in any data set.
D)The median is halfway between Q1 and Q3 on a box plot.
Unlock Deck
Unlock for access to all 150 flashcards in this deck.
Unlock Deck
k this deck
47
Estimating the mean from grouped data will tend to be most accurate when:
A)observations are distributed uniformly within classes.
B)there are few classes with wide class limits.
C)the sample is not very large and bins are wide.
D)the standard deviation is large relative to the mean.
A)observations are distributed uniformly within classes.
B)there are few classes with wide class limits.
C)the sample is not very large and bins are wide.
D)the standard deviation is large relative to the mean.
Unlock Deck
Unlock for access to all 150 flashcards in this deck.
Unlock Deck
k this deck
48
A population consists of the following data: 7, 11, 12, 18, 20, 22, 25. The population variance is:
A)6.07.
B)36.82.
C)5.16.
D)22.86.
A)6.07.
B)36.82.
C)5.16.
D)22.86.
Unlock Deck
Unlock for access to all 150 flashcards in this deck.
Unlock Deck
k this deck
49
John scored 35 on Prof. Johnson's exam (Q1 = 70 and Q3 = 80). Based on the fences, which is correct?
A)John is unusual but not an outlier.
B)John is an outlier.
C)John is neither unusual nor an outlier.
D)John is in the 30th percentile.
A)John is unusual but not an outlier.
B)John is an outlier.
C)John is neither unusual nor an outlier.
D)John is in the 30th percentile.
Unlock Deck
Unlock for access to all 150 flashcards in this deck.
Unlock Deck
k this deck
50
Which of the following is not a valid description of an outlier?
A)A data value beyond the outer fences
B)A data value that is very unusual
C)A data value that lies below Q1 or above Q3
D)A data value several standard deviations from the mean.
A)A data value beyond the outer fences
B)A data value that is very unusual
C)A data value that lies below Q1 or above Q3
D)A data value several standard deviations from the mean.
Unlock Deck
Unlock for access to all 150 flashcards in this deck.
Unlock Deck
k this deck
51
John scored 85 on Prof. Hardtack's exam (Q1 = 40 and Q3 = 60). Based on the fences, which is correct?
A)John is an extreme outlier.
B)John is an outlier.
C)John is not an outlier.
D)John is in the 85th percentile.
A)John is an extreme outlier.
B)John is an outlier.
C)John is not an outlier.
D)John is in the 85th percentile.
Unlock Deck
Unlock for access to all 150 flashcards in this deck.
Unlock Deck
k this deck
52
Which is true of skewness?
A)In business data, positive skewness is unusual.
B)In a negatively skewed distribution, the mean is likely to exceed the median.
C)Skewness often is evidenced by one or more outliers.
D)The expected range of Excel's skewness coefficient increases as n increases.
A)In business data, positive skewness is unusual.
B)In a negatively skewed distribution, the mean is likely to exceed the median.
C)Skewness often is evidenced by one or more outliers.
D)The expected range of Excel's skewness coefficient increases as n increases.
Unlock Deck
Unlock for access to all 150 flashcards in this deck.
Unlock Deck
k this deck
53
In a sample of 10,000 observations from a normal population, how many would you expect to lie beyond three standard deviations of the mean?
A)None of them
B)About 27
C)About 100
D)About 127
A)None of them
B)About 27
C)About 100
D)About 127
Unlock Deck
Unlock for access to all 150 flashcards in this deck.
Unlock Deck
k this deck
54
The Excel formula for the standard deviation of a sample array named Data is:
A)=STDEV.S(Data).
B)=STANDEV(Data).
C)=STDEV.P(Data).
D)=SUM(Data)/(COUNT(Data)-1).
A)=STDEV.S(Data).
B)=STANDEV(Data).
C)=STDEV.P(Data).
D)=SUM(Data)/(COUNT(Data)-1).
Unlock Deck
Unlock for access to all 150 flashcards in this deck.
Unlock Deck
k this deck
55
Which is not true of the Empirical Rule?
A)It applies to any distribution.
B)It can be applied to fewer distributions than Chebyshev's Theorem.
C)It assumes that the distribution of data follows a bell-shaped, normal curve.
D)It predicts more observations within μ ± kσ than Chebyshev's Theorem.The
A)It applies to any distribution.
B)It can be applied to fewer distributions than Chebyshev's Theorem.
C)It assumes that the distribution of data follows a bell-shaped, normal curve.
D)It predicts more observations within μ ± kσ than Chebyshev's Theorem.The
Unlock Deck
Unlock for access to all 150 flashcards in this deck.
Unlock Deck
k this deck
56
Exam scores in a random sample of students were 0, 50, 50, 70, 70, 80, 90, 90, 90, 100. Which statement is incorrect?
A)The standard deviation is 29.61.
B)The data are slightly left-skewed.
C)The midrange and mean are almost the same.
D)The third quartile is 90.
A)The standard deviation is 29.61.
B)The data are slightly left-skewed.
C)The midrange and mean are almost the same.
D)The third quartile is 90.
Unlock Deck
Unlock for access to all 150 flashcards in this deck.
Unlock Deck
k this deck
57
Consider the following data: 6, 7, 17, 51, 3, 17, 23, and 69. The range and the median are:
A)69 and 17.5.
B)66 and 17.5.
C)66 and 17.
D)69 and 17.
A)69 and 17.5.
B)66 and 17.5.
C)66 and 17.
D)69 and 17.
Unlock Deck
Unlock for access to all 150 flashcards in this deck.
Unlock Deck
k this deck
58
For U.S. adult males, the mean height is 178 cm with a standard deviation of 8 cm and the mean weight is 84 kg with a standard deviation of 8 kg. Elmer is 170 cm tall and weighs 70 kg. It is most nearly correct to say that:
A)Elmer's weight is more unusual than his height.
B)Elmer is heavier than he is tall.
C)Height and weight have the same degree of variation.
D)Height has more variation than weight.
A)Elmer's weight is more unusual than his height.
B)Elmer is heavier than he is tall.
C)Height and weight have the same degree of variation.
D)Height has more variation than weight.
Unlock Deck
Unlock for access to all 150 flashcards in this deck.
Unlock Deck
k this deck
59
Which statement is true?
A)With nominal data we can find the mode.
B)Outliers distort the mean but not the standard deviation.
C)Business and economic data are rarely skewed to the right.
D)If we sample a normal population, the sample skewness coefficient is exactly 0.
A)With nominal data we can find the mode.
B)Outliers distort the mean but not the standard deviation.
C)Business and economic data are rarely skewed to the right.
D)If we sample a normal population, the sample skewness coefficient is exactly 0.
Unlock Deck
Unlock for access to all 150 flashcards in this deck.
Unlock Deck
k this deck
60
If samples are from a normal distribution with μ = 100 and σ = 10, we expect:
A)about 68 percent of the data within 90 to 110.
B)almost all the data within 80 to 120.
C)about 95 percent of the data within 70 to 130.
D)about half the data to exceed 75.
A)about 68 percent of the data within 90 to 110.
B)almost all the data within 80 to 120.
C)about 95 percent of the data within 70 to 130.
D)about half the data to exceed 75.
Unlock Deck
Unlock for access to all 150 flashcards in this deck.
Unlock Deck
k this deck
61
VenalCo Market Research surveyed 50 individuals who recently purchased a certain CD, revealing the age distribution shown below. Which statement is least defensible?
A)The mean age probably exceeds the median age.
B)The mode would be a reasonable measure of center.
C)The data are somewhat skewed to the left.
D)The CD is unlikely to appeal to retirees.
A)The mean age probably exceeds the median age.
B)The mode would be a reasonable measure of center.
C)The data are somewhat skewed to the left.
D)The CD is unlikely to appeal to retirees.
Unlock Deck
Unlock for access to all 150 flashcards in this deck.
Unlock Deck
k this deck
62
In the following data set {7, 5, 0, 2, 7, 15, 5, 2, 7, 18, 7, 3, 0}, the value 7 is:
A)the mean.
B)the mode.
C)both the mode and median.
D)both the mean and mode.
A)the mean.
B)the mode.
C)both the mode and median.
D)both the mean and mode.
Unlock Deck
Unlock for access to all 150 flashcards in this deck.
Unlock Deck
k this deck
63
Which distribution is least likely to be skewed to the right by high values?
A)Annual incomes of n passengers on a flight from New York to London
B)Weekend gambling losses of n customers at a major casino
C)Accident damage losses by n renters of an auto rental company
D)Cost of a plain McDonald's hamburger in n U.S. cities
A)Annual incomes of n passengers on a flight from New York to London
B)Weekend gambling losses of n customers at a major casino
C)Accident damage losses by n renters of an auto rental company
D)Cost of a plain McDonald's hamburger in n U.S. cities
Unlock Deck
Unlock for access to all 150 flashcards in this deck.
Unlock Deck
k this deck
64
The ______________ shows the relationship between two variables.
A)box plot
B)bar chart
C)histogram
D)scatter plot
A)box plot
B)bar chart
C)histogram
D)scatter plot
Unlock Deck
Unlock for access to all 150 flashcards in this deck.
Unlock Deck
k this deck
65
If the mean and median of a population are the same, then its distribution is:
A)normal.
B)skewed.
C)symmetric.
D)uniform.
A)normal.
B)skewed.
C)symmetric.
D)uniform.
Unlock Deck
Unlock for access to all 150 flashcards in this deck.
Unlock Deck
k this deck
66
When a sample has an odd number of observations, the median is the:
A)observation in the center of the data array.
B)average of the two observations in the center of the data array.
C)value of the most frequent observation.
D)average of Q1 and Q3.
A)observation in the center of the data array.
B)average of the two observations in the center of the data array.
C)value of the most frequent observation.
D)average of Q1 and Q3.
Unlock Deck
Unlock for access to all 150 flashcards in this deck.
Unlock Deck
k this deck
67
As a measure of variability, compared to the range, an advantage of the standard deviation is:
A)being calculated easily through the use of a formula.
B)considering only the data values in the middle of the data array.
C)describing the distance between the highest and lowest values.
D)considering all data values.
A)being calculated easily through the use of a formula.
B)considering only the data values in the middle of the data array.
C)describing the distance between the highest and lowest values.
D)considering all data values.
Unlock Deck
Unlock for access to all 150 flashcards in this deck.
Unlock Deck
k this deck
68
Which statement is false?
A)The coefficient of variation cannot be used when the mean is zero.
B)The standard deviation is in the same units as the mean (e.g., kilograms).
C)The mean from a frequency tabulation may differ from the mean from raw data.
D)The skewness coefficient is zero in a sample from any normal distribution.
Unlock Deck
Unlock for access to all 150 flashcards in this deck.
Unlock Deck
k this deck
69
Which Excel function would be least useful to calculate the quartiles for a column of data?
A)=STANDARDIZE
B)=PERCENTILE.EXC
C)=QUARTILE.EXC
D)=RANK
A)=STANDARDIZE
B)=PERCENTILE.EXC
C)=QUARTILE.EXC
D)=RANK
Unlock Deck
Unlock for access to all 150 flashcards in this deck.
Unlock Deck
k this deck
70
The 25th percentile for waiting time in a doctor's office is 19 minutes. The 75th percentile is 31 minutes. Which is incorrect regarding the fences?
A)The upper inner fence is 49 minutes.
B)The upper outer fence is 67 minutes.
C)A waiting time of 45 minutes exceeds the upper inner fence.
D)A waiting time of 70 minutes would be an outlier.
A)The upper inner fence is 49 minutes.
B)The upper outer fence is 67 minutes.
C)A waiting time of 45 minutes exceeds the upper inner fence.
D)A waiting time of 70 minutes would be an outlier.
Unlock Deck
Unlock for access to all 150 flashcards in this deck.
Unlock Deck
k this deck
71
Frieda is 67 inches tall and weighs 135 pounds. Women her age have a mean height of 65 inches with a standard deviation of 2.5 inches and a mean weight of 125 pounds with a standard deviation of 10 pounds. In relative terms, it is correct to say that:
A)Frieda is taller and thinner than women in her age group.
B)for this group of women, weight has greater variation than height.
C)Frieda's height is more unusual than her weight.
D)the variation coefficient exceeds 10 percent for both height and weight.
A)Frieda is taller and thinner than women in her age group.
B)for this group of women, weight has greater variation than height.
C)Frieda's height is more unusual than her weight.
D)the variation coefficient exceeds 10 percent for both height and weight.
Unlock Deck
Unlock for access to all 150 flashcards in this deck.
Unlock Deck
k this deck
72
A sample of customers from Barnsboro National Bank shows an average account balance of $315 with a standard deviation of $87. A sample of customers from Wellington Savings and Loan shows an average account balance of $8350 with a standard deviation of $1800. Which statement about account balances is correct?
A)Barnsboro Bank has more variation.
B)Wellington S&L has more variation.
C)Both have the same variation.
A)Barnsboro Bank has more variation.
B)Wellington S&L has more variation.
C)Both have the same variation.
Unlock Deck
Unlock for access to all 150 flashcards in this deck.
Unlock Deck
k this deck
73
When using Chebyshev's Theorem, the minimum percentage of sample observations that will fall within two standard deviations of the mean will be __________ the percentage within two standard deviations if a normal distribution is assumed (Empirical Rule).
A)smaller than
B)greater than
C)the same as
A)smaller than
B)greater than
C)the same as
Unlock Deck
Unlock for access to all 150 flashcards in this deck.
Unlock Deck
k this deck
74
Given a sample of three items (X = 4, 6, 5), which statement is incorrect?
A)The geometric mean is 5.2.
B)The standard deviation is 1.
C)The coefficient of variation is 20 percent.
D)The quartiles are useless.
A)The geometric mean is 5.2.
B)The standard deviation is 1.
C)The coefficient of variation is 20 percent.
D)The quartiles are useless.
Unlock Deck
Unlock for access to all 150 flashcards in this deck.
Unlock Deck
k this deck
75
Which two statistics offer robust measures of center when outliers are present?
A)Mean and mode.
B)Median and trimmed mean.
C)Midrange and geometric mean.
D)Variance and standard deviation.
A)Mean and mode.
B)Median and trimmed mean.
C)Midrange and geometric mean.
D)Variance and standard deviation.
Unlock Deck
Unlock for access to all 150 flashcards in this deck.
Unlock Deck
k this deck
76
Histograms are best used to:
A)provide a visual estimate of the standard deviation.
B)show the quartiles of the data set.
C)assess the shape of the distribution.
D)reveal the interquartile range of the data set.
A)provide a visual estimate of the standard deviation.
B)show the quartiles of the data set.
C)assess the shape of the distribution.
D)reveal the interquartile range of the data set.
Unlock Deck
Unlock for access to all 150 flashcards in this deck.
Unlock Deck
k this deck
77
A sample of 50 breakfast customers of McDonald's showed the spending below. Which statement is least likely to be correct?
A)The median is very close to the midhinge.
B)The median purchase is slightly less than $5.
C)About 75 percent of the customers spend less than $7.
D)The mean is a reasonable measure of center.
A)The median is very close to the midhinge.
B)The median purchase is slightly less than $5.
C)About 75 percent of the customers spend less than $7.
D)The mean is a reasonable measure of center.
Unlock Deck
Unlock for access to all 150 flashcards in this deck.
Unlock Deck
k this deck
78
The 25th percentile for waiting time in a doctor's office is 19 minutes. The 75th percentile is 31 minutes. The interquartile range is:
A)12 minutes.
B)16 minutes.
C)22 minutes.
D)impossible to determine without knowing n.
A)12 minutes.
B)16 minutes.
C)22 minutes.
D)impossible to determine without knowing n.
Unlock Deck
Unlock for access to all 150 flashcards in this deck.
Unlock Deck
k this deck
79
Based on daily measurements, Bob's weight has a mean of 200 pounds with a standard deviation of 16 pounds, while Mary's weight has a mean of 125 pounds with a standard deviation of 15 pounds. Who has the smaller relative variation?
A)Bob
B)Mary
C)They are the same.
A)Bob
B)Mary
C)They are the same.
Unlock Deck
Unlock for access to all 150 flashcards in this deck.
Unlock Deck
k this deck
80
Which Excel function is designed to calculate z = (x - μ)/σ for a column of data?
A)=STANDARDIZE
B)=NORM.DIST
C)=STDEV.P
D)=AVEDEV
A)=STANDARDIZE
B)=NORM.DIST
C)=STDEV.P
D)=AVEDEV
Unlock Deck
Unlock for access to all 150 flashcards in this deck.
Unlock Deck
k this deck
Unlock Deck
Unlock for access to all 150 flashcards in this deck.


