Deck 10: Managing Data and Using Graphics
Full screen (f)
Question
Question
Question
Question
Question
Question
Question
Question
Question
Question
Question
Question
Question
Question
Question
Question
Question
Question
Question
Question
Question
Question
Question
Question
Question
Question
Question
Question
Question
Question
Question
Question
Question
Question
Question
Question
Question
Question
Question
Question
Question
Question
Question
Interpreting Quantitative DataRancorps Inc. has surveyed employees to determine their interest in learning about financial planning. The table shows the total employee responses, using the raw data and percentages. The results of this survey will be reported to the director of Human Resources and used to develop a financial planning training seminar for employees.Required:
Write an analysis of this data that explains the results of the survey. This analysis will appear in the written report to the director of Human Resources.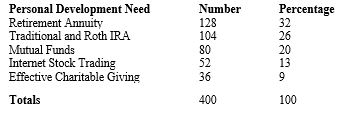
Write an analysis of this data that explains the results of the survey. This analysis will appear in the written report to the director of Human Resources.
Question
Question
Question
Question
Question
Question
Question

Unlock Deck
Sign up to unlock the cards in this deck!
Unlock Deck
Unlock Deck
1/50
Play
Full screen (f)
Deck 10: Managing Data and Using Graphics
1
When an effective graphic is used in a report, there is no need for additional interpretation and analysis of the data.
False
2
Interpretation and analysis of a graphic should appear before the graphic is shown.
True
3
For Kayla to avoid a visual distortion in the bar chart she is creating to show her company's sales by region, she should design the quantitative axis to begin at zero, and make each bar the same width.
True
4
A graphic that will not fit on the page where it is introduced should be placed in an appendix.
Unlock Deck
Unlock for access to all 50 flashcards in this deck.
Unlock Deck
k this deck
5
Fractions, percentages, and the Dow Jones Industrial Average are examples of the common language used in communicating difficult or complex numbers.
Unlock Deck
Unlock for access to all 50 flashcards in this deck.
Unlock Deck
k this deck
6
Graphics should clarify, simplify, or reinforce the data.
Unlock Deck
Unlock for access to all 50 flashcards in this deck.
Unlock Deck
k this deck
7
Which of the following is an accurate statement concerning the use of graphics?
A)The use of graphics makes the use of an extensive discussion in prose unnecessary.
B)A few pages of graphics can effectively convey several hundred pages of text.
C)There is no medium for graphics to be used in oral or spoken presentations.
D)Graphics are used to keep the audience engaged and not to gain a greater understanding of the idea.
Unlock Deck
Unlock for access to all 50 flashcards in this deck.
Unlock Deck
k this deck
8
A pie chart presents data in columns and rows, which aid in clarifying large quantities of data in a small space.
Unlock Deck
Unlock for access to all 50 flashcards in this deck.
Unlock Deck
k this deck
9
Graphics must be saved for data that that are difficult to communicate in words alone.
Unlock Deck
Unlock for access to all 50 flashcards in this deck.
Unlock Deck
k this deck
10
A pie chart is the best type of graphic aid to use to summarize the results of a survey question to which each respondent could check more than one answer.
Unlock Deck
Unlock for access to all 50 flashcards in this deck.
Unlock Deck
k this deck
11
When viewing tabulated research results, readers or listeners need exact statistics rather than rounded fractions and percentages.
Unlock Deck
Unlock for access to all 50 flashcards in this deck.
Unlock Deck
k this deck
12
Fraction, ratios, and percentages are all examples of _____.
A)common language
B)data distortion
C)diverse language
D)qualitative interpretation
A)common language
B)data distortion
C)diverse language
D)qualitative interpretation
Unlock Deck
Unlock for access to all 50 flashcards in this deck.
Unlock Deck
k this deck
13
Madison is preparing a report on war fatalities in three different war zones. She has designed a bar chart comparing the number of fatalities in each war zone and now wants to insert it into her report. Which of the following is a recommended way to insert the graphic into her report?
A)Madison should introduce the graphic in the text immediately before the graphic appears and then put in an analysis after it.
B)Madison should insert the graphic followed by a reference to the graphic in the form of a page number or "see above."
C)Madison should interpret and analyze the graphic before the graphic appears in the report.
D)Madison should analyze the graphic and place it in the references section at the end of the report.
Unlock Deck
Unlock for access to all 50 flashcards in this deck.
Unlock Deck
k this deck
14
A line chart is an effective graphic for comparing housing prices in a particular state or region with housing prices in the United States over a five-year period.
Unlock Deck
Unlock for access to all 50 flashcards in this deck.
Unlock Deck
k this deck
15
Which of the following is an accurate statement concerning the reporting of quantitative data?
A)People are not usually interested in proportions or ratios, because they are confusing.
B)When tabulating research results of opinions and preferences, reporting exact statistics to the most accurate decimal point is necessary to avoid distortion in interpretation.
C)Common language reduces difficult figures to the "common denominators" of language and ideas.
D)Common language is specific to indicators of actual count or quantity.
Unlock Deck
Unlock for access to all 50 flashcards in this deck.
Unlock Deck
k this deck
16
Visual data provide a clear picture to readers, enabling them to form correct opinions about the data.
Unlock Deck
Unlock for access to all 50 flashcards in this deck.
Unlock Deck
k this deck
17
A pictogram is used to track progress toward completion of a six-month construction project.
Unlock Deck
Unlock for access to all 50 flashcards in this deck.
Unlock Deck
k this deck
18
Extreme use of color, complicated symbols and art techniques, and unusual combinations of typefaces reduce the impact of the material presented.
Unlock Deck
Unlock for access to all 50 flashcards in this deck.
Unlock Deck
k this deck
19
Totals help people make comparisons during analysis.
Unlock Deck
Unlock for access to all 50 flashcards in this deck.
Unlock Deck
k this deck
20
Which of the following is an acceptable guideline for the effective use of graphics?
A)Use graphics for data that are easily communicated in words.
B)Incorporate a wide selection of typefaces and colors.
C)Use graphics to contribute to the understanding of the idea.
D)Stick to descriptive titles for graphics.
A)Use graphics for data that are easily communicated in words.
B)Incorporate a wide selection of typefaces and colors.
C)Use graphics to contribute to the understanding of the idea.
D)Stick to descriptive titles for graphics.
Unlock Deck
Unlock for access to all 50 flashcards in this deck.
Unlock Deck
k this deck
21
The Director of Human Resources at the Bilderburger Company wants to chart employee absences over a two-year period. This data should be represented in the form of a _____.
A)flow chart
B)pie chart
C)line chart
D)table
A)flow chart
B)pie chart
C)line chart
D)table
Unlock Deck
Unlock for access to all 50 flashcards in this deck.
Unlock Deck
k this deck
22
Which of the following is an accurate statement concerning the design of pie charts?
A)Position the smallest slice or the slice to be emphasized beginning at the twelve o'clock position.
B)Working counterclockwise, place all slices in descending order of size.
C)Label only important slices with information about the quantity (percent, dollars, etc.) of each slice.
D)If it is not possible to place appropriate labeling information beside each slice, a legend can be used.
Unlock Deck
Unlock for access to all 50 flashcards in this deck.
Unlock Deck
k this deck
23
In formatting a report, if one discovers that an entire table will not fit on the bottom of a page, he or she should:
A)continue the graphic interpretation to the bottom of the page and begin the next page with the table.
B)begin the table, allow an adequate margin at the bottom of the page, and complete the table at the top of the next page.
C)end the page with the introduction to the table, regardless of space left on the page.
D)place the table prior to the text reference to it if that placement will allow the entire table to appear on that page.
Unlock Deck
Unlock for access to all 50 flashcards in this deck.
Unlock Deck
k this deck
24
Which of the following numbering systems is recommended when incorporating graphs, pictures, and tables into a written report?
A)Number the graphs as "Graph 1," etc., the pictures as "Figure 1," etc., and the tables as "Table 1," etc.
B)Number the graphs and the pictures as Figure 1," etc., and the tables as Table 1," etc.
C)Number all graphs, pictures, and tables in a single numbering system, such as "Figure 1, Figure 2," etc.
D)Use only Roman numerals while numbering any graphic.
Unlock Deck
Unlock for access to all 50 flashcards in this deck.
Unlock Deck
k this deck
25
Allen is preparing a pie chart for the Empty Stocking Fund to show the proportionate low spending on administrative overhead as compared with services for children. The pie chart consists of several percentages. To make his graphic more understandable to readers, Allen should:
A)begin with the smallest slice at the 12 o'clock position and position the remaining slices in ascending order of size.
B)explode the administrative overhead slice.
C)label only the slices that reflect service programs.
D)use a legend to identify the color for each slice.
A)begin with the smallest slice at the 12 o'clock position and position the remaining slices in ascending order of size.
B)explode the administrative overhead slice.
C)label only the slices that reflect service programs.
D)use a legend to identify the color for each slice.
Unlock Deck
Unlock for access to all 50 flashcards in this deck.
Unlock Deck
k this deck
26
All types of illustrations used in written and spoken reports are known as _____.
A)literary devices
B)graphics
C)verbal cues
D)annotations
A)literary devices
B)graphics
C)verbal cues
D)annotations
Unlock Deck
Unlock for access to all 50 flashcards in this deck.
Unlock Deck
k this deck
27
Placing graphic material in the appendix is:
A)recommended when graphics make the discussion complicated to follow.
B)recommended at all times to simplify text preparation.
C)not recommended if the information is quantitative.
D)not recommended if the information is accurate.
A)recommended when graphics make the discussion complicated to follow.
B)recommended at all times to simplify text preparation.
C)not recommended if the information is quantitative.
D)not recommended if the information is accurate.
Unlock Deck
Unlock for access to all 50 flashcards in this deck.
Unlock Deck
k this deck
28
Stacy is tasked with presenting sales figures of the five newly opened department stores of the Illumination Company in the state of Missouri. These data should be represented in a _____.
A)photograph
B)pictogram
C)map
D)Gantt chart
A)photograph
B)pictogram
C)map
D)Gantt chart
Unlock Deck
Unlock for access to all 50 flashcards in this deck.
Unlock Deck
k this deck
29
Which of the following best describes the objective of the Gantt chart?
A)It is used to compare one quantity with another.
B)It is used to illustrate changes in quantities over time.
C)It is used to track progress toward completing a project.
D)It is used to illustrate a process or procedure.
A)It is used to compare one quantity with another.
B)It is used to illustrate changes in quantities over time.
C)It is used to track progress toward completing a project.
D)It is used to illustrate a process or procedure.
Unlock Deck
Unlock for access to all 50 flashcards in this deck.
Unlock Deck
k this deck
30
Logan is compiling data on the sales of video game consoles over the last five years, with proportionate sales reflected for four age categories for each year. This data should be represented on a _____.
A)segmented bar chart
B)Nolan chart
C)line chart
D)pie chart
A)segmented bar chart
B)Nolan chart
C)line chart
D)pie chart
Unlock Deck
Unlock for access to all 50 flashcards in this deck.
Unlock Deck
k this deck
31
Thomas is writing a report that contains a column (vertical) bar chart that shows last year's employee enrollment in three management training programs: conflict resolution, time management, and team building. Which of the following statements best interprets and analyzes the graph?
A)Figure 1 shows enrollment for each of the management training programs we offer.
B)As Figure 1 indicates, the enrollment for team building was almost double that of time management, and conflict resolution was the highest of the three.
C)The enrollment for time management was 42; for team building it was 81, and for conflict resolution, it was the highest at 127.
D)Figure 1 data indicate that employee management training needs are shifting from training in time management and team building toward conflict resolution.
Unlock Deck
Unlock for access to all 50 flashcards in this deck.
Unlock Deck
k this deck
32
List seven graphic devices to use for data illustration and interpretation; include a major objective or purpose for each.
Unlock Deck
Unlock for access to all 50 flashcards in this deck.
Unlock Deck
k this deck
33
Which of the following sentences best introduces a graph in a written report?
A) Fewer than three percent of the branch managers complained of long working hours, as shown in Figure 7.
B)Figure 7 is shown below.
C)Figure 7 shows the response of managers about working hours.
D)See Figure 7 for details about manager attitudes.
A) Fewer than three percent of the branch managers complained of long working hours, as shown in Figure 7.
B)Figure 7 is shown below.
C)Figure 7 shows the response of managers about working hours.
D)See Figure 7 for details about manager attitudes.
Unlock Deck
Unlock for access to all 50 flashcards in this deck.
Unlock Deck
k this deck
34
Angela needs to produce a graphic for her employees that depicts the process of handling customer service complaints. When representing this type of data, she should ideally use a _____.
A)bar chart
B)flow chart
C)pictogram
D)pie chart
A)bar chart
B)flow chart
C)pictogram
D)pie chart
Unlock Deck
Unlock for access to all 50 flashcards in this deck.
Unlock Deck
k this deck
35
The Board of Education for the State of Maine is compiling information on the number of last year's high school graduates attending each of the state's 19 public universities. To best represent this data graphically, a _____ should be used.
A)bar chart
B)pie chart
C)histogram
D)Gantt chart
A)bar chart
B)pie chart
C)histogram
D)Gantt chart
Unlock Deck
Unlock for access to all 50 flashcards in this deck.
Unlock Deck
k this deck
36
What is meant by "common language
How does common language help professionals manage quantities of data efficiently?
How does common language help professionals manage quantities of data efficiently?
Unlock Deck
Unlock for access to all 50 flashcards in this deck.
Unlock Deck
k this deck
37
Which of the following is an example of an effective talking title?
A)Interest Rates in the U.S.
B)U.S. Rates of Interest from January-April
C)U.S. Interest Rates Declined January-April
D)News on Interest Rates
A)Interest Rates in the U.S.
B)U.S. Rates of Interest from January-April
C)U.S. Interest Rates Declined January-April
D)News on Interest Rates
Unlock Deck
Unlock for access to all 50 flashcards in this deck.
Unlock Deck
k this deck
38
When interpreting and analyzing a graphic presented within the text,
A)restate what the graphic obviously shows to facilitate a deeper level understanding.
B)emphasize the main point with a summary, comparisons to other sources, and speculations on outcomes.
C)include extra graphics in order to reiterate what the main graphic states.
D)list all the statistics already presented in the text emphasizing their importance.
Unlock Deck
Unlock for access to all 50 flashcards in this deck.
Unlock Deck
k this deck
39
Explain why quantitative data from a research study must be condensed into a manageable size before you can interpret it.
Unlock Deck
Unlock for access to all 50 flashcards in this deck.
Unlock Deck
k this deck
40
Which of the following is the correct pattern for incorporating graphs in a text?
A)Introduce, interpret and analyze, and show.
B)Introduce, show, and interpret and analyze.
C)Show, explain, and interpret.
D)Explain, interpret, and show.
A)Introduce, interpret and analyze, and show.
B)Introduce, show, and interpret and analyze.
C)Show, explain, and interpret.
D)Explain, interpret, and show.
Unlock Deck
Unlock for access to all 50 flashcards in this deck.
Unlock Deck
k this deck
41
What are the advantages of using graphics?
Unlock Deck
Unlock for access to all 50 flashcards in this deck.
Unlock Deck
k this deck
42
Creating an Appropriate VisualSusan has been asked to give a presentation on budgeting to help her audience understand where and how they spend their money. From the data that she has gathered, she discovers that the typical household spends their income in the following areas proportionally to their monthly pay:35% Housing20% Transportation20% Food10% Health care and health insurance5% Clothing5% Credit card debt and interest5% EntertainmentSelect an appropriate visual to depict this information and explain why the visual would be appropriate for the presentation.
Unlock Deck
Unlock for access to all 50 flashcards in this deck.
Unlock Deck
k this deck
43
Interpreting Quantitative DataRancorps Inc. has surveyed employees to determine their interest in learning about financial planning. The table shows the total employee responses, using the raw data and percentages. The results of this survey will be reported to the director of Human Resources and used to develop a financial planning training seminar for employees.Required:
Write an analysis of this data that explains the results of the survey. This analysis will appear in the written report to the director of Human Resources.
Write an analysis of this data that explains the results of the survey. This analysis will appear in the written report to the director of Human Resources.
Unlock Deck
Unlock for access to all 50 flashcards in this deck.
Unlock Deck
k this deck
44
Incorporating Graphics in TextThe following are poor examples of an introduction to a graphic. Rewrite each of these sentences to introduce the graphic based on the effective pattern for incorporating graphics in text. Provide any additional information that may be needed.
Unlock Deck
Unlock for access to all 50 flashcards in this deck.
Unlock Deck
k this deck
45
Explain the pattern for incorporating graphics in a text and how this relates to the ideal positioning of a graphic.
Unlock Deck
Unlock for access to all 50 flashcards in this deck.
Unlock Deck
k this deck
46
Explain the advantages of common language.
Unlock Deck
Unlock for access to all 50 flashcards in this deck.
Unlock Deck
k this deck
47
List the general guidelines for constructing pie charts.
Unlock Deck
Unlock for access to all 50 flashcards in this deck.
Unlock Deck
k this deck
48
Discuss the guidelines for interpreting and analyzing a graphic.
Unlock Deck
Unlock for access to all 50 flashcards in this deck.
Unlock Deck
k this deck
49
What questions should be asked to help determine whether using a graphic presentation is appropriate and effective in a written or oral report?
Unlock Deck
Unlock for access to all 50 flashcards in this deck.
Unlock Deck
k this deck
50
List and discuss five suggestions related to constructing bar charts.
Unlock Deck
Unlock for access to all 50 flashcards in this deck.
Unlock Deck
k this deck
Unlock Deck
Unlock for access to all 50 flashcards in this deck.


