Deck 14: OLAP and Data Mining
Full screen (f)
Question
The OLAP cube shown in Figure 33.1 has been prepared for a car rental company that rents out cars to customers throughout the UK. The company wishes to explore which manufacturer, model, engine size and trim (interior finish) generates the most rental income in each location of the UK. For example, the manufacturer Ford has various models including Mondeo, Fiesta and Ka and each model comes in various size of engine such as 1.8 or 1.6 with each available in one of three trim levels of high, medium and low.
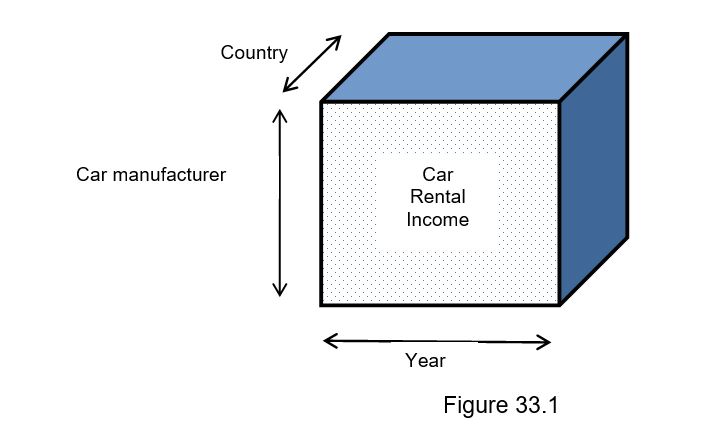
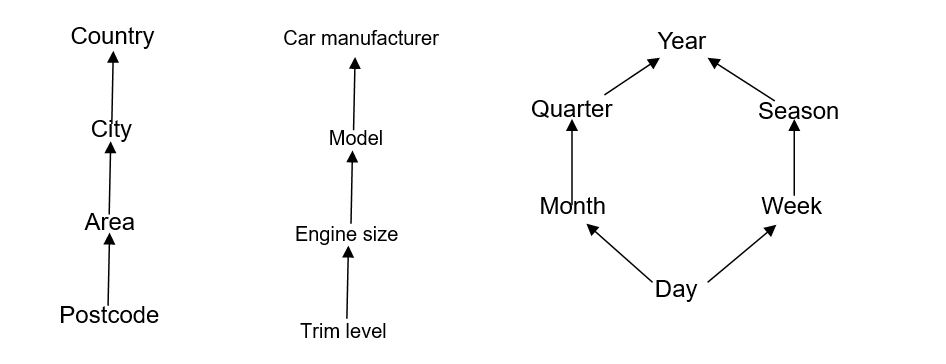
-Present typical dimensional hierarchies (with 4 levels of aggregation) for each dimension shown in Figure 1. The highest level of aggregation for each dimension is shown in Figure 33.1.
-Present typical dimensional hierarchies (with 4 levels of aggregation) for each dimension shown in Figure 1. The highest level of aggregation for each dimension is shown in Figure 33.1.
Question
The OLAP cube shown in Figure 33.1 has been prepared for a car rental company that rents out cars to customers throughout the UK. The company wishes to explore which manufacturer, model, engine size and trim (interior finish) generates the most rental income in each location of the UK. For example, the manufacturer Ford has various models including Mondeo, Fiesta and Ka and each model comes in various size of engine such as 1.8 or 1.6 with each available in one of three trim levels of high, medium and low.
-Describe the four common OLAP operations for querying data. Provide an example of each operation using the OLAP cube in Figure 33.1 and your answer to question 33.1.
-Describe the four common OLAP operations for querying data. Provide an example of each operation using the OLAP cube in Figure 33.1 and your answer to question 33.1.
Question
The OLAP cube shown in Figure 33.1 has been prepared for a car rental company that rents out cars to customers throughout the UK. The company wishes to explore which manufacturer, model, engine size and trim (interior finish) generates the most rental income in each location of the UK. For example, the manufacturer Ford has various models including Mondeo, Fiesta and Ka and each model comes in various size of engine such as 1.8 or 1.6 with each available in one of three trim levels of high, medium and low.
-Describe how SQL has been extended to include OLAP-type analysis of relational data.
-Describe how SQL has been extended to include OLAP-type analysis of relational data.
Question
The OLAP cube shown in the figure below has been prepared for a media (TV programmes and films) streaming service.
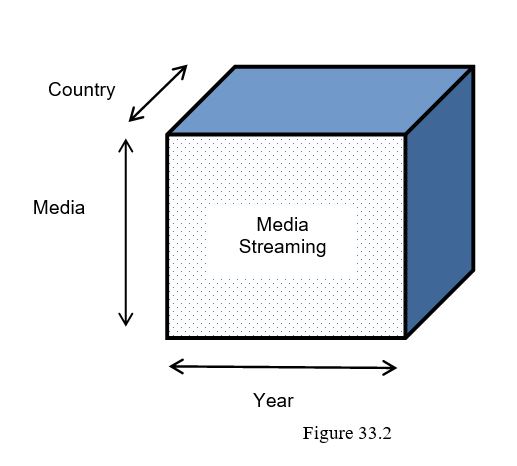
-Describe the four common OLAP operations for querying data. Provide an example of each operation using the OLAP cube in Figure 33.2.
-Describe the four common OLAP operations for querying data. Provide an example of each operation using the OLAP cube in Figure 33.2.
Question
The OLAP cube shown in the figure below has been prepared for a media (TV programmes and films) streaming service.
-What are the three key features that all OLAP applications share?
-What are the three key features that all OLAP applications share?
Question
The OLAP cube shown in the figure below has been prepared for a media (TV programmes and films) streaming service.
-Explain the difference between the output produced by SQL ROLLUP and CUBE queries.
-Explain the difference between the output produced by SQL ROLLUP and CUBE queries.
Question
Question
Question
Question
Question

Unlock Deck
Sign up to unlock the cards in this deck!
Unlock Deck
Unlock Deck
1/11
Play
Full screen (f)
Deck 14: OLAP and Data Mining
1
The OLAP cube shown in Figure 33.1 has been prepared for a car rental company that rents out cars to customers throughout the UK. The company wishes to explore which manufacturer, model, engine size and trim (interior finish) generates the most rental income in each location of the UK. For example, the manufacturer Ford has various models including Mondeo, Fiesta and Ka and each model comes in various size of engine such as 1.8 or 1.6 with each available in one of three trim levels of high, medium and low.
-Present typical dimensional hierarchies (with 4 levels of aggregation) for each dimension shown in Figure 1. The highest level of aggregation for each dimension is shown in Figure 33.1.
-Present typical dimensional hierarchies (with 4 levels of aggregation) for each dimension shown in Figure 1. The highest level of aggregation for each dimension is shown in Figure 33.1.
2
The OLAP cube shown in Figure 33.1 has been prepared for a car rental company that rents out cars to customers throughout the UK. The company wishes to explore which manufacturer, model, engine size and trim (interior finish) generates the most rental income in each location of the UK. For example, the manufacturer Ford has various models including Mondeo, Fiesta and Ka and each model comes in various size of engine such as 1.8 or 1.6 with each available in one of three trim levels of high, medium and low.
-Describe the four common OLAP operations for querying data. Provide an example of each operation using the OLAP cube in Figure 33.1 and your answer to question 33.1.
-Describe the four common OLAP operations for querying data. Provide an example of each operation using the OLAP cube in Figure 33.1 and your answer to question 33.1.
OLAP operations include:
Roll-up, drill-down, slice and dice, pivoting.
Roll-up performs aggregations on the data by moving up the dimensional hierarchy or by dimensional reduction e.g. 3-D to 2-D.
For example, {location, manufacturer and time} analysis of rental income to {location, manufacturer} analysis of rental income.
For example, analysis of weekly rental income to analysis of monthly rental income.
Drill-down is the reverse of roll-up and involves revealing the detailed data that forms the aggregated data. Drill-down can be performed by moving down the dimensional hierarchy or by dimensional introduction e.g. 2-D to 3-D.
For example, {location, manufacturer} analysis of rental income to {location, manufacturer and time} analysis of rental income.
For example, analysis of monthly rental income to analysis of weekly rental income.
Slice and dice - ability to look at data from different viewpoints. The slice operation performs a selection on one dimension of the data whereas dice uses two or more dimensions.
For example, a slice is analysis of rental income according to {time = '2012'} OR {manufacturer = 'Ford'} OR {location = 'London'}
For example, a dice is analysis of rental income according to {time = '2012'} and {manufacturer = 'Ford'} OR {time = '2012'} and {manufacturer = 'Ford'} and {location = 'London'}
Pivot - ability to rotate the data to provide an alternative view of the same data.
For example, analysis of rental income using the location (city) as x-axis against time (year) as the y-axis can be rotated so that time (year) is the x-axis against location (city) is the y-axis.
3
The OLAP cube shown in Figure 33.1 has been prepared for a car rental company that rents out cars to customers throughout the UK. The company wishes to explore which manufacturer, model, engine size and trim (interior finish) generates the most rental income in each location of the UK. For example, the manufacturer Ford has various models including Mondeo, Fiesta and Ka and each model comes in various size of engine such as 1.8 or 1.6 with each available in one of three trim levels of high, medium and low.
-Describe how SQL has been extended to include OLAP-type analysis of relational data.
-Describe how SQL has been extended to include OLAP-type analysis of relational data.
The extensions to SQL are collectively referred to as the 'OLAP package' and includes:
• Extended Grouping capabilities such as ROLLUP and CUBE.
• Extended OLAP operators such as Ranking and Window calculations.
Extended Grouping Capabilities
Aggregation is a fundamental part of OLAP. To improve aggregation capabilities the SQL standard provides extensions to the GROUP BY clause such as the ROLLUP and CUBE functions. ROLLUP supports calculations using aggregations such as SUM, COUNT, MAX, MIN, and AVG at increasing levels of aggregation, from the most detailed up to a grand total. CUBE is similar to ROLLUP, enabling a single statement to calculate all possible combinations of aggregations. CUBE can generate the information needed in cross-tabulation reports with a single query.
Elementary OLAP Operators
Supports a variety of operations such as rankings and window calculations. Ranking functions include cumulative distributions, percent rank, and N-tiles. Windowing allows the calculation of cumulative and moving aggregations using functions such as SUM, AVG, MIN, and COUNT.
4
The OLAP cube shown in the figure below has been prepared for a media (TV programmes and films) streaming service.
-Describe the four common OLAP operations for querying data. Provide an example of each operation using the OLAP cube in Figure 33.2.
-Describe the four common OLAP operations for querying data. Provide an example of each operation using the OLAP cube in Figure 33.2.
Unlock Deck
Unlock for access to all 11 flashcards in this deck.
Unlock Deck
k this deck
5
The OLAP cube shown in the figure below has been prepared for a media (TV programmes and films) streaming service.
-What are the three key features that all OLAP applications share?
-What are the three key features that all OLAP applications share?
Unlock Deck
Unlock for access to all 11 flashcards in this deck.
Unlock Deck
k this deck
6
The OLAP cube shown in the figure below has been prepared for a media (TV programmes and films) streaming service.
-Explain the difference between the output produced by SQL ROLLUP and CUBE queries.
-Explain the difference between the output produced by SQL ROLLUP and CUBE queries.
Unlock Deck
Unlock for access to all 11 flashcards in this deck.
Unlock Deck
k this deck
7
Data mining can provide huge paybacks for companies who have made a significant investment in data warehousing. Describe the advantages that data mining tools offer the business analyst.
Unlock Deck
Unlock for access to all 11 flashcards in this deck.
Unlock Deck
k this deck
8
Explain why a data warehouse is well equipped for providing the data for data mining.
Unlock Deck
Unlock for access to all 11 flashcards in this deck.
Unlock Deck
k this deck
9
Identify the factors that have led to the growing popularity of data mining.
Unlock Deck
Unlock for access to all 11 flashcards in this deck.
Unlock Deck
k this deck
10
Discuss the relationship between data mining, OLAP and data warehousing.
Unlock Deck
Unlock for access to all 11 flashcards in this deck.
Unlock Deck
k this deck
11
There are a growing number of data mining tools. Describe four key features that these tools offer the analyst.
Unlock Deck
Unlock for access to all 11 flashcards in this deck.
Unlock Deck
k this deck
Unlock Deck
Unlock for access to all 11 flashcards in this deck.


