Deck 4: Inference From Data: Principles
Full screen (f)
Question
Question
Question
Question
Question
Question
Question
Question
Question
Question
Question
Question
Question
Question
Question
Question
Question
Question
Question
Question
Question
Question
Question
Question
Question
Question
Question
Question
Question
Question
Question
Question
Question
Question
Question
Question
Question
Question
Question
Question
Question
Question
Question
Question
Question
Question
Question
Students in an introductory statistics class were asked how many states they have visited. The following output pertains to the sample results: 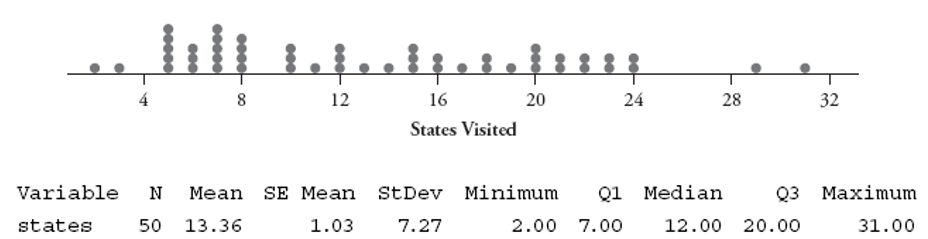
a. Determine a confidence interval for the population mean number of states visited among all students at this university.
b. Check and comment on whether the technical conditions of this confidence interval are satisfied.
c. For what proportion of students in the sample is the number of states visited within the interval calculated in part a?
d. Should you expect your answer to part to be close to ? Explain why or why not.
e. Based on your interval, what can you say about the p-value if you were to conduct a two-sided significance test of whether the population mean differs from 15? Explain briefly, without conducting a test or doing new calculations.
Question
Question
Question
Question
Question
Question
Question
Question
Question
Question

Unlock Deck
Sign up to unlock the cards in this deck!
Unlock Deck
Unlock Deck
1/57
Play
Full screen (f)
Deck 4: Inference From Data: Principles
1
Students enrolled in an introductory statistics course at a university were asked to take a survey that indicated whether the student has a visual or verbal learning style. Of the 39 students who took the survey, 25 were judged to have a visual learning style and 14 were considered verbal learners.
-Determine a confidence interval for the population proportion who are visual learners at this university.
-Determine a confidence interval for the population proportion who are visual learners at this university.
A confidence interval for the population proportion who are visual learners at this university is 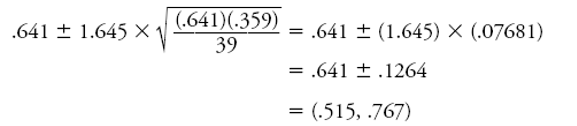
2
Students enrolled in an introductory statistics course at a university were asked to take a survey that indicated whether the student has a visual or verbal learning style. Of the 39 students who took the survey, 25 were judged to have a visual learning style and 14 were considered verbal learners.
-Write a sentence interpreting what this interval says.
-Write a sentence interpreting what this interval says.
You are confident the population proportion of visual learners at this university is between and .
3
Students enrolled in an introductory statistics course at a university were asked to take a survey that indicated whether the student has a visual or verbal learning style. Of the 39 students who took the survey, 25 were judged to have a visual learning style and 14 were considered verbal learners.
-How would a confidence interval compare to this one in terms of its midpoint and half-width? (Do not bother to determine this interval.)
-How would a confidence interval compare to this one in terms of its midpoint and half-width? (Do not bother to determine this interval.)
A confidence interval would have the same midpoint (.641) as the confidence interval, but it would have a larger half-width because the value used to create the interval would be greater than 1.645 .
4
Students enrolled in an introductory statistics course at a university were asked to take a survey that indicated whether the student has a visual or verbal learning style. Of the 39 students who took the survey, 25 were judged to have a visual learning style and 14 were considered verbal learners.
-Check whether the technical condition concerning sample size is satisfied here.
-Check whether the technical condition concerning sample size is satisfied here.
Unlock Deck
Unlock for access to all 57 flashcards in this deck.
Unlock Deck
k this deck
5
Students enrolled in an introductory statistics course at a university were asked to take a survey that indicated whether the student has a visual or verbal learning style. Of the 39 students who took the survey, 25 were judged to have a visual learning style and 14 were considered verbal learners.
-Explain why you might feel wary about applying this confidence interval to the population of all students at this university.
-Explain why you might feel wary about applying this confidence interval to the population of all students at this university.
Unlock Deck
Unlock for access to all 57 flashcards in this deck.
Unlock Deck
k this deck
6
You have learned that a confidence interval for is given by: .
-What does the symbol stand for?
-What does the symbol stand for?
Unlock Deck
Unlock for access to all 57 flashcards in this deck.
Unlock Deck
k this deck
7
You have learned that a confidence interval for is given by: .
-What does the symbol stand for?
-What does the symbol stand for?
Unlock Deck
Unlock for access to all 57 flashcards in this deck.
Unlock Deck
k this deck
8
You have learned that a confidence interval for is given by: .
-What does the symbol stand for?
-What does the symbol stand for?
Unlock Deck
Unlock for access to all 57 flashcards in this deck.
Unlock Deck
k this deck
9
You have learned that a confidence interval for is given by: .
-Does increasing the confidence level lead to a larger value of , a smaller value of , or no change in the value of ?
-Does increasing the confidence level lead to a larger value of , a smaller value of , or no change in the value of ?
Unlock Deck
Unlock for access to all 57 flashcards in this deck.
Unlock Deck
k this deck
10
You have learned that a confidence interval for is given by: .
-Does increasing the sample size lead to a larger value of , a smaller value of , or no change in the value of ?
-Does increasing the sample size lead to a larger value of , a smaller value of , or no change in the value of ?
Unlock Deck
Unlock for access to all 57 flashcards in this deck.
Unlock Deck
k this deck
11
Students enrolled in an introductory statistics course at a university were asked to take a survey that indicated whether the student has a visual or verbal learning style. Of the 39 students who took the survey, 25 were judged to have a visual learning style, and 14 were considered verbal learners. Consider these 39 students to be a random sample of students at this university. Conduct a test of significance of whether these sample data provide strong evidence that more than half of all students at the university have a visual learning style. Be sure to report the hypotheses, test statistic, and -value. Also check the technical conditions of the procedure, and write a conclusion in context.
Unlock Deck
Unlock for access to all 57 flashcards in this deck.
Unlock Deck
k this deck
12
Do hypotheses involve parameters or statistics?
Suppose that you and a friend analyze the same sample data and conduct a test of significance about the same conjectured value, but you use a two-sided alternative and your friend uses a one-sided alternative.
Suppose that you and a friend analyze the same sample data and conduct a test of significance about the same conjectured value, but you use a two-sided alternative and your friend uses a one-sided alternative.
Unlock Deck
Unlock for access to all 57 flashcards in this deck.
Unlock Deck
k this deck
13
Will you and your friend obtain different values of the test statistic? Explain briefly.
Unlock Deck
Unlock for access to all 57 flashcards in this deck.
Unlock Deck
k this deck
14
Will you and your friend obtain different values of the -value? Explain briefly. Suppose that a random sample of students at a university takes a survey that indicates whether the student has a visual or verbal learning style.
Unlock Deck
Unlock for access to all 57 flashcards in this deck.
Unlock Deck
k this deck
15
If the instructor suspects that most students at the university are visual learners, state the null and alternative hypotheses (in symbols and in words) to be tested.
Unlock Deck
Unlock for access to all 57 flashcards in this deck.
Unlock Deck
k this deck
16
If the instructor has read about national results indicating that two-thirds of all students are visual learners, state the null and alternative hypotheses (in symbols and in words) to be tested in order to assess whether the same proportion holds for that university.
Unlock Deck
Unlock for access to all 57 flashcards in this deck.
Unlock Deck
k this deck
17
In the August 12, 2007, issue of Parade magazine (which comes with the Sunday newspaper for millions of Americans), readers were asked to go online and vote on this question: Should the drinking age be lowered? The results were published in the October 7 issue; more than 14,000 readers voted, and 48\% said "yes."
-Use these sample data to determine a confidence interval for the population proportion who favor lowering the drinking age.
-Use these sample data to determine a confidence interval for the population proportion who favor lowering the drinking age.
Unlock Deck
Unlock for access to all 57 flashcards in this deck.
Unlock Deck
k this deck
18
In the August 12, 2007, issue of Parade magazine (which comes with the Sunday newspaper for millions of Americans), readers were asked to go online and vote on this question: Should the drinking age be lowered? The results were published in the October 7 issue; more than 14,000 readers voted, and 48\% said "yes."
-Report the margin-of-error for this confidence interval.
-Report the margin-of-error for this confidence interval.
Unlock Deck
Unlock for access to all 57 flashcards in this deck.
Unlock Deck
k this deck
19
In the August 12, 2007, issue of Parade magazine (which comes with the Sunday newspaper for millions of Americans), readers were asked to go online and vote on this question: Should the drinking age be lowered? The results were published in the October 7 issue; more than 14,000 readers voted, and 48\% said "yes."
-Explain why this interval is so narrow.
-Explain why this interval is so narrow.
Unlock Deck
Unlock for access to all 57 flashcards in this deck.
Unlock Deck
k this deck
20
In the August 12, 2007, issue of Parade magazine (which comes with the Sunday newspaper for millions of Americans), readers were asked to go online and vote on this question: Should the drinking age be lowered? The results were published in the October 7 issue; more than 14,000 readers voted, and 48\% said "yes."
-Without conducting a test of significance, what can you say about the -value if you were to test whether the population proportion differs from one-half? Explain.
-Without conducting a test of significance, what can you say about the -value if you were to test whether the population proportion differs from one-half? Explain.
Unlock Deck
Unlock for access to all 57 flashcards in this deck.
Unlock Deck
k this deck
21
In the August 12, 2007, issue of Parade magazine (which comes with the Sunday newspaper for millions of Americans), readers were asked to go online and vote on this question: Should the drinking age be lowered? The results were published in the October 7 issue; more than 14,000 readers voted, and 48\% said "yes."
-Does Parade's sampling method give you any reason to doubt that the confidence interval in "sample data to determine a confidence interval for the population proportion who favor lowering the drinking age."? Explain.
-Does Parade's sampling method give you any reason to doubt that the confidence interval in "sample data to determine a confidence interval for the population proportion who favor lowering the drinking age."? Explain.
Unlock Deck
Unlock for access to all 57 flashcards in this deck.
Unlock Deck
k this deck
22
Students enrolled in an introductory statistics course at a university were asked to take a survey that indicated whether the student had a visual or verbal learning style. Of the 39 students who took the survey, 25 were judged to have a visual learning style, and 14 were considered verbal learners. Treat these students as a random sample of students at this university.
-State the null and alternative hypotheses for testing whether the data provide strong evidence against the hypothesis that two-thirds of all students at the university are visual learners. The -value for this test turns out to be 734 .
-State the null and alternative hypotheses for testing whether the data provide strong evidence against the hypothesis that two-thirds of all students at the university are visual learners. The -value for this test turns out to be 734 .
Unlock Deck
Unlock for access to all 57 flashcards in this deck.
Unlock Deck
k this deck
23
Students enrolled in an introductory statistics course at a university were asked to take a survey that indicated whether the student had a visual or verbal learning style. Of the 39 students who took the survey, 25 were judged to have a visual learning style, and 14 were considered verbal learners. Treat these students as a random sample of students at this university.
-Describe the conclusion that you would reach at the significance level.
-Describe the conclusion that you would reach at the significance level.
Unlock Deck
Unlock for access to all 57 flashcards in this deck.
Unlock Deck
k this deck
24
Students enrolled in an introductory statistics course at a university were asked to take a survey that indicated whether the student had a visual or verbal learning style. Of the 39 students who took the survey, 25 were judged to have a visual learning style, and 14 were considered verbal learners. Treat these students as a random sample of students at this university.
-If the sample size had been ten times larger and the results had turned out proportionally identical, would the -value have been larger, smaller, or the same?
-If the sample size had been ten times larger and the results had turned out proportionally identical, would the -value have been larger, smaller, or the same?
Unlock Deck
Unlock for access to all 57 flashcards in this deck.
Unlock Deck
k this deck
25
Students enrolled in an introductory statistics course at a university were asked to take a survey that indicated whether the student had a visual or verbal learning style. Of the 39 students who took the survey, 25 were judged to have a visual learning style, and 14 were considered verbal learners. Treat these students as a random sample of students at this university.
-Describe what a Type I error means in this situation.
-Describe what a Type I error means in this situation.
Unlock Deck
Unlock for access to all 57 flashcards in this deck.
Unlock Deck
k this deck
26
Students enrolled in an introductory statistics course at a university were asked to take a survey that indicated whether the student had a visual or verbal learning style. Of the 39 students who took the survey, 25 were judged to have a visual learning style, and 14 were considered verbal learners. Treat these students as a random sample of students at this university.
-Describe what a Type II error means in this situation.
-Describe what a Type II error means in this situation.
Unlock Deck
Unlock for access to all 57 flashcards in this deck.
Unlock Deck
k this deck
27
The following data are monthly rents (in dollars) of studio and one-bedroom apartments in Harrisburg, Pennsylvania, in 2007, obtained from a random sample of such apartments advertised at {rent.com} in July 2007:
The mean of these ten rent prices is , and the standard deviation is .
-Determine the standard error of the sample mean.
The mean of these ten rent prices is , and the standard deviation is .
-Determine the standard error of the sample mean.
Unlock Deck
Unlock for access to all 57 flashcards in this deck.
Unlock Deck
k this deck
28
The following data are monthly rents (in dollars) of studio and one-bedroom apartments in Harrisburg, Pennsylvania, in 2007, obtained from a random sample of such apartments advertised at {rent.com} in July 2007:
The mean of these ten rent prices is , and the standard deviation is .
-Describe what the population mean means in this context.
The mean of these ten rent prices is , and the standard deviation is .
-Describe what the population mean means in this context.
Unlock Deck
Unlock for access to all 57 flashcards in this deck.
Unlock Deck
k this deck
29
The following data are monthly rents (in dollars) of studio and one-bedroom apartments in Harrisburg, Pennsylvania, in 2007, obtained from a random sample of such apartments advertised at {rent.com} in July 2007:
The mean of these ten rent prices is , and the standard deviation is .
-Determine a confidence interval for .
The mean of these ten rent prices is , and the standard deviation is .
-Determine a confidence interval for .
Unlock Deck
Unlock for access to all 57 flashcards in this deck.
Unlock Deck
k this deck
30
The following data are monthly rents (in dollars) of studio and one-bedroom apartments in Harrisburg, Pennsylvania, in 2007, obtained from a random sample of such apartments advertised at {rent.com} in July 2007:
The mean of these ten rent prices is , and the standard deviation is .
-Write a sentence interpreting what this interval means.
The mean of these ten rent prices is , and the standard deviation is .
-Write a sentence interpreting what this interval means.
Unlock Deck
Unlock for access to all 57 flashcards in this deck.
Unlock Deck
k this deck
31
The following data are monthly rents (in dollars) of studio and one-bedroom apartments in Harrisburg, Pennsylvania, in 2007, obtained from a random sample of such apartments advertised at {rent.com} in July 2007:
The mean of these ten rent prices is , and the standard deviation is .
-Would you expect about of the studio and one-bedroom apartments in Harrisburg in July 2007 to have a rent price within this interval? Explain.
The mean of these ten rent prices is , and the standard deviation is .
-Would you expect about of the studio and one-bedroom apartments in Harrisburg in July 2007 to have a rent price within this interval? Explain.
Unlock Deck
Unlock for access to all 57 flashcards in this deck.
Unlock Deck
k this deck
32
You have learned that a confidence interval for is given by: .
-What does the symbol stand for?
-What does the symbol stand for?
Unlock Deck
Unlock for access to all 57 flashcards in this deck.
Unlock Deck
k this deck
33
You have learned that a confidence interval for is given by: .
-What does the symbol stand for?
-What does the symbol stand for?
Unlock Deck
Unlock for access to all 57 flashcards in this deck.
Unlock Deck
k this deck
34
You have learned that a confidence interval for is given by: .
-What does the symbol stand for?
-What does the symbol stand for?
Unlock Deck
Unlock for access to all 57 flashcards in this deck.
Unlock Deck
k this deck
35
You have learned that a confidence interval for is given by: .
-Does increasing the confidence level lead to a larger value of , a smaller value of , or no change in the value of ?
-Does increasing the confidence level lead to a larger value of , a smaller value of , or no change in the value of ?
Unlock Deck
Unlock for access to all 57 flashcards in this deck.
Unlock Deck
k this deck
36
You have learned that a confidence interval for is given by: .
-Does increasing the sample size lead to a larger value of , a smaller value of , or no change in the value of ?
-Does increasing the sample size lead to a larger value of , a smaller value of , or no change in the value of ?
Unlock Deck
Unlock for access to all 57 flashcards in this deck.
Unlock Deck
k this deck
37
Students enrolled in an introductory statistics course at a university were asked to take a survey that indicated whether the student's learning style was more visual or verbal. Each student received a numerical score ranging from -11 to +11 . Negative scores indicated a visual learner, and positive scores indicated a verbal learner. The closer the score was to -11 or +11 , the stronger the student's inclination toward that learning style. A score of 0 would indicate neutrality between visual or verbal learning. For the 39 students who took the survey, the mean score was -2.744 , and the standard deviation was 4.988 .
-State the null and alternative hypotheses for testing whether the mean score (among all students at this university) differs from 0 .
-State the null and alternative hypotheses for testing whether the mean score (among all students at this university) differs from 0 .
Unlock Deck
Unlock for access to all 57 flashcards in this deck.
Unlock Deck
k this deck
38
Students enrolled in an introductory statistics course at a university were asked to take a survey that indicated whether the student's learning style was more visual or verbal. Each student received a numerical score ranging from -11 to +11 . Negative scores indicated a visual learner, and positive scores indicated a verbal learner. The closer the score was to -11 or +11 , the stronger the student's inclination toward that learning style. A score of 0 would indicate neutrality between visual or verbal learning. For the 39 students who took the survey, the mean score was -2.744 , and the standard deviation was 4.988 .
-Calculate the value of the -test statistic for the hypotheses stated in " State the null and alternative hypotheses for testing whether the mean score (among all students at this university) differs from 0" .
-Calculate the value of the -test statistic for the hypotheses stated in " State the null and alternative hypotheses for testing whether the mean score (among all students at this university) differs from 0" .
Unlock Deck
Unlock for access to all 57 flashcards in this deck.
Unlock Deck
k this deck
39
Students enrolled in an introductory statistics course at a university were asked to take a survey that indicated whether the student's learning style was more visual or verbal. Each student received a numerical score ranging from -11 to +11 . Negative scores indicated a visual learner, and positive scores indicated a verbal learner. The closer the score was to -11 or +11 , the stronger the student's inclination toward that learning style. A score of 0 would indicate neutrality between visual or verbal learning. For the 39 students who took the survey, the mean score was -2.744 , and the standard deviation was 4.988 .
-Determine the -value of the test as accurately as possible.
-Determine the -value of the test as accurately as possible.
Unlock Deck
Unlock for access to all 57 flashcards in this deck.
Unlock Deck
k this deck
40
Students enrolled in an introductory statistics course at a university were asked to take a survey that indicated whether the student's learning style was more visual or verbal. Each student received a numerical score ranging from -11 to +11 . Negative scores indicated a visual learner, and positive scores indicated a verbal learner. The closer the score was to -11 or +11 , the stronger the student's inclination toward that learning style. A score of 0 would indicate neutrality between visual or verbal learning. For the 39 students who took the survey, the mean score was -2.744 , and the standard deviation was 4.988 .
-Summarize the conclusion that you would draw from this test.
-Summarize the conclusion that you would draw from this test.
Unlock Deck
Unlock for access to all 57 flashcards in this deck.
Unlock Deck
k this deck
41
Students enrolled in an introductory statistics course at a university were asked to take a survey that indicated whether the student's learning style was more visual or verbal. Each student received a numerical score ranging from -11 to +11 . Negative scores indicated a visual learner, and positive scores indicated a verbal learner. The closer the score was to -11 or +11 , the stronger the student's inclination toward that learning style. A score of 0 would indicate neutrality between visual or verbal learning. For the 39 students who took the survey, the mean score was -2.744 , and the standard deviation was 4.988 .
-Comment on whether the technical conditions of this -test are satisfied.
-Comment on whether the technical conditions of this -test are satisfied.
Unlock Deck
Unlock for access to all 57 flashcards in this deck.
Unlock Deck
k this deck
42
Suppose you measure the heights of a random sample of chief executive officers (CEOs) in order to study whether CEOs tend to be taller than the national average height of 69 inches.
-State the relevant null and alternative hypotheses.
-State the relevant null and alternative hypotheses.
Unlock Deck
Unlock for access to all 57 flashcards in this deck.
Unlock Deck
k this deck
43
Suppose you measure the heights of a random sample of chief executive officers (CEOs) in order to study whether CEOs tend to be taller than the national average height of 69 inches.
-If all else (sample size and standard deviation) were the same, which would give stronger evidence that CEOs do tend to be taller than an average height of 69 inches: a sample mean of 70 inches or a sample mean of 71 inches? Explain.
-If all else (sample size and standard deviation) were the same, which would give stronger evidence that CEOs do tend to be taller than an average height of 69 inches: a sample mean of 70 inches or a sample mean of 71 inches? Explain.
Unlock Deck
Unlock for access to all 57 flashcards in this deck.
Unlock Deck
k this deck
44
Suppose you measure the heights of a random sample of chief executive officers (CEOs) in order to study whether CEOs tend to be taller than the national average height of 69 inches.
-If the sample mean turned out to be 70 inches, which would give a smaller -value: a sample standard deviation of 3 inches or a sample standard deviation of 5 inches? Explain.
-If the sample mean turned out to be 70 inches, which would give a smaller -value: a sample standard deviation of 3 inches or a sample standard deviation of 5 inches? Explain.
Unlock Deck
Unlock for access to all 57 flashcards in this deck.
Unlock Deck
k this deck
45
Suppose you measure the heights of a random sample of chief executive officers (CEOs) in order to study whether CEOs tend to be taller than the national average height of 69 inches.
-If the sample mean turned out to be 70 inches, which would give a smaller -value: a sample size of 50 CEOs or a sample size of 200 CEOs?
-If the sample mean turned out to be 70 inches, which would give a smaller -value: a sample size of 50 CEOs or a sample size of 200 CEOs?
Unlock Deck
Unlock for access to all 57 flashcards in this deck.
Unlock Deck
k this deck
46
The National Institutes of Health funded a study of a random sample of 856 people age 71 and older in the United States. They found that of these people suffer from Alzheimer's Disease.
a. Identify the population of interest in this study.
b. Is .097 (the decimal version of ) a parameter or a statistic? What symbol do you use to represent it?
c. Determine a 95\% confidence interval for the proportion of elderly Americans who have Alzheimer's disease.
d. Check and comment on whether the technical conditions required for this confidence interval are satisfied.
e. If you were to determine instead a , how would it differ and how would it be similar to the result in part ? (Do not bother to do the calculations.)
f. Determine how many people would have to be studied in a new sample if you want to estimate the population proportion to within .02 with confidence. (Use the result of the current sample in your determination of the new sample size.)
Unlock Deck
Unlock for access to all 57 flashcards in this deck.
Unlock Deck
k this deck
47
Students in an introductory statistics class were asked how many states they have visited. The following output pertains to the sample results:
a. Determine a confidence interval for the population mean number of states visited among all students at this university.
b. Check and comment on whether the technical conditions of this confidence interval are satisfied.
c. For what proportion of students in the sample is the number of states visited within the interval calculated in part a?
d. Should you expect your answer to part to be close to ? Explain why or why not.
e. Based on your interval, what can you say about the p-value if you were to conduct a two-sided significance test of whether the population mean differs from 15? Explain briefly, without conducting a test or doing new calculations.
Unlock Deck
Unlock for access to all 57 flashcards in this deck.
Unlock Deck
k this deck
48
It has been conjectured that two-thirds of all students have an active, as opposed to reflective, learning style. Data are available from a large sample of introductory statistics students at a public university in the eastern United States, who took a survey that assessed their learning style as active or reflective. Of the 962 students who participated, 596 were diagnosed as active learners and 366 as reflective learners. Use these sample data to conduct a significance test of the conjecture that two-thirds of all students have an active learning style. Report the hypotheses, test statistic, and -value. Include a check of technical conditions. Also indicate your test decision at the significance level, and summarize your conclusion in context.
Unlock Deck
Unlock for access to all 57 flashcards in this deck.
Unlock Deck
k this deck
49
a. Suppose you conduct a significance test and decide to reject the null hypothesis at the level. If you conduct the same test on the same data but instead use the level, what decision would you make? (Select your answer. Do not bother to explain.)
-Reject
-Fail to reject
-Cannot say without more information
b. Suppose you conduct a significance test and decide to fail to reject the null hypothesis at the level. If you conduct the same test on the same data but instead use the level, what decision would you make? (Select your answer. Do not bother to explain.)
-Reject
-Fail to reject
-Cannot say without more information
c. Suppose that we tell you that we flipped a coin multiple times and it landed heads of the time. Would you be reasonably convinced that this was not a fair coin (where "fair" means that the coin has a .5 probability of landing "heads")? If so, explain why. If not, describe what additional information you would ask for and explain why it is necessary.
-Reject
-Fail to reject
-Cannot say without more information
b. Suppose you conduct a significance test and decide to fail to reject the null hypothesis at the level. If you conduct the same test on the same data but instead use the level, what decision would you make? (Select your answer. Do not bother to explain.)
-Reject
-Fail to reject
-Cannot say without more information
c. Suppose that we tell you that we flipped a coin multiple times and it landed heads of the time. Would you be reasonably convinced that this was not a fair coin (where "fair" means that the coin has a .5 probability of landing "heads")? If so, explain why. If not, describe what additional information you would ask for and explain why it is necessary.
Unlock Deck
Unlock for access to all 57 flashcards in this deck.
Unlock Deck
k this deck
50
Explain (briefly) what is wrong with each of the following sets of hypotheses:
a.
b.
c.
d.
a.
b.
c.
d.
Unlock Deck
Unlock for access to all 57 flashcards in this deck.
Unlock Deck
k this deck
51
Suppose you analyze data to assess whether the proportion of heart transplant deaths at St. George's Hospital in London significantly exceeded the national benchmark rate of .
a. Write a sentence describing what committing a Type I error would mean in this study.
b. Write a sentence describing what committing a Type II error would mean in this study.
a. Write a sentence describing what committing a Type I error would mean in this study.
b. Write a sentence describing what committing a Type II error would mean in this study.
Unlock Deck
Unlock for access to all 57 flashcards in this deck.
Unlock Deck
k this deck
52
A student wants to assess whether her dog Muffin tends to chase her blue ball more often than she chases her red ball. The student rolls both a blue ball and a red ball at the same time and observes which ball Muffin chooses to chase. Repeating this process a total of 96 times, the student finds that Muffin chased the blue ball 52 times and the red ball 44 times.
a. What are the observational units in this study?
b. What is the variable in this study?
c. State the appropriate null and alternative hypotheses, in words and in symbols.
d. Calculate the test statistic and -value.
e. Would you reject the null hypothesis at the significance level? Explain.
f. Write a one-sentence conclusion to the student, summarizing what the data reveal about whether her dog Muffin tends to chase her blue ball more often than her red ball. Include an explanation of what the value means in the context of this study.
Unlock Deck
Unlock for access to all 57 flashcards in this deck.
Unlock Deck
k this deck
53
A statistics professor has asked his students to flip coins over the years. He has kept track of how many flips land heads and how many land tails. Combining the results of his students over many years, he has formed a confidence interval for the long-run population proportion of heads to be .
a. Why is this interval so narrow?
b. Suppose he were to conduct a hypothesis test of whether the long-run population proportion of heads differs from one-half. Based on this interval (do not conduct the test), would he reject the null hypothesis at the significance level? Explain briefly (no more than one sentence).
c. Does the interval provide strong evidence that the long-run population proportion of heads is much different from one-half? Explain briefly.
Unlock Deck
Unlock for access to all 57 flashcards in this deck.
Unlock Deck
k this deck
54
a. Suppose Alejandro studies a random sample of data on a categorical variable and calculates a confidence interval for the population proportion to be (.546,.674). Determine what the sample proportion must have been, and explain why.
b. Suppose Brad and Carly plan to collect separate random samples, with Brad using a sample size of 500 and Carly using a sample size of 1500 . If Brad plans to construct a confidence interval for the population proportion and Carly plans to construct a confidence interval, who is more likely to obtain an interval that succeeds in capturing the population proportion? Explain.
c. Suppose three students conduct a group project to estimate the proportion of students at their university who are from a different state. They take a random sample of students and find that of their sample of students are from a different state. They then determine the following confidence intervals for the population proportion who are from a different state. One of these is a confidence interval, one is a confidence interval, and one is incorrect. Identify which is which. (In other words, write " " below the appropriate interval, "99\%" below another, and "incorrect" below the third.)
Unlock Deck
Unlock for access to all 57 flashcards in this deck.
Unlock Deck
k this deck
55
Suppose you want to estimate the proportion of people in your community who would choose Thin Mints as their favorite Girl Scout cookie. Also suppose previous studies have shown this proportion to be around .3 .
a. Determine how many people you would have to sample in order to estimate this proportion to within with confidence. If your boss says that this number (your answer to part a) is too large to be practical, you might respond that a smaller sample size would suffice if either the margin-of-error (.025) or the confidence level were changed.
b. In which direction would the margin-of-error need to change in order for a smaller sample size to suffice?
c. In which direction would the confidence level need to change in order for a smaller sample size to suffice?
Unlock Deck
Unlock for access to all 57 flashcards in this deck.
Unlock Deck
k this deck
56
Students in an introductory statistics class were asked to report the age of their mothers when they were born. Summary statistics include
Sample size: 28 students Sample mean: 29.643 years
Sample standard deviation: 4.564 years
a. Calculate the standard error of this sample mean.
b. Determine and interpret a 90\% confidence interval for the mother's mean age (at student's birth) in the population of all students at this university.
c. How would a confidence interval compare to the interval in terms of its midpoint and halfwidth?
d. Would you expect of the ages in the sample to be within the confidence interval? Explain why or why not.
e. Even if the distribution of mothers' ages were somewhat skewed, would this confidence interval procedure still be valid with these data? Explain why or why not.
Unlock Deck
Unlock for access to all 57 flashcards in this deck.
Unlock Deck
k this deck
57
Reconsider the previous problem about the age of a college student's mother when the student was born. Now suppose you want to conduct a significance test of whether the sample data provide strong evidence that the population mean mother's age is less than 30 years.
a. State the appropriate null and alternative hypotheses in symbols.
b. Calculate the test statistic.
c. Determine (as accurately as possible) the -value of the test.
d. State your test decision at the significance level.
e. Summarize your conclusion in context, and explain the reasoning process by which you reach this conclusion.
f. Would the -value have been larger, smaller, or the same if a larger sample size had been used and all else had turned out the same? (Do not bother to explain.)
g. Would the -value have been larger, smaller, or the same if the sample standard deviation had been smaller and all else had turned out the same? (Do not bother to explain.)
h. Would the -value have been larger, smaller, or the same if the sample mean had been smaller, and all else had turned out the same? (Do not bother to explain.)
Unlock Deck
Unlock for access to all 57 flashcards in this deck.
Unlock Deck
k this deck
Unlock Deck
Unlock for access to all 57 flashcards in this deck.


