Deck 1: Linear Functions and Change
Full screen (f)
Question
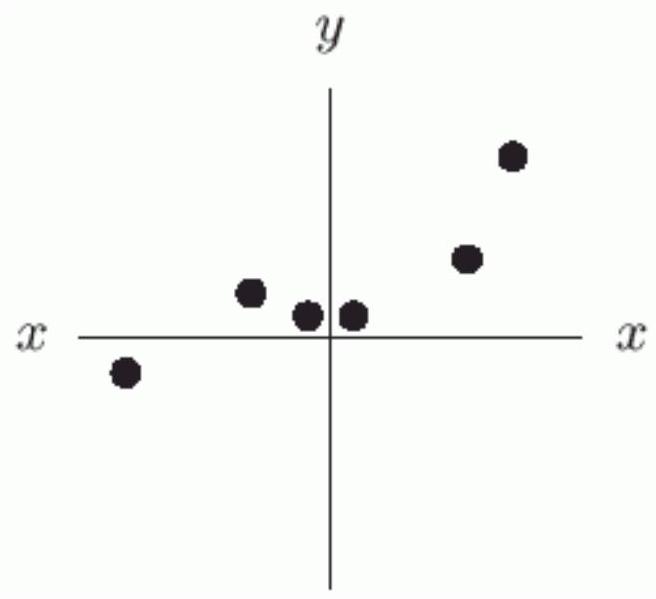
Does the following graph give as a function of ?
Question
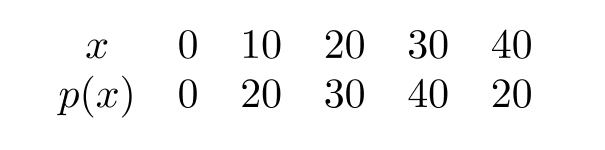
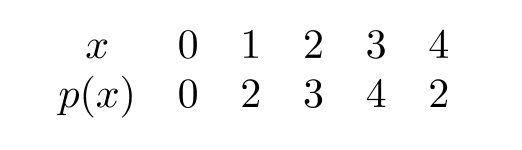
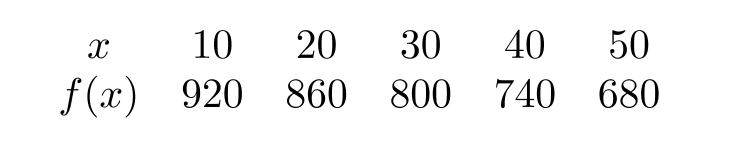
Use the following table to find . If there is more than one answer, enter the smallest first and separate them by semicolons.
Question
Use the following table to find such that . If there is more than one answer, enter the smallest first and separate them by semicolons.
Question
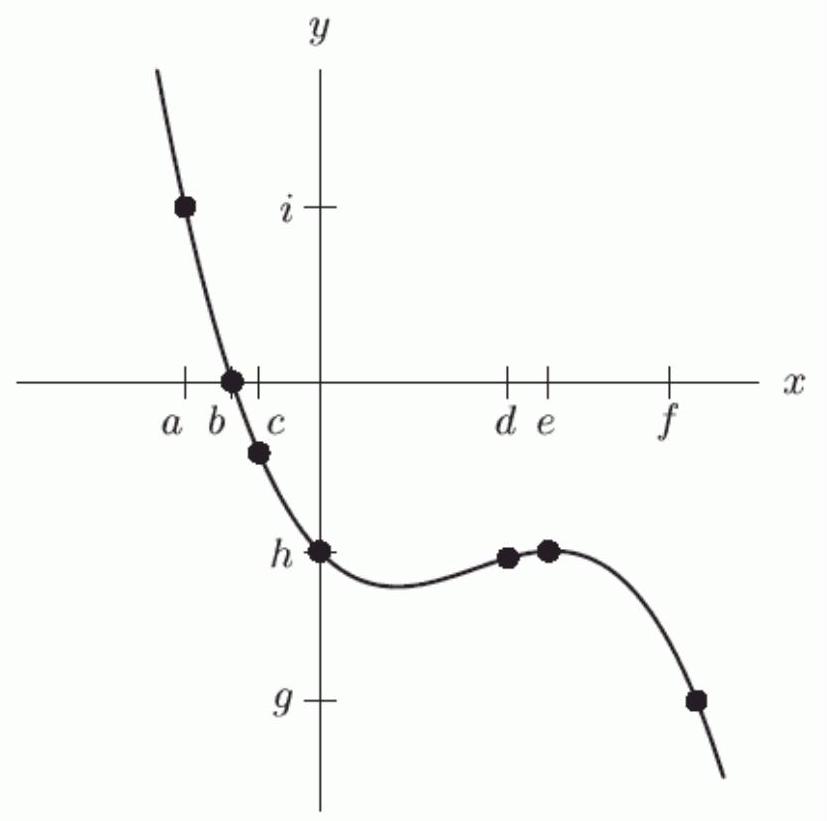
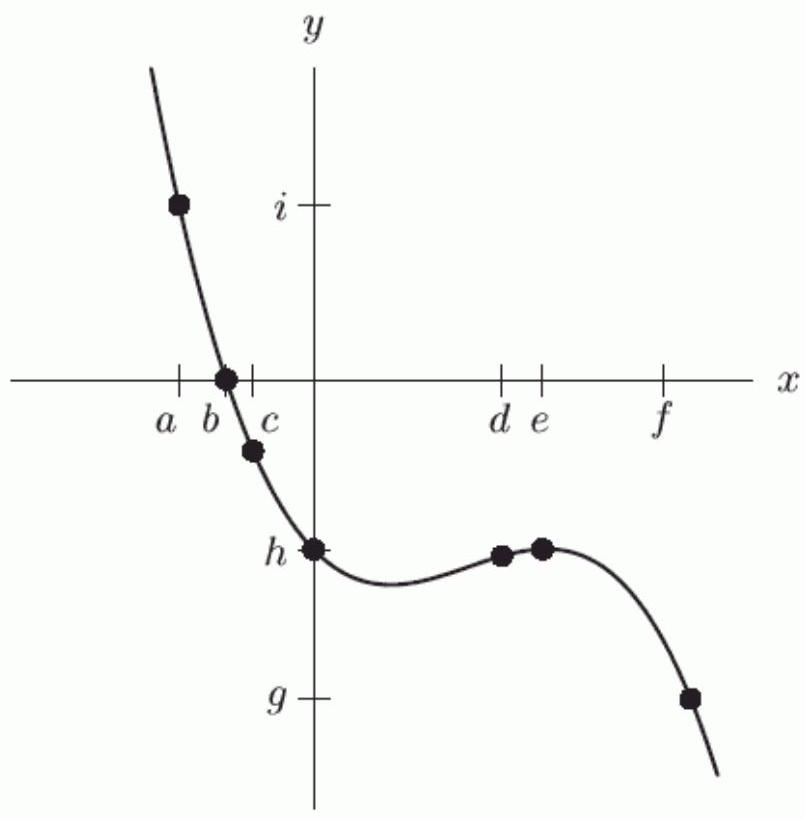
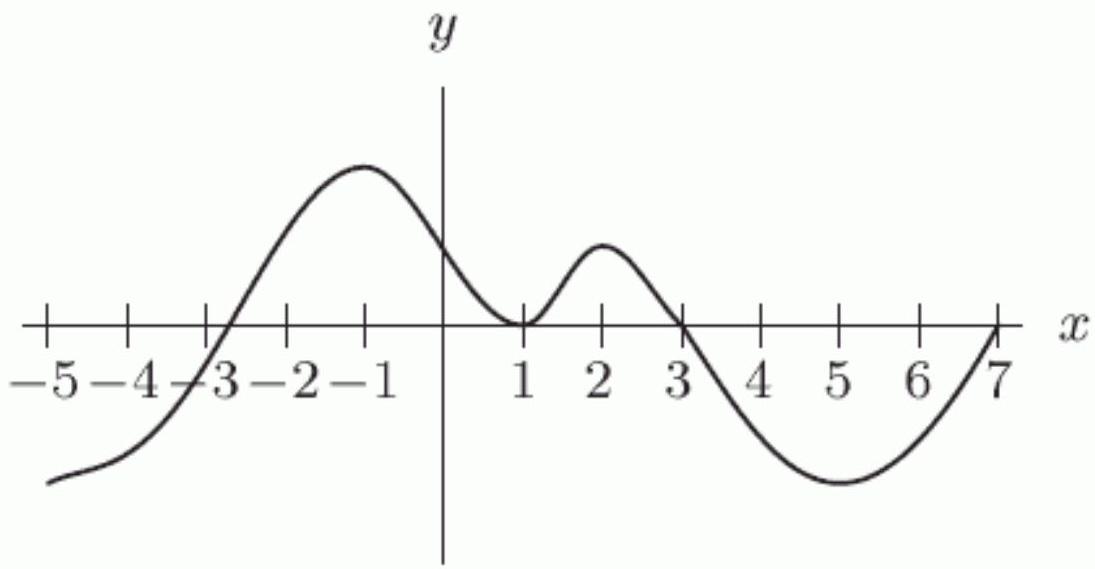
Let be defined by the following graph. What is ?

Question
Let be defined by the following graph. If , what is ? If there is more than one answer, enter the smallest first and separate them by semicolons.
Question
Let be defined by the following graph. Is closer to or ?
Question
Let be defined by the following graph. Which of the following are true?
A)
B)
C)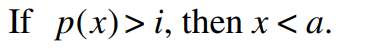
D)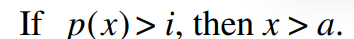
A)
B)
C)
D)
Question
Question
Question
Consider the information in the following table.
Could be a function of ?
Could be a function of ?
Question
Question
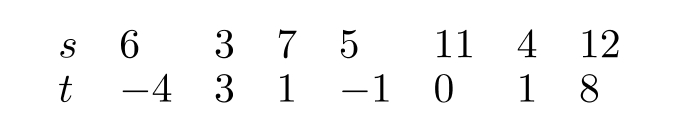
What could the following graph reasonably represent?
A) The average daily temperature of Denver over a one-year time period with being July 1.
B) The average daily temperature of Denver over a one-year time period with being January 1.
C) The population of Denver between 1900 and 2000 with being 1900 .
D) The infant mortality rate in Denver between 1900 and 2000 with being 1900.
Question
Which of the following graphs is mostly likely to represent the resale price of a car which depreciates steadily until it is worthless?
A)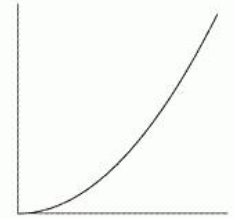
B)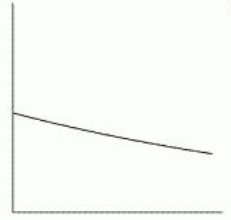
C)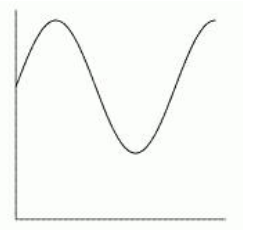
D)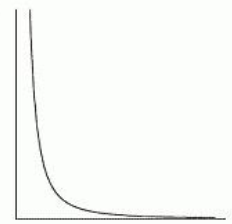
E)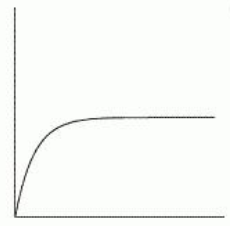
F)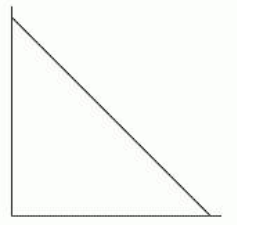
A)
B)
C)
D)
E)
F)
Question
Question
Question
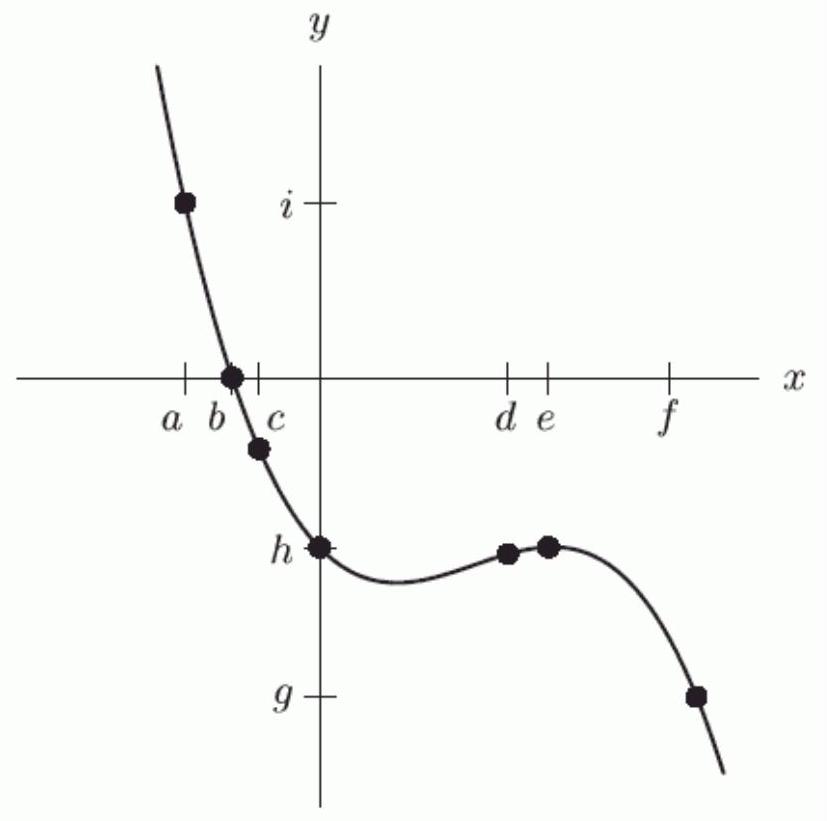
Solve for using the graph of below.
Question
Question
The following chart gives the number of students in a class that are a specific height in inches

a) Is the number of students in each category a function of the height?
b) Is the height in each category a function of the number of students in that category?
a) Is the number of students in each category a function of the height?
b) Is the height in each category a function of the number of students in that category?
Question
The following chart gives the number of students in a class that are a specific height in inches
 a) What is the most common height of students in this class?
b) What is the least common height of students in this class?
a) What is the most common height of students in this class?b) What is the least common height of students in this class?
Question
Question
Question
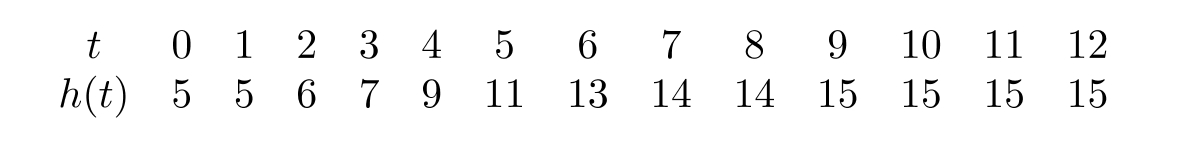
The following table shows the height of a tree (to the nearest foot) as a function of time (in years). What was the average rate of change in the height of the tree between and ?
Question
Question
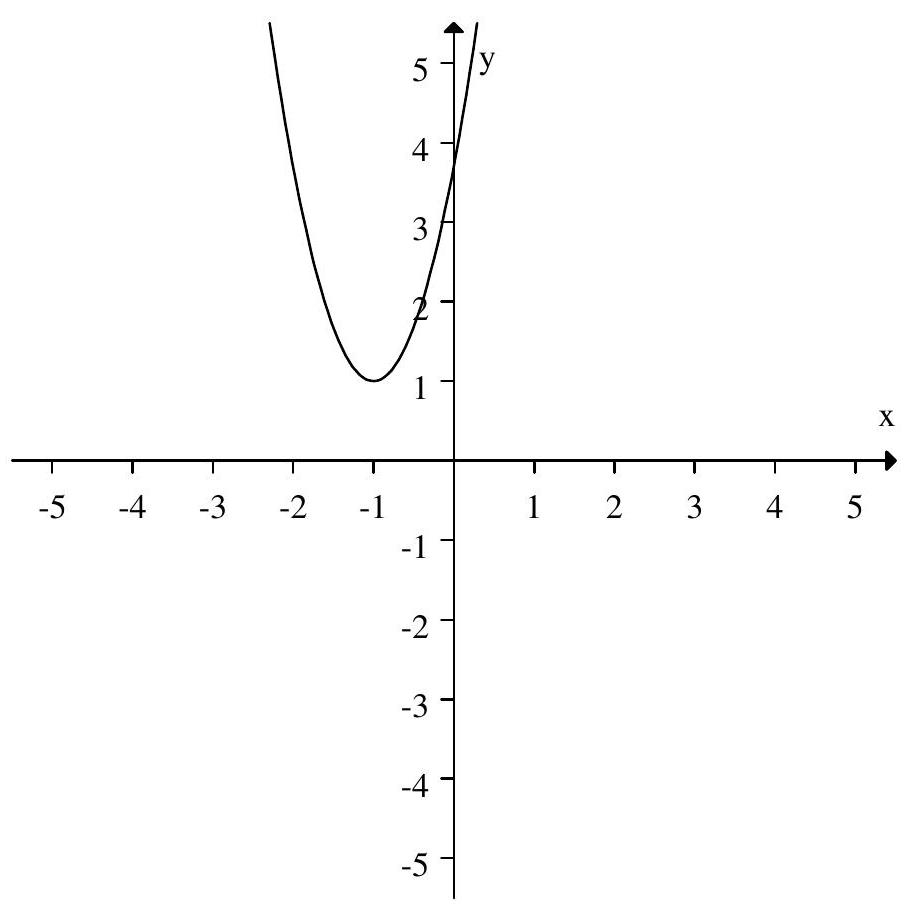
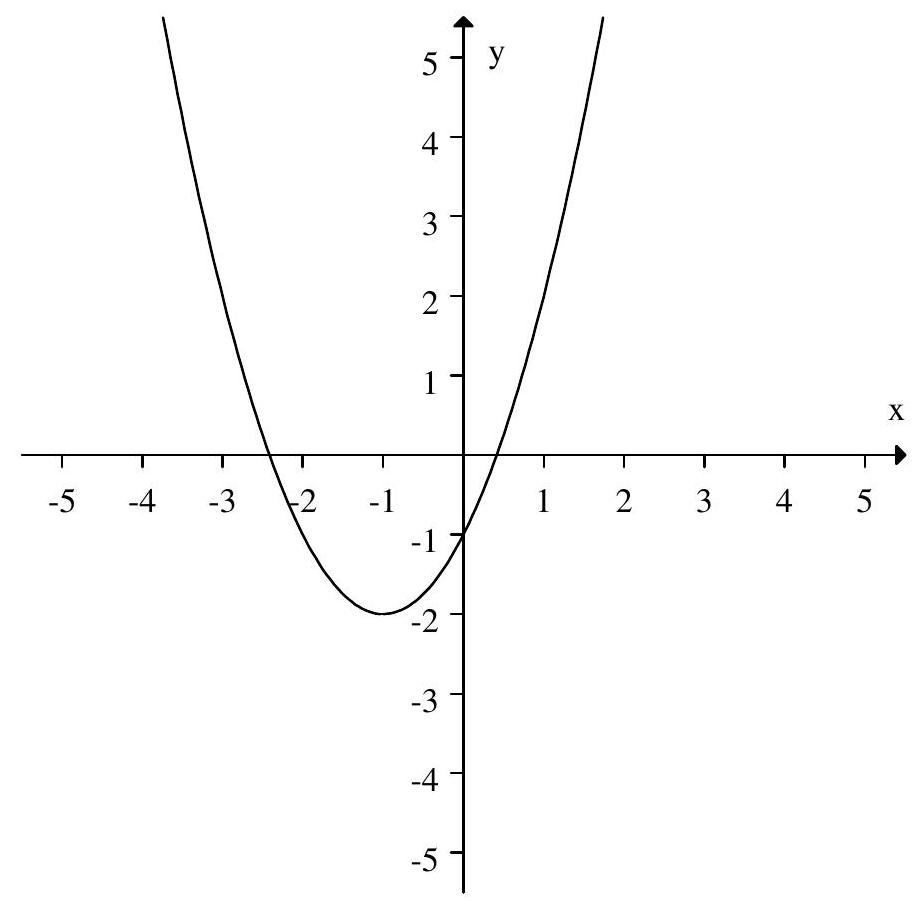
The following figure shows the graph of . Estimate between 5 and .
A)
B) inf
C) .
D) -inf
A)
B) inf
C) .
D) -inf
Question
Is the function graphed in the following figure increasing or decreasing on the interval 5 ?
Question
If is an increasing function, what can you say about and ?
A)
B)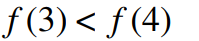
C)
D) It cannot be determined
A)
B)
C)
D) It cannot be determined
Question
Using the following figure, find the average rate of change of for .
Question
Question
Question
Question
Question
Question
The table below gives the deer population in a state park.
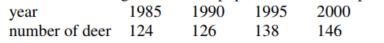
Based on the information in the chart, what would you predict about the deer population in this state park in the year 2020.
A) The deer population will be larger than 146 .
B) The deer population will be smaller than 146 .
C) The deer population will be at most 146 .
Based on the information in the chart, what would you predict about the deer population in this state park in the year 2020.
A) The deer population will be larger than 146 .
B) The deer population will be smaller than 146 .
C) The deer population will be at most 146 .
Question
Question
Question
Question
Question
Question
Question
Question
Approximate the average rate of change for the function between and
Question
The following table shows the relationship between , the side length of an equilateral triangle, , the perimeter of the triangle, and , the area of the triangle.
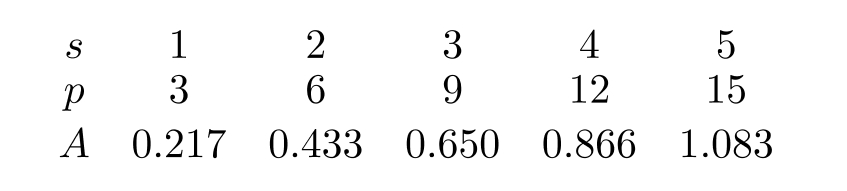
If is a linear function of , give its rate of change. If it is not linear, enter "not linear".
If is a linear function of , give its rate of change. If it is not linear, enter "not linear".
Question
Question
Question
Question
Could the following table represent a linear function?
Question
Could the following table represent a linear function?
Question
Could the following table represent a linear function?
Question
Which of the following figures shows the graph of a person's weight, , as a function of time , in months if the person starts out at 150 pounds and loses 5 pounds a month?
A)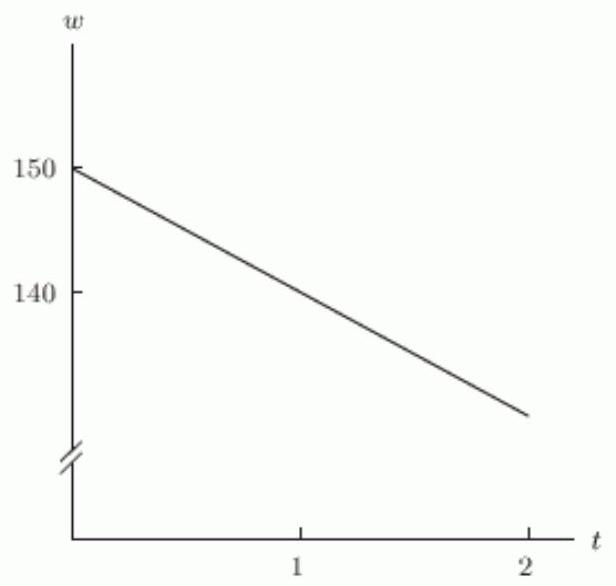
B)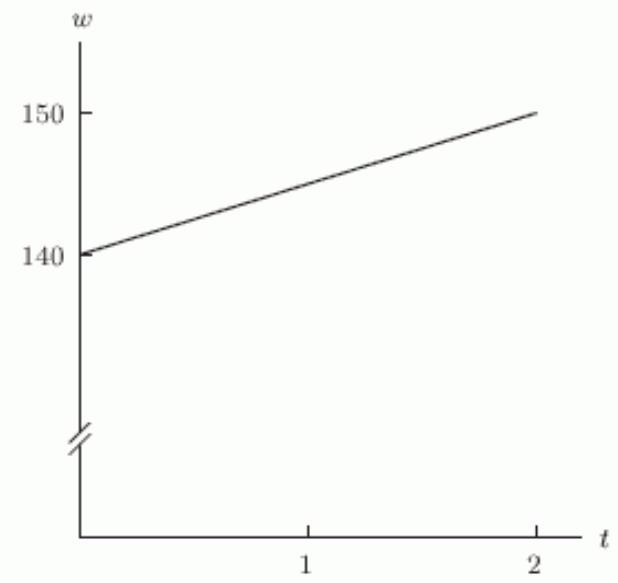
C)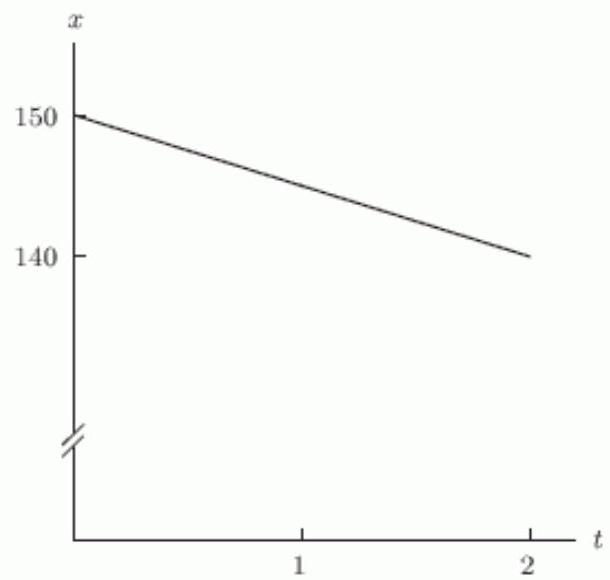
D)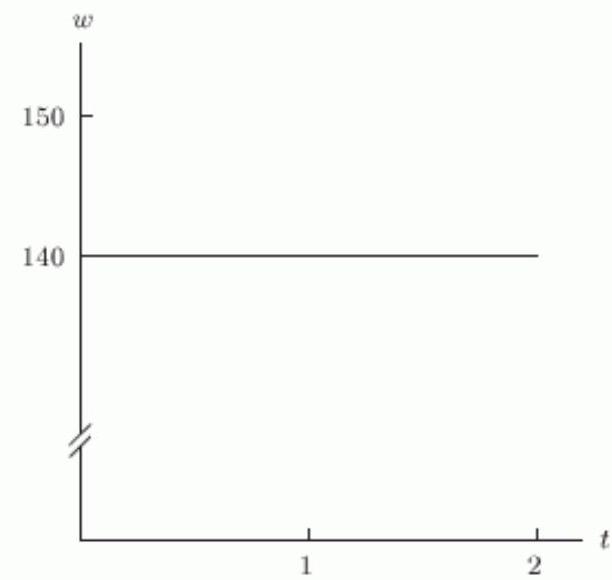
A)
B)
C)
D)
Question
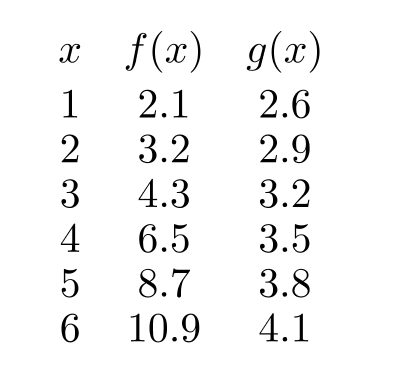
One of the functions represented in the table below is linear. What is its vertical intercept?
Question
Question
Question
Question
Question
Question
Question
Question
Question
Question
Question
Question
Question
Question
Question
Question
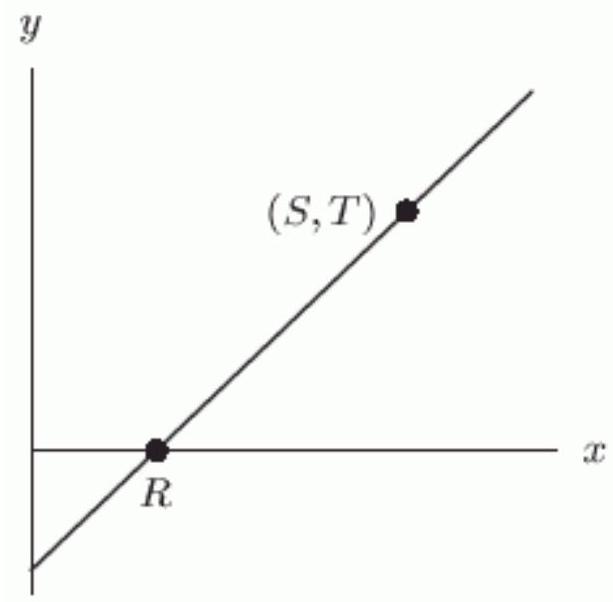
Choose the formula that represents the linear function graphed in the following figure?
A)
B)
C)
D)
A)
B)
C)
D)
Question
Question
Question
Question
Let be the formula for the linear function defined in the following table.
and

and
Question
Question
Question
Question
Question
Question
Question
Question
Question
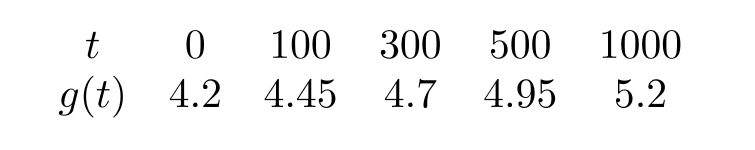
An athlete wanting to strengthen his cardiovascular system will bench-press a weight, , as many times, , as possible. The following table shows the relationship between and .
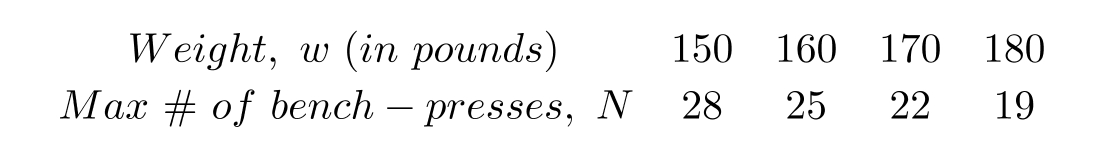
Assuming this is a linear relationship, let . Then and
Assuming this is a linear relationship, let . Then and
Question
An athlete wanting to strengthen his cardiovascular system will bench-press a weight, , as many times, , as possible. The following table shows the relationship between and .
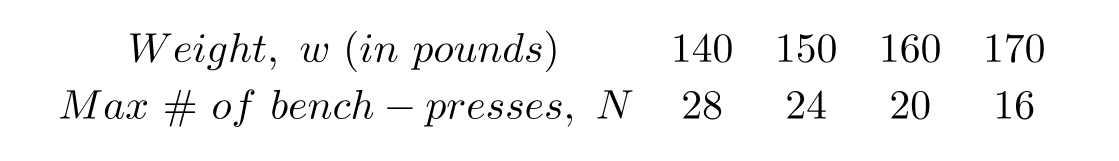
Assuming this is a linear relationship, what is the maximum weight this athlete will be able bench-press 5 times? Round to the nearest whole number.
Assuming this is a linear relationship, what is the maximum weight this athlete will be able bench-press 5 times? Round to the nearest whole number.

Unlock Deck
Sign up to unlock the cards in this deck!
Unlock Deck
Unlock Deck
1/148
Play
Full screen (f)
Deck 1: Linear Functions and Change
1
Does the following graph give as a function of ?
True
2
Use the following table to find . If there is more than one answer, enter the smallest first and separate them by semicolons.
30
3
Use the following table to find such that . If there is more than one answer, enter the smallest first and separate them by semicolons.
3
4
Let be defined by the following graph. What is ?
Unlock Deck
Unlock for access to all 148 flashcards in this deck.
Unlock Deck
k this deck
5
Let be defined by the following graph. If , what is ? If there is more than one answer, enter the smallest first and separate them by semicolons.
Unlock Deck
Unlock for access to all 148 flashcards in this deck.
Unlock Deck
k this deck
6
Let be defined by the following graph. Is closer to or ?
Unlock Deck
Unlock for access to all 148 flashcards in this deck.
Unlock Deck
k this deck
7
Let be defined by the following graph. Which of the following are true?
A)
B)
C)
D)
A)
B)
C)
D)
Unlock Deck
Unlock for access to all 148 flashcards in this deck.
Unlock Deck
k this deck
8
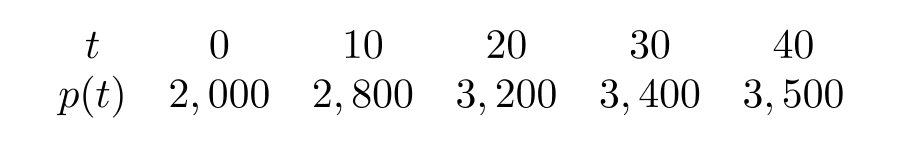
Write the relationship of population, , as a function of time, , in years using function notation. Assume a direct relationship.
A)
B)
C)
D)
A)
B)
C)
D)
Unlock Deck
Unlock for access to all 148 flashcards in this deck.
Unlock Deck
k this deck
9
If you were to draw a graph representing the total amount of concrete, , used to pour square feet of sidewalk, which axis would be on?
A) horizontal
B) vertical
A) horizontal
B) vertical
Unlock Deck
Unlock for access to all 148 flashcards in this deck.
Unlock Deck
k this deck
10
Consider the information in the following table.
Could be a function of ?
Could be a function of ?
Unlock Deck
Unlock for access to all 148 flashcards in this deck.
Unlock Deck
k this deck
11
You are looking at a graph of , a function of . Is it possible for the graph to intercept the -axis 5 times?
Unlock Deck
Unlock for access to all 148 flashcards in this deck.
Unlock Deck
k this deck
12
What could the following graph reasonably represent?
A) The average daily temperature of Denver over a one-year time period with being July 1.
B) The average daily temperature of Denver over a one-year time period with being January 1.
C) The population of Denver between 1900 and 2000 with being 1900 .
D) The infant mortality rate in Denver between 1900 and 2000 with being 1900.
A) The average daily temperature of Denver over a one-year time period with being July 1.
B) The average daily temperature of Denver over a one-year time period with being January 1.
C) The population of Denver between 1900 and 2000 with being 1900 .
D) The infant mortality rate in Denver between 1900 and 2000 with being 1900.
Unlock Deck
Unlock for access to all 148 flashcards in this deck.
Unlock Deck
k this deck
13
Which of the following graphs is mostly likely to represent the resale price of a car which depreciates steadily until it is worthless?
A)
B)
C)
D)
E)
F)
A)
B)
C)
D)
E)
F)
Unlock Deck
Unlock for access to all 148 flashcards in this deck.
Unlock Deck
k this deck
14
You have to spend on lunches this month. Each day, you can pack a lunch for about , or you can buy lunch at the cafeteria for . Let be the number of times you pack a lunch and be the number of times you buy lunch. The formula for in terms of is given by _____ - _____ . Round answers to 2 decimal places.
Unlock Deck
Unlock for access to all 148 flashcards in this deck.
Unlock Deck
k this deck
15
Find the value of the expression if and .
Unlock Deck
Unlock for access to all 148 flashcards in this deck.
Unlock Deck
k this deck
16
Solve for using the graph of below.
Unlock Deck
Unlock for access to all 148 flashcards in this deck.
Unlock Deck
k this deck
17
Let be the number of students (in thousands) attending MNO college years after 2000. Which of the following statements gives the meaning of the expression ?
A) The number of students attending MNO college in the year 2015 is 13,000.
B) The number of students attending MNO college in the year 2000 is 13,000.
C) The number of students attending MNO college in the year 2013 is 15,000.
D) The number of students attending MNO college in the year 2000 is 15,000.
Unlock Deck
Unlock for access to all 148 flashcards in this deck.
Unlock Deck
k this deck
18
The following chart gives the number of students in a class that are a specific height in inches
a) Is the number of students in each category a function of the height?
b) Is the height in each category a function of the number of students in that category?
a) Is the number of students in each category a function of the height?
b) Is the height in each category a function of the number of students in that category?
Unlock Deck
Unlock for access to all 148 flashcards in this deck.
Unlock Deck
k this deck
19
The following chart gives the number of students in a class that are a specific height in inches
a) What is the most common height of students in this class?
b) What is the least common height of students in this class?
a) What is the most common height of students in this class?b) What is the least common height of students in this class?
Unlock Deck
Unlock for access to all 148 flashcards in this deck.
Unlock Deck
k this deck
20
A box with volume has a square base of side length and a height of . Write a formula for the height of the box as a function of the side length of the box.
Unlock Deck
Unlock for access to all 148 flashcards in this deck.
Unlock Deck
k this deck
21
Express this relationship in function notation (that is, is a function of is written ).
Calories burned, , is a function of activity, .
Calories burned, , is a function of activity, .
Unlock Deck
Unlock for access to all 148 flashcards in this deck.
Unlock Deck
k this deck
22
The following table shows the height of a tree (to the nearest foot) as a function of time (in years). What was the average rate of change in the height of the tree between and ?
Unlock Deck
Unlock for access to all 148 flashcards in this deck.
Unlock Deck
k this deck
23
Calculate the average rate of change for between and .
Unlock Deck
Unlock for access to all 148 flashcards in this deck.
Unlock Deck
k this deck
24
The following figure shows the graph of . Estimate between 5 and .
A)
B) inf
C) .
D) -inf
A)
B) inf
C) .
D) -inf
Unlock Deck
Unlock for access to all 148 flashcards in this deck.
Unlock Deck
k this deck
25
Is the function graphed in the following figure increasing or decreasing on the interval 5 ?
Unlock Deck
Unlock for access to all 148 flashcards in this deck.
Unlock Deck
k this deck
26
If is an increasing function, what can you say about and ?
A)
B)
C)
D) It cannot be determined
A)
B)
C)
D) It cannot be determined
Unlock Deck
Unlock for access to all 148 flashcards in this deck.
Unlock Deck
k this deck
27
Using the following figure, find the average rate of change of for .
Unlock Deck
Unlock for access to all 148 flashcards in this deck.
Unlock Deck
k this deck
28
Let . Find the average rate of change of the function between and .
Unlock Deck
Unlock for access to all 148 flashcards in this deck.
Unlock Deck
k this deck
29
Let . Find so that the average rate of change of the function between and is 8 .
Unlock Deck
Unlock for access to all 148 flashcards in this deck.
Unlock Deck
k this deck
30
If is an increasing function, which of the following must be true.
A)
B)
C)
D) For some value of
A)
B)
C)
D) For some value of
Unlock Deck
Unlock for access to all 148 flashcards in this deck.
Unlock Deck
k this deck
31
If , then the function must be a decreasing function.
Unlock Deck
Unlock for access to all 148 flashcards in this deck.
Unlock Deck
k this deck
32
The table below gives the deer population in a state park.
Using the table, find the average rate of change of the population over the interval 1990 to 2000 .
Using the table, find the average rate of change of the population over the interval 1990 to 2000 .
Unlock Deck
Unlock for access to all 148 flashcards in this deck.
Unlock Deck
k this deck
33
The table below gives the deer population in a state park.
Based on the information in the chart, what would you predict about the deer population in this state park in the year 2020.
A) The deer population will be larger than 146 .
B) The deer population will be smaller than 146 .
C) The deer population will be at most 146 .
Based on the information in the chart, what would you predict about the deer population in this state park in the year 2020.
A) The deer population will be larger than 146 .
B) The deer population will be smaller than 146 .
C) The deer population will be at most 146 .
Unlock Deck
Unlock for access to all 148 flashcards in this deck.
Unlock Deck
k this deck
34
In 2006 , you earned per hour at your job. In 2009 , you earned per hour at your job. In 2010, you earned per hour at your job.
a) What was the average rate of change in the amount you earned per hour between 2006 and 2009 ?
b) What was the average rate of change in the amount you earned per hour between 2009 and 2010 ?
Round answers to 3 decimal places if necessary.
a) What was the average rate of change in the amount you earned per hour between 2006 and 2009 ?
b) What was the average rate of change in the amount you earned per hour between 2009 and 2010 ?
Round answers to 3 decimal places if necessary.
Unlock Deck
Unlock for access to all 148 flashcards in this deck.
Unlock Deck
k this deck
35
Calculate the average rate of change of the function between and .
Unlock Deck
Unlock for access to all 148 flashcards in this deck.
Unlock Deck
k this deck
36
If is a decreasing function, which of the following is the largest:
A)
B)
C)
D)
A)
B)
C)
D)
Unlock Deck
Unlock for access to all 148 flashcards in this deck.
Unlock Deck
k this deck
37
Suppose there are 110 people living in a small town and the rate of change of the town's population is 6 people per year. How many people will be living in the town twenty years from now?
Unlock Deck
Unlock for access to all 148 flashcards in this deck.
Unlock Deck
k this deck
38
Suppose there are 100 people living in a small town and the rate of change of the town's population is 7 people per year. How many people will be living in the town twenty years from now?
A) 107
B) 140
C) 240
D) 120
A) 107
B) 140
C) 240
D) 120
Unlock Deck
Unlock for access to all 148 flashcards in this deck.
Unlock Deck
k this deck
39
Suppose there are 150 people living in a small town and the rate of change of the town's population is -9 people per year. Which of the following must be true?
A) The town size is decreasing each year.
B) No children are born in the town each year.
C) 9 more people leave the town (move away or pass away) than join the town (move into or are born) each year.
D) No one moves into the town.
A) The town size is decreasing each year.
B) No children are born in the town each year.
C) 9 more people leave the town (move away or pass away) than join the town (move into or are born) each year.
D) No one moves into the town.
Unlock Deck
Unlock for access to all 148 flashcards in this deck.
Unlock Deck
k this deck
40
Farmer Brown starts with 120 cows and the average rate of change of his herd is 9 cows per year. Farmer Jones starts his herd the same year with 170 cows and the average rate of change of his herd is 5 cows per year.
a) After 10 years, which farmer has the most cows?
b) After 20 years, which farmer has the most cows?
a) After 10 years, which farmer has the most cows?
b) After 20 years, which farmer has the most cows?
Unlock Deck
Unlock for access to all 148 flashcards in this deck.
Unlock Deck
k this deck
41
Approximate the average rate of change for the function between and
Unlock Deck
Unlock for access to all 148 flashcards in this deck.
Unlock Deck
k this deck
42
The following table shows the relationship between , the side length of an equilateral triangle, , the perimeter of the triangle, and , the area of the triangle.
If is a linear function of , give its rate of change. If it is not linear, enter "not linear".
If is a linear function of , give its rate of change. If it is not linear, enter "not linear".
Unlock Deck
Unlock for access to all 148 flashcards in this deck.
Unlock Deck
k this deck
43
A salesman earns , where is the number of products sold, and is the weekly wage in dollars. What does the number 500 represent? (Mark all that apply)
A) The slope
B) The vertical intercept
C) The salesman's base salary
D) The salesman's commission for each product sold
A) The slope
B) The vertical intercept
C) The salesman's base salary
D) The salesman's commission for each product sold
Unlock Deck
Unlock for access to all 148 flashcards in this deck.
Unlock Deck
k this deck
44
The distance traveled by a car is miles, where is the number of hours driven. What is the slope?
Unlock Deck
Unlock for access to all 148 flashcards in this deck.
Unlock Deck
k this deck
45
The distance traveled by a car is miles, where is the number of hours driven. What is the meaning of the number 65? (Mark all that apply)
A) The vertical intercept
B) The slope
C) The total distance traveled
D) The speed of the car
A) The vertical intercept
B) The slope
C) The total distance traveled
D) The speed of the car
Unlock Deck
Unlock for access to all 148 flashcards in this deck.
Unlock Deck
k this deck
46
Could the following table represent a linear function?
Unlock Deck
Unlock for access to all 148 flashcards in this deck.
Unlock Deck
k this deck
47
Could the following table represent a linear function?
Unlock Deck
Unlock for access to all 148 flashcards in this deck.
Unlock Deck
k this deck
48
Could the following table represent a linear function?
Unlock Deck
Unlock for access to all 148 flashcards in this deck.
Unlock Deck
k this deck
49
Which of the following figures shows the graph of a person's weight, , as a function of time , in months if the person starts out at 150 pounds and loses 5 pounds a month?
A)
B)
C)
D)
A)
B)
C)
D)
Unlock Deck
Unlock for access to all 148 flashcards in this deck.
Unlock Deck
k this deck
50
One of the functions represented in the table below is linear. What is its vertical intercept?
Unlock Deck
Unlock for access to all 148 flashcards in this deck.
Unlock Deck
k this deck
51
For the line ,
a) what is the slope of the line?
b) what is the y-intercept of the line?
a) what is the slope of the line?
b) what is the y-intercept of the line?
Unlock Deck
Unlock for access to all 148 flashcards in this deck.
Unlock Deck
k this deck
52
A cookie store has a fixed monthly cost of . It costs the cookie store to make a cookie and the store sells each cookie for . Express revenue R, cost C, and profit for the cookie store when making and selling cookies in a month.
Unlock Deck
Unlock for access to all 148 flashcards in this deck.
Unlock Deck
k this deck
53
A certain baseball card's value is given by where is the number of years after the card was issued. Interpret the constants 1 and 4.6.
Unlock Deck
Unlock for access to all 148 flashcards in this deck.
Unlock Deck
k this deck
54
The population of a pack of rats can be represented by the formula where represents the population in hundreds, and represents the time, in months, since January 2010. Which of the following is correct regarding the vertical intercept?
A) Since the vertical intercept is 3, we know that in January 2010 there were 300 rats.
B) Since the vertical intercept is 3, we know that in January 2010 there were 3 rats.
C) Since the vertical intercept is 1.3 , we know that in January 2010 there were 130 rats.
D) Since the vertical intercept is 0, we know that in January 2010 there were no rats.
Unlock Deck
Unlock for access to all 148 flashcards in this deck.
Unlock Deck
k this deck
55
The population of a pack of rats can be represented by the formula where represents the population in hundreds, and represents the time, in months, since January 2010. Which of the following is correct regarding the slope.
A) Since the slope is 1.3 , we know that the population is increasing by 130 rats per month.
B) Since the slope is 2, we know that the population is increasing by 200 rats per month.
C) Since the vertical intercept is 1.3 , we know that the population is increasing by approximately 1.3 rats per month.
D) Since the slope is 1.3 , we know that the population is increasing by 130 rats per year.
Unlock Deck
Unlock for access to all 148 flashcards in this deck.
Unlock Deck
k this deck
56
A wildlife ranger finds that there is a linear relationship between the number of bushels of corn distributed in a month and the number of deer at the park. If the ranger distributes no bushels of corn, there are 49 deer at the park. For each additional bushel of corn distributed, 8 more deer come to the park.
a) If is the number of deer at the park and is the number of bushels of corn fed in a month, find a formula for in terms of .
b) How many deer are at the park if the ranger feeds 3 bushels of corn?
c) How many bushels of corn must be distributed in order to have 81 deer at the park?
a) If is the number of deer at the park and is the number of bushels of corn fed in a month, find a formula for in terms of .
b) How many deer are at the park if the ranger feeds 3 bushels of corn?
c) How many bushels of corn must be distributed in order to have 81 deer at the park?
Unlock Deck
Unlock for access to all 148 flashcards in this deck.
Unlock Deck
k this deck
57
A wildlife ranger finds that there is a linear relationship between the number of bushels of corn distributed in a month and the number of deer at the park. If the ranger distributes no bushels of corn, there are 49 deer at the park. For each additional bushel of corn distributed, 7 more deer come to the park.
How many bushels of corn must be distributed in order to have 77 deer at the park?
A) 4 bushels must be distributed.
B) 588 bushels must be distributed.
C) 2 bushels must be distributed.
D) 5 bushels must be distributed.
How many bushels of corn must be distributed in order to have 77 deer at the park?
A) 4 bushels must be distributed.
B) 588 bushels must be distributed.
C) 2 bushels must be distributed.
D) 5 bushels must be distributed.
Unlock Deck
Unlock for access to all 148 flashcards in this deck.
Unlock Deck
k this deck
58
It costs a band to pay to rent a hall. They sell tickets for . Express the profit, , as a function of the number of people, , attending the concert.
Unlock Deck
Unlock for access to all 148 flashcards in this deck.
Unlock Deck
k this deck
59
It costs a band to pay to rent a hall. They sell tickets for . How much profit, , will the band make if 300 people are attending the concert?
Unlock Deck
Unlock for access to all 148 flashcards in this deck.
Unlock Deck
k this deck
60
It costs to operate a lemonade stand, while a cup of lemonade sells for .
Which of the following expresses the profit, , as a function of the number of cups, , of lemonade sold.
A)
B)
C)
D)
Which of the following expresses the profit, , as a function of the number of cups, , of lemonade sold.
A)
B)
C)
D)
Unlock Deck
Unlock for access to all 148 flashcards in this deck.
Unlock Deck
k this deck
61
It costs to operate a lemonade stand, while a cup of lemonade sells for . How many cups of lemonade must be sold in order to have in profit?
Unlock Deck
Unlock for access to all 148 flashcards in this deck.
Unlock Deck
k this deck
62
What is the slope of the line ?
Unlock Deck
Unlock for access to all 148 flashcards in this deck.
Unlock Deck
k this deck
63
Suppose that f(x) is linear and that and . If , then and
Unlock Deck
Unlock for access to all 148 flashcards in this deck.
Unlock Deck
k this deck
64
Suppose that is linear with slope -2 and passing through the point . If , then and
Unlock Deck
Unlock for access to all 148 flashcards in this deck.
Unlock Deck
k this deck
65
Suppose that is linear with an -intercept of -1 and a -intercept of 5. If , then and
Unlock Deck
Unlock for access to all 148 flashcards in this deck.
Unlock Deck
k this deck
66
Choose the formula that represents the linear function graphed in the following figure?
A)
B)
C)
D)
A)
B)
C)
D)
Unlock Deck
Unlock for access to all 148 flashcards in this deck.
Unlock Deck
k this deck
67
If the linear equation is written in the form , then and
Unlock Deck
Unlock for access to all 148 flashcards in this deck.
Unlock Deck
k this deck
68
Let define a linear function with slope that passes through the point (-1, 3). Then and
Unlock Deck
Unlock for access to all 148 flashcards in this deck.
Unlock Deck
k this deck
69
Let define a linear function with -intercept -3 that passes through the point . Then and
Unlock Deck
Unlock for access to all 148 flashcards in this deck.
Unlock Deck
k this deck
70
Let be the formula for the linear function defined in the following table.
and
and
Unlock Deck
Unlock for access to all 148 flashcards in this deck.
Unlock Deck
k this deck
71
A car company has found that there is a linear relationship between the amount of money it spends on advertising and the number of cars it sells. When it spent 50,000 dollars on advertising, it sold 425 cars. Moreover, for each additional 10 thousand dollars spent, they sell 15 more cars. Let be the formula for the number of cars sold as a function of , the amount of money spent on advertising. Then and
Unlock Deck
Unlock for access to all 148 flashcards in this deck.
Unlock Deck
k this deck
72
A car company has found that there is a linear relationship between the amount of money it spends on advertising and the number of cars it sells. When it spent 60,000 dollars on advertising, it sold 680 cars. Moreover, for each additional 5 thousand dollars spent, they sell 40 more cars. Let be the formula for the number of cars sold as a function of , the amount of money spent on advertising. What is the practical interpretation of the vertical intercept of the equation?
A) The dollars spent on advertising per car sold.
B) The number of cars sold with no money spent on advertising.
C) The amount of advertising spent before any cars are sold.
D) The number of cars sold per dollar spent on advertising.
A) The dollars spent on advertising per car sold.
B) The number of cars sold with no money spent on advertising.
C) The amount of advertising spent before any cars are sold.
D) The number of cars sold per dollar spent on advertising.
Unlock Deck
Unlock for access to all 148 flashcards in this deck.
Unlock Deck
k this deck
73
ComElectric, the Cambridge power company, charges its customers a month and per kwh, plus a per kwh surcharge. (A kwh, or kilowatt-hour, is a unit of electricity supplied). The formula for the monthly cost for kwh of electricity is dollars, where and
Unlock Deck
Unlock for access to all 148 flashcards in this deck.
Unlock Deck
k this deck
74
If a linear population function is 50,000 in year and grows by 1,250 people per year, then , where and
Unlock Deck
Unlock for access to all 148 flashcards in this deck.
Unlock Deck
k this deck
75
At a price of per gallon, the average weekly demand by consumers for gasoline is 43 gallons. If the price rises to , the weekly demand drops to 39 gallons. Assuming demand is linear, let , where is the weekly quantity of gasoline demanded and is the price per gallon. Then and
Unlock Deck
Unlock for access to all 148 flashcards in this deck.
Unlock Deck
k this deck
76
An airplane has room for 390 coach-fare seats. It can replace any 3 coach-fare seats with 2 first-class seats. Suppose the airplane is configured with coach-fare seats and first-class seats, with no space wasted. If , what is the value of ?
Unlock Deck
Unlock for access to all 148 flashcards in this deck.
Unlock Deck
k this deck
77
An airplane has room for 300 coach-fare seats. It can replace any 3 coach-fare seats with 2 first-class seats. Suppose the airplane is configured with coach-fare seats and first-class seats, with no space wasted. If , then and
Unlock Deck
Unlock for access to all 148 flashcards in this deck.
Unlock Deck
k this deck
78
If a linear population function is 80,000 in year and 87,500 by year , then , where and
Unlock Deck
Unlock for access to all 148 flashcards in this deck.
Unlock Deck
k this deck
79
An athlete wanting to strengthen his cardiovascular system will bench-press a weight, , as many times, , as possible. The following table shows the relationship between and .
Assuming this is a linear relationship, let . Then and
Assuming this is a linear relationship, let . Then and
Unlock Deck
Unlock for access to all 148 flashcards in this deck.
Unlock Deck
k this deck
80
An athlete wanting to strengthen his cardiovascular system will bench-press a weight, , as many times, , as possible. The following table shows the relationship between and .
Assuming this is a linear relationship, what is the maximum weight this athlete will be able bench-press 5 times? Round to the nearest whole number.
Assuming this is a linear relationship, what is the maximum weight this athlete will be able bench-press 5 times? Round to the nearest whole number.
Unlock Deck
Unlock for access to all 148 flashcards in this deck.
Unlock Deck
k this deck
Unlock Deck
Unlock for access to all 148 flashcards in this deck.


