Deck 1: An Introduction to Data and Functions
Full screen (f)
Question
Below is a pie chart of the sources of points in a College Algebra class.
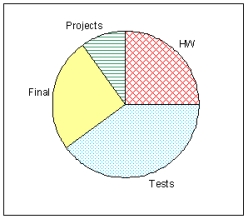
According to the chart, what is the smallest source of points in the class?
According to the chart, what is the smallest source of points in the class?
Question
Below is a pie chart of the sources of points in a College Algebra class.
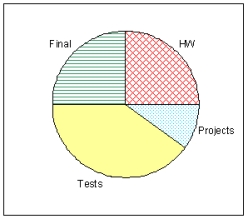
According to the chart, what is the smallest source of points in the class?
A) Tests
B) Final
C) Projects
D) HW
According to the chart, what is the smallest source of points in the class?
A) Tests
B) Final
C) Projects
D) HW
Question
Jeremy has instructed his accountant to split any deposits into his retirement account into the investments as shown in the pie chart.
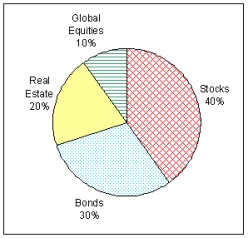
If Jeremy deposits $11,000 into his retirement account, how much will his accountant allocate to bonds?
If Jeremy deposits $11,000 into his retirement account, how much will his accountant allocate to bonds?
Question
Jeremy has instructed his accountant to split any deposits into his retirement account into the investments as shown in the pie chart.
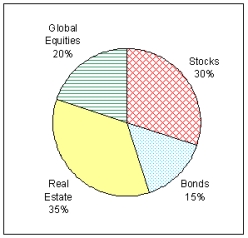
If Jeremy's accountant allocates $4,200 to global equities, how much was his investment into his retirement account?
If Jeremy's accountant allocates $4,200 to global equities, how much was his investment into his retirement account?
Question
Jeremy has instructed his accountant to split a $12,000 deposit to his retirement account into the investments as shown in the pie chart.
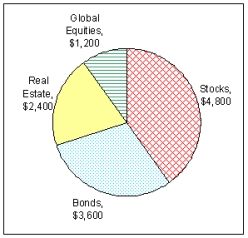
What percent of his investment was allocated to global equities?
What percent of his investment was allocated to global equities?
Question
Question
Question
Question
Question
Question
Question
Question
Question
On a recent test in a College Algebra class the following scores were recorded:
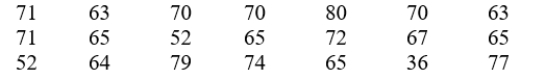
Find each of the following:
A) the meanand
and
B) the medianIf necessary, round answers to 2 decimal places.
Find each of the following:
A) the meanand
and
B) the medianIf necessary, round answers to 2 decimal places.
Question
Question
Question
The frequency table below describes the age distribution of students in a college algebra class. Based on this information, estimate the largest and smallest possible values for the mean age of this class.
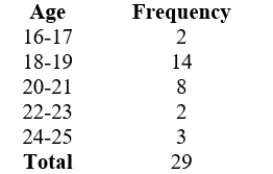
A) Find the smallest possible meanand
and
B) the largest possible mean.Round your answers to 2 decimals if necessary.
A) Find the smallest possible meanand
and
B) the largest possible mean.Round your answers to 2 decimals if necessary.
Question
The frequency table below describes the age distribution of students in a college algebra class. Based on this information, estimate the smallest possible value for the mean age of this class.
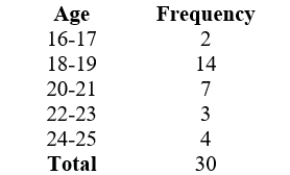
Which of the following is the smallest possible mean?
Round your answers to 2 decimals if necessary.
A) 19.53
B) 20.53
C) 20.03
D) 18.5
Which of the following is the smallest possible mean?
Round your answers to 2 decimals if necessary.
A) 19.53
B) 20.53
C) 20.03
D) 18.5
Question
The frequency table below describes the age distribution of students in a college algebra class. Based on this information, estimate the largest possible value for the mean age of this class.
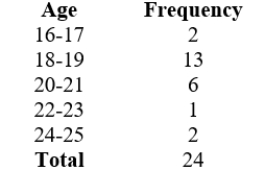
Which of the following is the largest possible mean?
Round your answers to 2 decimals if necessary.
A) 19.00
B) 20.00
C) 19.5
D) 18.5
Which of the following is the largest possible mean?
Round your answers to 2 decimals if necessary.
A) 19.00
B) 20.00
C) 19.5
D) 18.5
Question
Question
Question
Question
Question
Question
Question
Question
The table shows starting salaries from a survey of recent college graduates:
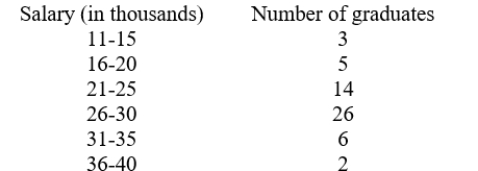
A) How many students were surveyed?
B) What is the relative frequency of a graduate having a salary between $11,000 and $15,000?
Round your answer to 2 decimal places.
A) How many students were surveyed?
B) What is the relative frequency of a graduate having a salary between $11,000 and $15,000?
Round your answer to 2 decimal places.
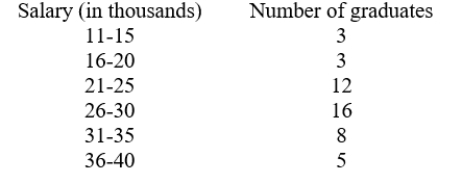
Question
The table shows starting salaries from a survey of recent college graduates:
What is the relative frequency of a graduate having a salary between $16,000 and $20,000?
Round your answer to 2 decimal places.
What is the relative frequency of a graduate having a salary between $16,000 and $20,000?
Round your answer to 2 decimal places.
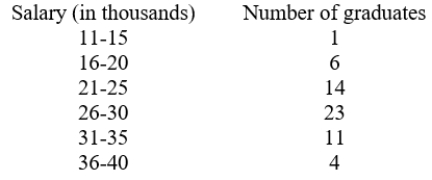
Question
The table shows starting salaries from a survey of recent college graduates:
What is the relative frequency of a graduate having a salary between $36,000 and $40,000?
Round your answer to 2 decimal places, if necessary
A) 0.34
B) 5
C) 0.11
D) 0.26
What is the relative frequency of a graduate having a salary between $36,000 and $40,000?
Round your answer to 2 decimal places, if necessary
A) 0.34
B) 5
C) 0.11
D) 0.26
Question
Below is age data from a University of Massachusetts college algebra class.
 Which is the relative frequency of students whose ages are in the interval from 18-20? (rounded to 2 decimal places)
A) 30
B) 3.33
C) 0.30
D) 0.17
Which is the relative frequency of students whose ages are in the interval from 18-20? (rounded to 2 decimal places)A) 30
B) 3.33
C) 0.30
D) 0.17
Question
Two friends, Alfredo and Bob, are playing golf. Although they are about the same at driving the ball onto the green, Al is better at putting. On the 9th hole, Bob makes a 5 and Al hits into the lake and then gets stuck in a sand trap. By the time he gets to the green and makes it to the hole, his score is 12. Here are the scores for the 9 holes:
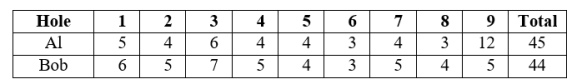
Find each of the following (if necessary, round to 2 decimal places):
A) Al's mean
B) Al's median
C) Bob's mean
D) Bob' median
E) Who is the better golfer "on average"? (Explain your answer.)
Find each of the following (if necessary, round to 2 decimal places):
A) Al's mean
B) Al's median
C) Bob's mean
D) Bob' median
E) Who is the better golfer "on average"? (Explain your answer.)
Question
The bar chart below was created using the number of children of each of the last 20 U.S. Presidents.
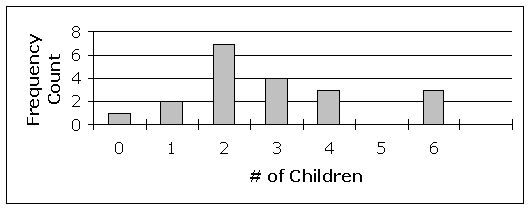
Find the relative frequency of presidents who had 3 children.
Find the relative frequency of presidents who had 3 children.
Question
The bar chart below was created using the number of children of each of the last 20 U.S. Presidents.

Find the relative frequency of presidents who had 1 children.
A) 10%
B) 2
C) 1
D) 20%
Find the relative frequency of presidents who had 1 children.
A) 10%
B) 2
C) 1
D) 20%
Question
Use the bar chart below to find the mean of the data set.
Round your answer to 2 decimal places.
Round your answer to 2 decimal places.
Question
Use the bar chart below to find the mean of the data set, rounded to 2 decimal places if necessary.
A) 5
B) 4.12
C) 4
D) 5.6
E) 4.87
A) 5
B) 4.12
C) 4
D) 5.6
E) 4.87
Question
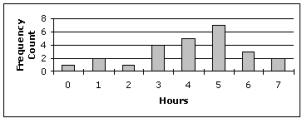
The histogram below was created use the ages of members of a certain family. Find the relative frequency of the family members in the 31-40 age range.
A) 3.125%
B) 1
C) 1%
D) 35
A) 3.125%
B) 1
C) 1%
D) 35
Question
Which of the following CANNOT be the mean of the data set represented in the following histogram.
A) 6.7
B) 7
C) 7.6
D) 6
A) 6.7
B) 7
C) 7.6
D) 6
Question
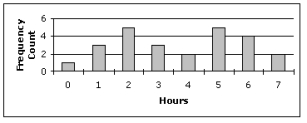
Use the following to answer questions
The following graph shows the results from 2,000 teenagers (ages 13 - 17) in the U.S. that were randomly selected and asked about the time they spent exercising each week.
-What percentage of 13 - 17 year old males exercise more than 2 hours per week?
The following graph shows the results from 2,000 teenagers (ages 13 - 17) in the U.S. that were randomly selected and asked about the time they spent exercising each week.
-What percentage of 13 - 17 year old males exercise more than 2 hours per week?
Question
Use the following to answer questions
The following graph shows the results from 2,000 teenagers (ages 13 - 17) in the U.S. that were randomly selected and asked about the time they spent exercising each week.
-What percentage of 13 - 17 year old females exercise more than 5 hours per week?
The following graph shows the results from 2,000 teenagers (ages 13 - 17) in the U.S. that were randomly selected and asked about the time they spent exercising each week.
-What percentage of 13 - 17 year old females exercise more than 5 hours per week?
Question
Use the following to answer questions
The following graph shows the results from 2,000 teenagers (ages 13 - 17) in the U.S. that were randomly selected and asked about the time they spent exercising each week.
-What percentage of 13 - 17 year old males exercise 3 hours or less per week?
The following graph shows the results from 2,000 teenagers (ages 13 - 17) in the U.S. that were randomly selected and asked about the time they spent exercising each week.
-What percentage of 13 - 17 year old males exercise 3 hours or less per week?
Question
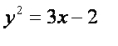
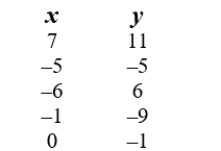
Select all of the following ordered pairs that satisfy the equation. 
A) (-5,7)
B) (2,-1)
C) (-2,-5)
D) (-3,-3)
E) (4,1)
A) (-5,7)
B) (2,-1)
C) (-2,-5)
D) (-3,-3)
E) (4,1)
Question
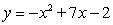
Which one of the following ordered pairs that satisfy the equation. 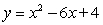
A) (1,9)
B) (-3,1)
C) (3,-11)
D) (-2,-3)
A) (1,9)
B) (-3,1)
C) (3,-11)
D) (-2,-3)
Question
Determine whether the ordered pair, (-3,-5), satisfies the equation.
Question
Find the value that correctly completes the ordered pair, (2,__) for the equation.
Question
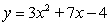
Select all of the following ordered pairs that satisfy the equation. 
A) (-1,-1)
B) (-2,-17)
C) (2,-17)
D) (-3,-23)
E) (1,7)
A) (-1,-1)
B) (-2,-17)
C) (2,-17)
D) (-3,-23)
E) (1,7)
Question
Which one of the following ordered pairs that satisfy the equation. 
A) (2,-2)
B) (-3,-13)
C) (-2,-2)
D) (1,7)
A) (2,-2)
B) (-3,-13)
C) (-2,-2)
D) (1,7)
Question
Determine whether the ordered pair, (-2,3), satisfies the equation.

Question
Find the value that completes the ordered pair, (-2,__), satisfies the equation.

Question
Find the value that completes the ordered pair, (2,__).
Question
Find the value that completes the ordered pair, (__,1).
Question
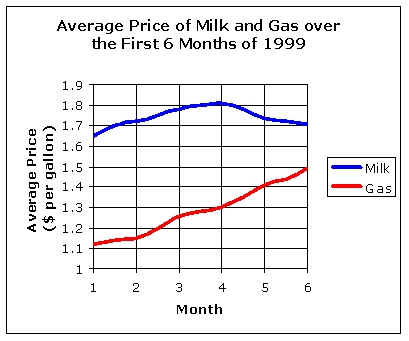
Use the graph below to answer the questions.

-
A) What was the average gas price in month 6 of 1999? (Round to the nearest $0.05.)
B) In what month did gas prices reach $1.40 per gallon?
C) After which month did milk prices begin to decrease?
-
A) What was the average gas price in month 6 of 1999? (Round to the nearest $0.05.)
B) In what month did gas prices reach $1.40 per gallon?
C) After which month did milk prices begin to decrease?
Question
Use the graph below to answer the question.

-
Choose the average gas price in month 4 of 1999.
A) $ 1.81
B) $ 0.30
C) $ 0.40
D) $ 1.30
-
Choose the average gas price in month 4 of 1999.
A) $ 1.81
B) $ 0.30
C) $ 0.40
D) $ 1.30
Question
Use the graph below to answer the questions.

-
In what month did milk prices reach $1.79 per gallon?
A) 2
B) 3
C) 6
D) 4
-
In what month did milk prices reach $1.79 per gallon?
A) 2
B) 3
C) 6
D) 4
Question
Use the graph below to answer the questions.
-
After which month did milk prices begin to decrease?
A) 2
B) 5
C) 4
D) 3
-
After which month did milk prices begin to decrease?
A) 2
B) 5
C) 4
D) 3
Question
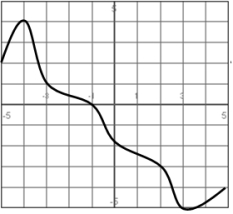
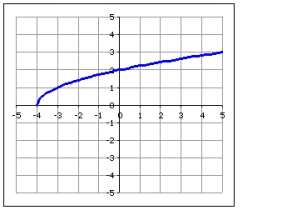
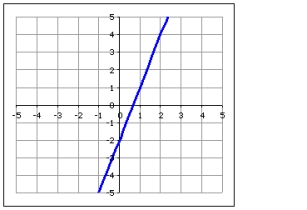
Which graph displays the solutions to the equation below?
A)
B)

C)
A)
B)
C)
Question
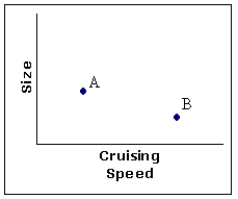
The following three graphs describe two cars, A and B.
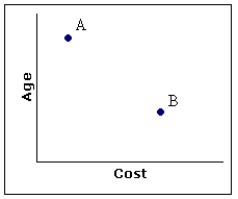

Which of the following is true?
A) The newer car is more expensive.
B) The newer car is less expensive.
Which of the following is true?
A) The newer car is more expensive.
B) The newer car is less expensive.
Question
The following three graphs describe two cars, A and B.


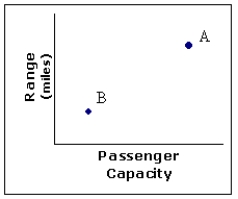
Which of the following is true?
A) The more expensive car has a shorter range.
B) The more expensive car has a longer range.
Which of the following is true?
A) The more expensive car has a shorter range.
B) The more expensive car has a longer range.
Question
For the equation:

what value cannot be in the domain?
what value cannot be in the domain?
Question
For the equation:

find the value of y when x is 6.
find the value of y when x is 6.
Question
For the equation:

find the value of x when y is 3.
find the value of x when y is 3.
Question
For the given equation  , which could never be a value of y?
A) 6
B) 1
C) -7
D) 2
, which could never be a value of y?A) 6
B) 1
C) -7
D) 2
Question
The following table shows data for the number of speeding tickets issued and the number of traffic deaths in Barron County by year.
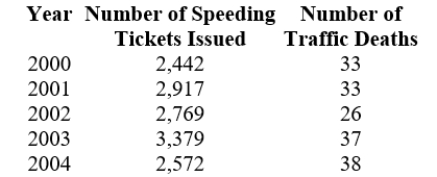
In which year were there the most traffic deaths?
In which year were there the most traffic deaths?
Question
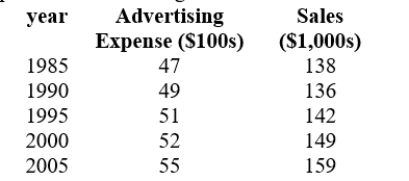
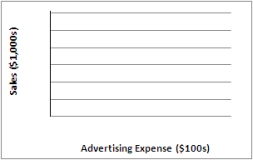
Create a scatter plot for the following data:
Question
Use the graph to fill in the table.
Question
Consider the table giving values for variables x and y.
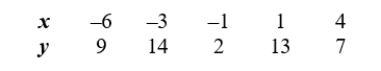
Determine whether y is a function of x.
A) y is a function of x
B) y is not a function of x
Determine whether y is a function of x.
A) y is a function of x
B) y is not a function of x
Question
Consider the table giving values for variables s and t.
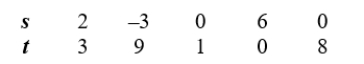
Determine which of the following best describes the relationship between s and t.
A) t is a function of s
B) s is a function of t
C) both A and B
D) None of the above
Determine which of the following best describes the relationship between s and t.
A) t is a function of s
B) s is a function of t
C) both A and B
D) None of the above
Question
Consider the table giving values for height and weight of 5 individuals.
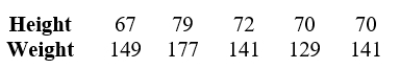
Determine which of the following best describes the relationship between height and weight.
A) Height is a function of weight.
B) Weight is a function of height.
C) Both A and B
D) None of the above.
Determine which of the following best describes the relationship between height and weight.
A) Height is a function of weight.
B) Weight is a function of height.
C) Both A and B
D) None of the above.
Question
The equation defines y as a function of x.
Question
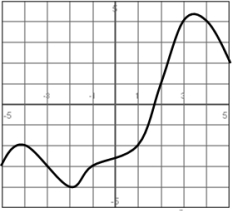
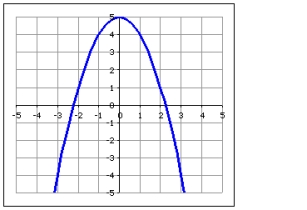
In the graph below, y is a function of x.
Question
Based upon the scatterplot choose the answer that best describes the relationship between x and y.
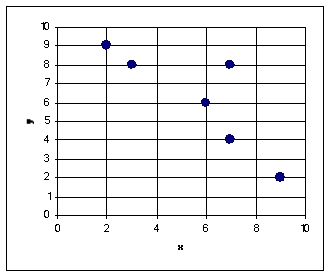
A) y is a function of x
B) x is a function of y
C) both A and B
D) None of the above
A) y is a function of x
B) x is a function of y
C) both A and B
D) None of the above
Question
Question
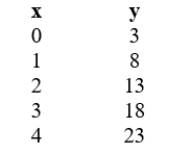
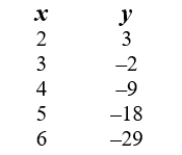
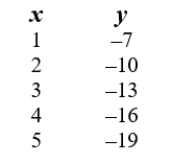
For the following data, find a formula that expresses y in terms of x.
Question
Find a formula that gives y in terms of x.
Question
Question
A taxi company has the following fare policy: any trip of 5 miles or less costs $5.00 and the cost for each additional mile is $0.35. The company will not make a trip longer than 30 miles.
Which formula and domain best describe the relationship between the cab fare, f, and the length of the trip, t, 5 miles or longer.
A)![<strong>A taxi company has the following fare policy: any trip of 5 miles or less costs $5.00 and the cost for each additional mile is $0.35. The company will not make a trip longer than 30 miles. Which formula and domain best describe the relationship between the cab fare, f, and the length of the trip, t, 5 miles or longer.</strong> A) ; Domain: [5,30] B) ; Domain: [0, ) C) ; Domain: (0,30] D) ; Domain: [5, ) <div style=padding-top: 35px>](https://d2lvgg3v3hfg70.cloudfront.net/TB9987/11ee8cf5_dce0_08e3_96e5_3d3411939326_TB9987_11.jpg) ; Domain: [5,30]
; Domain: [5,30]
B)![<strong>A taxi company has the following fare policy: any trip of 5 miles or less costs $5.00 and the cost for each additional mile is $0.35. The company will not make a trip longer than 30 miles. Which formula and domain best describe the relationship between the cab fare, f, and the length of the trip, t, 5 miles or longer.</strong> A) ; Domain: [5,30] B) ; Domain: [0, ) C) ; Domain: (0,30] D) ; Domain: [5, ) <div style=padding-top: 35px>](https://d2lvgg3v3hfg70.cloudfront.net/TB9987/11ee8cf5_dce0_2ff4_96e5_cd06b527425c_TB9987_11.jpg) ; Domain: [0,
; Domain: [0, ![<strong>A taxi company has the following fare policy: any trip of 5 miles or less costs $5.00 and the cost for each additional mile is $0.35. The company will not make a trip longer than 30 miles. Which formula and domain best describe the relationship between the cab fare, f, and the length of the trip, t, 5 miles or longer.</strong> A) ; Domain: [5,30] B) ; Domain: [0, ) C) ; Domain: (0,30] D) ; Domain: [5, ) <div style=padding-top: 35px>](https://d2lvgg3v3hfg70.cloudfront.net/TB9987/11ee8cf5_dce0_2ff5_96e5_6d2fd7f6ecdb_TB9987_11.jpg) )
)
C)![<strong>A taxi company has the following fare policy: any trip of 5 miles or less costs $5.00 and the cost for each additional mile is $0.35. The company will not make a trip longer than 30 miles. Which formula and domain best describe the relationship between the cab fare, f, and the length of the trip, t, 5 miles or longer.</strong> A) ; Domain: [5,30] B) ; Domain: [0, ) C) ; Domain: (0,30] D) ; Domain: [5, ) <div style=padding-top: 35px>](https://d2lvgg3v3hfg70.cloudfront.net/TB9987/11ee8cf5_dce0_2ff6_96e5_114bb749f0b1_TB9987_11.jpg) ; Domain: (0,30]
; Domain: (0,30]
D)![<strong>A taxi company has the following fare policy: any trip of 5 miles or less costs $5.00 and the cost for each additional mile is $0.35. The company will not make a trip longer than 30 miles. Which formula and domain best describe the relationship between the cab fare, f, and the length of the trip, t, 5 miles or longer.</strong> A) ; Domain: [5,30] B) ; Domain: [0, ) C) ; Domain: (0,30] D) ; Domain: [5, ) <div style=padding-top: 35px>](https://d2lvgg3v3hfg70.cloudfront.net/TB9987/11ee8cf5_dce0_2ff7_96e5_8fa7e9e6debb_TB9987_11.jpg) ; Domain: [5,
; Domain: [5, ![<strong>A taxi company has the following fare policy: any trip of 5 miles or less costs $5.00 and the cost for each additional mile is $0.35. The company will not make a trip longer than 30 miles. Which formula and domain best describe the relationship between the cab fare, f, and the length of the trip, t, 5 miles or longer.</strong> A) ; Domain: [5,30] B) ; Domain: [0, ) C) ; Domain: (0,30] D) ; Domain: [5, ) <div style=padding-top: 35px>](https://d2lvgg3v3hfg70.cloudfront.net/TB9987/11ee8cf5_dce0_2ff8_96e5_19b9fbf7432e_TB9987_11.jpg) )
)
Which formula and domain best describe the relationship between the cab fare, f, and the length of the trip, t, 5 miles or longer.
A)
; Domain: [5,30]B)
; Domain: [0, )C)
; Domain: (0,30]D)
; Domain: [5, ) Question
Question
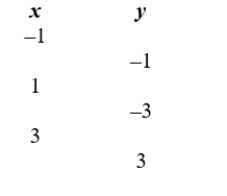
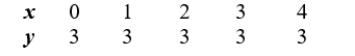
Determine if this table describes a function.
A) Yes. The points represent a function.
B) No. The points do not represent a function.
A) Yes. The points represent a function.
B) No. The points do not represent a function.
Question
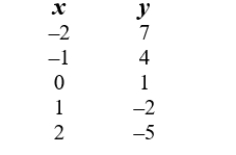
Find an equation that represents the relationship between x and y in this table:
Question
Find an equation that represents the relationship between x and y in this table:
Question
Find an equation that represents the relationship between x and y in this table:

Unlock Deck
Sign up to unlock the cards in this deck!
Unlock Deck
Unlock Deck
1/149
Play
Full screen (f)
Deck 1: An Introduction to Data and Functions
1
Below is a pie chart of the sources of points in a College Algebra class.
According to the chart, what is the smallest source of points in the class?
According to the chart, what is the smallest source of points in the class?
Projects
2
Below is a pie chart of the sources of points in a College Algebra class.
According to the chart, what is the smallest source of points in the class?
A) Tests
B) Final
C) Projects
D) HW
According to the chart, what is the smallest source of points in the class?
A) Tests
B) Final
C) Projects
D) HW
Projects
3
Jeremy has instructed his accountant to split any deposits into his retirement account into the investments as shown in the pie chart.
If Jeremy deposits $11,000 into his retirement account, how much will his accountant allocate to bonds?
If Jeremy deposits $11,000 into his retirement account, how much will his accountant allocate to bonds?
$ 3,300
4
Jeremy has instructed his accountant to split any deposits into his retirement account into the investments as shown in the pie chart.
If Jeremy's accountant allocates $4,200 to global equities, how much was his investment into his retirement account?
If Jeremy's accountant allocates $4,200 to global equities, how much was his investment into his retirement account?
Unlock Deck
Unlock for access to all 149 flashcards in this deck.
Unlock Deck
k this deck
5
Jeremy has instructed his accountant to split a $12,000 deposit to his retirement account into the investments as shown in the pie chart.
What percent of his investment was allocated to global equities?
What percent of his investment was allocated to global equities?
Unlock Deck
Unlock for access to all 149 flashcards in this deck.
Unlock Deck
k this deck
6
Find the mean of the data set below.
43, 34, 46, 38, 43, 37, 42, 23, 27, 40, 43, 21
Round your answer to 2 decimal places.
43, 34, 46, 38, 43, 37, 42, 23, 27, 40, 43, 21
Round your answer to 2 decimal places.
Unlock Deck
Unlock for access to all 149 flashcards in this deck.
Unlock Deck
k this deck
7
Find the mean of the data set below.
37, 69, 52, 40, 25, 64, 49, 73, 33, 66
A) 50.5
B) 49
C) 64
D) 50.8
37, 69, 52, 40, 25, 64, 49, 73, 33, 66
A) 50.5
B) 49
C) 64
D) 50.8
Unlock Deck
Unlock for access to all 149 flashcards in this deck.
Unlock Deck
k this deck
8
Find the median of the data set below.
28, 64, 37, 36, 19, 59, 44, 68, 28, 49, 63
28, 64, 37, 36, 19, 59, 44, 68, 28, 49, 63
Unlock Deck
Unlock for access to all 149 flashcards in this deck.
Unlock Deck
k this deck
9
Find the median of the data set below.
44, 80, 65, 52, 35, 75, 53, 84, 44, 60, 79
A) 75
B) 61.00
C) 60
D) 53
44, 80, 65, 52, 35, 75, 53, 84, 44, 60, 79
A) 75
B) 61.00
C) 60
D) 53
Unlock Deck
Unlock for access to all 149 flashcards in this deck.
Unlock Deck
k this deck
10
Find the median of the data set below.
28, 60, 46, 31, 13, 55, 40, 64, 24, 57
28, 60, 46, 31, 13, 55, 40, 64, 24, 57
Unlock Deck
Unlock for access to all 149 flashcards in this deck.
Unlock Deck
k this deck
11
Find the median of the data set below.
39, 71, 59, 42, 22, 66, 51, 75, 35, 68
A) 55
B) 52.8
C) 51
D) 59
39, 71, 59, 42, 22, 66, 51, 75, 35, 68
A) 55
B) 52.8
C) 51
D) 59
Unlock Deck
Unlock for access to all 149 flashcards in this deck.
Unlock Deck
k this deck
12
Here are the number of home runs that Babe Ruth hit in each of his 15 years with the New York Yankees, 1920 to 1934.
54, 59, 35, 41, 46, 25, 47, 60, 54, 46, 49, 46, 41, 34, 22
Calculate the each of the following for this data.
a) the mean
and
b) the median.
Round your answer to 2 decimal places.
54, 59, 35, 41, 46, 25, 47, 60, 54, 46, 49, 46, 41, 34, 22
Calculate the each of the following for this data.
a) the mean
and
b) the median.
Round your answer to 2 decimal places.
Unlock Deck
Unlock for access to all 149 flashcards in this deck.
Unlock Deck
k this deck
13
Find each of the following for the set of data: 20, 17, 21, 23, 19, 23, 25
A) the meanand
and
B) the median.Round your answer to 2 decimal places.
A) the meanand
and
B) the median.Round your answer to 2 decimal places.
Unlock Deck
Unlock for access to all 149 flashcards in this deck.
Unlock Deck
k this deck
14
On a recent test in a College Algebra class the following scores were recorded:
Find each of the following:
A) the meanand
and
B) the medianIf necessary, round answers to 2 decimal places.
Find each of the following:
A) the meanand
and
B) the medianIf necessary, round answers to 2 decimal places.
Unlock Deck
Unlock for access to all 149 flashcards in this deck.
Unlock Deck
k this deck
15
In a group of seven people the heights, in inches, of six are known to be 66, 61, 69, 69, 63, and 68. If the mean height of all seven people is 65, then what must the seventh height be?
Unlock Deck
Unlock for access to all 149 flashcards in this deck.
Unlock Deck
k this deck
16
In a group of seven people the heights, in inches, of six are know to be 72, 69, 65, 67, 72, and 61.
If the median height of all seven people is 67, then what must the seventh (from largest to smallest) height be?
A) 67 or less
B) 67 or greater
C) 67
D) 70
If the median height of all seven people is 67, then what must the seventh (from largest to smallest) height be?
A) 67 or less
B) 67 or greater
C) 67
D) 70
Unlock Deck
Unlock for access to all 149 flashcards in this deck.
Unlock Deck
k this deck
17
The frequency table below describes the age distribution of students in a college algebra class. Based on this information, estimate the largest and smallest possible values for the mean age of this class.
A) Find the smallest possible meanand
and
B) the largest possible mean.Round your answers to 2 decimals if necessary.
A) Find the smallest possible meanand
and
B) the largest possible mean.Round your answers to 2 decimals if necessary.
Unlock Deck
Unlock for access to all 149 flashcards in this deck.
Unlock Deck
k this deck
18
The frequency table below describes the age distribution of students in a college algebra class. Based on this information, estimate the smallest possible value for the mean age of this class.
Which of the following is the smallest possible mean?
Round your answers to 2 decimals if necessary.
A) 19.53
B) 20.53
C) 20.03
D) 18.5
Which of the following is the smallest possible mean?
Round your answers to 2 decimals if necessary.
A) 19.53
B) 20.53
C) 20.03
D) 18.5
Unlock Deck
Unlock for access to all 149 flashcards in this deck.
Unlock Deck
k this deck
19
The frequency table below describes the age distribution of students in a college algebra class. Based on this information, estimate the largest possible value for the mean age of this class.
Which of the following is the largest possible mean?
Round your answers to 2 decimals if necessary.
A) 19.00
B) 20.00
C) 19.5
D) 18.5
Which of the following is the largest possible mean?
Round your answers to 2 decimals if necessary.
A) 19.00
B) 20.00
C) 19.5
D) 18.5
Unlock Deck
Unlock for access to all 149 flashcards in this deck.
Unlock Deck
k this deck
20
The 1999 graduates of Bottom Line University all got great jobs. Their starting annual salaries are:
$36,000; $32,000; $42,000; $41,000; $40,000; $38,000; $60,000; $43,000; $52,000; and $2.3 million
(At 6'10'' "Hoops" Johnson is playing professional basketball.)
A) A headline in the alumni newsletter boasts "'1999 Graduates Highest Paid Yet. Salaries Average $_________" (Complete the headline.)
B) Is the mean or the median a better indication of what the graduates are typically making?
Unlock Deck
Unlock for access to all 149 flashcards in this deck.
Unlock Deck
k this deck
21
The 2006 graduates of Bottom Line University all got great jobs. Their starting annual salaries are: $32,000; $50,000; $54,000; $60,000; $46,000; $46,000; $37,000; $53,000; $51,000; and $2.5 million
(At 6'10'' "Hoops" Johnson is playing professional basketball.)
Which of the mean or median is a better indication of what their graduates typically make?
A) mean
B) median
(At 6'10'' "Hoops" Johnson is playing professional basketball.)
Which of the mean or median is a better indication of what their graduates typically make?
A) mean
B) median
Unlock Deck
Unlock for access to all 149 flashcards in this deck.
Unlock Deck
k this deck
22
For the following data:
61, 59, 77, 71, 66, 69, 73, 63, 66, 62, 79, 66, 71, 16, 74, 65, 60, 69, 78, 75, 73, 76, 66, 61, 77
Calculate
A) the mean (round to 2 decimal places),
B) the median, and
C) then identify any number that should be considered an outlier.Round your answer to 2 decimal places.
61, 59, 77, 71, 66, 69, 73, 63, 66, 62, 79, 66, 71, 16, 74, 65, 60, 69, 78, 75, 73, 76, 66, 61, 77
Calculate
A) the mean (round to 2 decimal places),
B) the median, and
C) then identify any number that should be considered an outlier.Round your answer to 2 decimal places.
Unlock Deck
Unlock for access to all 149 flashcards in this deck.
Unlock Deck
k this deck
23
For the following data:
51, 47, 63, 59, 54, 57, 61, 51, 54, 50, 65, 54, 59, 15, 62, 53, 50, 57, 64, 63, 61, 62, 54, 51, 65
Which of the following is the median?
A) 54
B) 55.28
C) 1,372
D) 57
51, 47, 63, 59, 54, 57, 61, 51, 54, 50, 65, 54, 59, 15, 62, 53, 50, 57, 64, 63, 61, 62, 54, 51, 65
Which of the following is the median?
A) 54
B) 55.28
C) 1,372
D) 57
Unlock Deck
Unlock for access to all 149 flashcards in this deck.
Unlock Deck
k this deck
24
For the following data:
76, 74, 92, 86, 81, 84, 88, 78, 81, 77, 94, 16, 86, 81, 89, 80, 75, 84, 93, 90, 88, 91, 81, 76, 92
Which of the following should be considered an outlier?
A) 84
B) 81
C) 80.92
D) 16
76, 74, 92, 86, 81, 84, 88, 78, 81, 77, 94, 16, 86, 81, 89, 80, 75, 84, 93, 90, 88, 91, 81, 76, 92
Which of the following should be considered an outlier?
A) 84
B) 81
C) 80.92
D) 16
Unlock Deck
Unlock for access to all 149 flashcards in this deck.
Unlock Deck
k this deck
25
For the following data:
68, 67, 75, 78, 66, 77, 66, 68, 80, 75, 79, 11, 62, 75, 73, 63, 75, 71
Calculate
A) the mean (Round to 2 decimal places.),
B) the median, and
C) then identify any number that should be considered an outlier.Round your answer to 2 decimal places.
68, 67, 75, 78, 66, 77, 66, 68, 80, 75, 79, 11, 62, 75, 73, 63, 75, 71
Calculate
A) the mean (Round to 2 decimal places.),
B) the median, and
C) then identify any number that should be considered an outlier.Round your answer to 2 decimal places.
Unlock Deck
Unlock for access to all 149 flashcards in this deck.
Unlock Deck
k this deck
26
For the following data:
64, 63, 72, 75, 62, 74, 62, 64, 77, 72, 76, 13, 58, 72, 70, 59, 72, 67
Calculate
A) the mean (Round to 2 decimal places.),
B) the median, and
C) then identify any number that should be considered an outlier.Round your answer to 2 decimal places.
64, 63, 72, 75, 62, 74, 62, 64, 77, 72, 76, 13, 58, 72, 70, 59, 72, 67
Calculate
A) the mean (Round to 2 decimal places.),
B) the median, and
C) then identify any number that should be considered an outlier.Round your answer to 2 decimal places.
Unlock Deck
Unlock for access to all 149 flashcards in this deck.
Unlock Deck
k this deck
27
The table shows starting salaries from a survey of recent college graduates:
A) How many students were surveyed?
B) What is the relative frequency of a graduate having a salary between $11,000 and $15,000?
Round your answer to 2 decimal places.
A) How many students were surveyed?
B) What is the relative frequency of a graduate having a salary between $11,000 and $15,000?
Round your answer to 2 decimal places.
Unlock Deck
Unlock for access to all 149 flashcards in this deck.
Unlock Deck
k this deck
28
The table shows starting salaries from a survey of recent college graduates:
What is the relative frequency of a graduate having a salary between $16,000 and $20,000?
Round your answer to 2 decimal places.
What is the relative frequency of a graduate having a salary between $16,000 and $20,000?
Round your answer to 2 decimal places.
Unlock Deck
Unlock for access to all 149 flashcards in this deck.
Unlock Deck
k this deck
29
The table shows starting salaries from a survey of recent college graduates:
What is the relative frequency of a graduate having a salary between $36,000 and $40,000?
Round your answer to 2 decimal places, if necessary
A) 0.34
B) 5
C) 0.11
D) 0.26
What is the relative frequency of a graduate having a salary between $36,000 and $40,000?
Round your answer to 2 decimal places, if necessary
A) 0.34
B) 5
C) 0.11
D) 0.26
Unlock Deck
Unlock for access to all 149 flashcards in this deck.
Unlock Deck
k this deck
30
Below is age data from a University of Massachusetts college algebra class.
Which is the relative frequency of students whose ages are in the interval from 18-20? (rounded to 2 decimal places)
A) 30
B) 3.33
C) 0.30
D) 0.17
Which is the relative frequency of students whose ages are in the interval from 18-20? (rounded to 2 decimal places)A) 30
B) 3.33
C) 0.30
D) 0.17
Unlock Deck
Unlock for access to all 149 flashcards in this deck.
Unlock Deck
k this deck
31
Two friends, Alfredo and Bob, are playing golf. Although they are about the same at driving the ball onto the green, Al is better at putting. On the 9th hole, Bob makes a 5 and Al hits into the lake and then gets stuck in a sand trap. By the time he gets to the green and makes it to the hole, his score is 12. Here are the scores for the 9 holes:
Find each of the following (if necessary, round to 2 decimal places):
A) Al's mean
B) Al's median
C) Bob's mean
D) Bob' median
E) Who is the better golfer "on average"? (Explain your answer.)
Find each of the following (if necessary, round to 2 decimal places):
A) Al's mean
B) Al's median
C) Bob's mean
D) Bob' median
E) Who is the better golfer "on average"? (Explain your answer.)
Unlock Deck
Unlock for access to all 149 flashcards in this deck.
Unlock Deck
k this deck
32
The bar chart below was created using the number of children of each of the last 20 U.S. Presidents.
Find the relative frequency of presidents who had 3 children.
Find the relative frequency of presidents who had 3 children.
Unlock Deck
Unlock for access to all 149 flashcards in this deck.
Unlock Deck
k this deck
33
The bar chart below was created using the number of children of each of the last 20 U.S. Presidents.
Find the relative frequency of presidents who had 1 children.
A) 10%
B) 2
C) 1
D) 20%
Find the relative frequency of presidents who had 1 children.
A) 10%
B) 2
C) 1
D) 20%
Unlock Deck
Unlock for access to all 149 flashcards in this deck.
Unlock Deck
k this deck
34
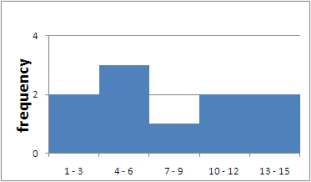
Use the bar chart below to find the mean of the data set.
Round your answer to 2 decimal places.
Round your answer to 2 decimal places.
Unlock Deck
Unlock for access to all 149 flashcards in this deck.
Unlock Deck
k this deck
35
Use the bar chart below to find the mean of the data set, rounded to 2 decimal places if necessary.
A) 5
B) 4.12
C) 4
D) 5.6
E) 4.87
A) 5
B) 4.12
C) 4
D) 5.6
E) 4.87
Unlock Deck
Unlock for access to all 149 flashcards in this deck.
Unlock Deck
k this deck
36
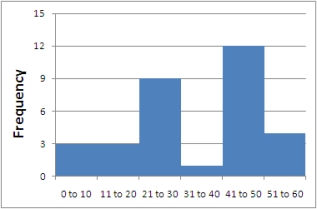
The histogram below was created use the ages of members of a certain family. Find the relative frequency of the family members in the 31-40 age range.
A) 3.125%
B) 1
C) 1%
D) 35
A) 3.125%
B) 1
C) 1%
D) 35
Unlock Deck
Unlock for access to all 149 flashcards in this deck.
Unlock Deck
k this deck
37
Which of the following CANNOT be the mean of the data set represented in the following histogram.
A) 6.7
B) 7
C) 7.6
D) 6
A) 6.7
B) 7
C) 7.6
D) 6
Unlock Deck
Unlock for access to all 149 flashcards in this deck.
Unlock Deck
k this deck
38
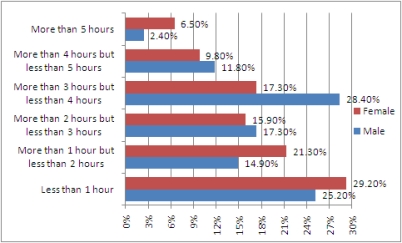
Use the following to answer questions
The following graph shows the results from 2,000 teenagers (ages 13 - 17) in the U.S. that were randomly selected and asked about the time they spent exercising each week.
-What percentage of 13 - 17 year old males exercise more than 2 hours per week?
The following graph shows the results from 2,000 teenagers (ages 13 - 17) in the U.S. that were randomly selected and asked about the time they spent exercising each week.
-What percentage of 13 - 17 year old males exercise more than 2 hours per week?
Unlock Deck
Unlock for access to all 149 flashcards in this deck.
Unlock Deck
k this deck
39
Use the following to answer questions
The following graph shows the results from 2,000 teenagers (ages 13 - 17) in the U.S. that were randomly selected and asked about the time they spent exercising each week.
-What percentage of 13 - 17 year old females exercise more than 5 hours per week?
The following graph shows the results from 2,000 teenagers (ages 13 - 17) in the U.S. that were randomly selected and asked about the time they spent exercising each week.
-What percentage of 13 - 17 year old females exercise more than 5 hours per week?
Unlock Deck
Unlock for access to all 149 flashcards in this deck.
Unlock Deck
k this deck
40
Use the following to answer questions
The following graph shows the results from 2,000 teenagers (ages 13 - 17) in the U.S. that were randomly selected and asked about the time they spent exercising each week.
-What percentage of 13 - 17 year old males exercise 3 hours or less per week?
The following graph shows the results from 2,000 teenagers (ages 13 - 17) in the U.S. that were randomly selected and asked about the time they spent exercising each week.
-What percentage of 13 - 17 year old males exercise 3 hours or less per week?
Unlock Deck
Unlock for access to all 149 flashcards in this deck.
Unlock Deck
k this deck
41
Select all of the following ordered pairs that satisfy the equation.
A) (-5,7)
B) (2,-1)
C) (-2,-5)
D) (-3,-3)
E) (4,1)
A) (-5,7)
B) (2,-1)
C) (-2,-5)
D) (-3,-3)
E) (4,1)
Unlock Deck
Unlock for access to all 149 flashcards in this deck.
Unlock Deck
k this deck
42
Which one of the following ordered pairs that satisfy the equation.
A) (1,9)
B) (-3,1)
C) (3,-11)
D) (-2,-3)
A) (1,9)
B) (-3,1)
C) (3,-11)
D) (-2,-3)
Unlock Deck
Unlock for access to all 149 flashcards in this deck.
Unlock Deck
k this deck
43
Determine whether the ordered pair, (-3,-5), satisfies the equation.
Unlock Deck
Unlock for access to all 149 flashcards in this deck.
Unlock Deck
k this deck
44
Find the value that correctly completes the ordered pair, (2,__) for the equation.
Unlock Deck
Unlock for access to all 149 flashcards in this deck.
Unlock Deck
k this deck
45
Select all of the following ordered pairs that satisfy the equation.
A) (-1,-1)
B) (-2,-17)
C) (2,-17)
D) (-3,-23)
E) (1,7)
A) (-1,-1)
B) (-2,-17)
C) (2,-17)
D) (-3,-23)
E) (1,7)
Unlock Deck
Unlock for access to all 149 flashcards in this deck.
Unlock Deck
k this deck
46
Which one of the following ordered pairs that satisfy the equation.
A) (2,-2)
B) (-3,-13)
C) (-2,-2)
D) (1,7)
A) (2,-2)
B) (-3,-13)
C) (-2,-2)
D) (1,7)
Unlock Deck
Unlock for access to all 149 flashcards in this deck.
Unlock Deck
k this deck
47
Determine whether the ordered pair, (-2,3), satisfies the equation.
Unlock Deck
Unlock for access to all 149 flashcards in this deck.
Unlock Deck
k this deck
48
Find the value that completes the ordered pair, (-2,__), satisfies the equation.
Unlock Deck
Unlock for access to all 149 flashcards in this deck.
Unlock Deck
k this deck
49
Find the value that completes the ordered pair, (2,__).
Unlock Deck
Unlock for access to all 149 flashcards in this deck.
Unlock Deck
k this deck
50
Find the value that completes the ordered pair, (__,1).
Unlock Deck
Unlock for access to all 149 flashcards in this deck.
Unlock Deck
k this deck
51
Use the graph below to answer the questions.
-
A) What was the average gas price in month 6 of 1999? (Round to the nearest $0.05.)
B) In what month did gas prices reach $1.40 per gallon?
C) After which month did milk prices begin to decrease?
-
A) What was the average gas price in month 6 of 1999? (Round to the nearest $0.05.)
B) In what month did gas prices reach $1.40 per gallon?
C) After which month did milk prices begin to decrease?
Unlock Deck
Unlock for access to all 149 flashcards in this deck.
Unlock Deck
k this deck
52
Use the graph below to answer the question.
-
Choose the average gas price in month 4 of 1999.
A) $ 1.81
B) $ 0.30
C) $ 0.40
D) $ 1.30
-
Choose the average gas price in month 4 of 1999.
A) $ 1.81
B) $ 0.30
C) $ 0.40
D) $ 1.30
Unlock Deck
Unlock for access to all 149 flashcards in this deck.
Unlock Deck
k this deck
53
Use the graph below to answer the questions.
-
In what month did milk prices reach $1.79 per gallon?
A) 2
B) 3
C) 6
D) 4
-
In what month did milk prices reach $1.79 per gallon?
A) 2
B) 3
C) 6
D) 4
Unlock Deck
Unlock for access to all 149 flashcards in this deck.
Unlock Deck
k this deck
54
Use the graph below to answer the questions.
-
After which month did milk prices begin to decrease?
A) 2
B) 5
C) 4
D) 3
-
After which month did milk prices begin to decrease?
A) 2
B) 5
C) 4
D) 3
Unlock Deck
Unlock for access to all 149 flashcards in this deck.
Unlock Deck
k this deck
55
Which graph displays the solutions to the equation below?
A)
B)
C)
A)
B)
C)
Unlock Deck
Unlock for access to all 149 flashcards in this deck.
Unlock Deck
k this deck
56
The following three graphs describe two cars, A and B.
Which of the following is true?
A) The newer car is more expensive.
B) The newer car is less expensive.
Which of the following is true?
A) The newer car is more expensive.
B) The newer car is less expensive.
Unlock Deck
Unlock for access to all 149 flashcards in this deck.
Unlock Deck
k this deck
57
The following three graphs describe two cars, A and B.
Which of the following is true?
A) The more expensive car has a shorter range.
B) The more expensive car has a longer range.
Which of the following is true?
A) The more expensive car has a shorter range.
B) The more expensive car has a longer range.
Unlock Deck
Unlock for access to all 149 flashcards in this deck.
Unlock Deck
k this deck
58
For the equation:
what value cannot be in the domain?
what value cannot be in the domain?
Unlock Deck
Unlock for access to all 149 flashcards in this deck.
Unlock Deck
k this deck
59
For the equation:
find the value of y when x is 6.
find the value of y when x is 6.
Unlock Deck
Unlock for access to all 149 flashcards in this deck.
Unlock Deck
k this deck
60
For the equation:
find the value of x when y is 3.
find the value of x when y is 3.
Unlock Deck
Unlock for access to all 149 flashcards in this deck.
Unlock Deck
k this deck
61
For the given equation , which could never be a value of y?
A) 6
B) 1
C) -7
D) 2
, which could never be a value of y?A) 6
B) 1
C) -7
D) 2
Unlock Deck
Unlock for access to all 149 flashcards in this deck.
Unlock Deck
k this deck
62
The following table shows data for the number of speeding tickets issued and the number of traffic deaths in Barron County by year.
In which year were there the most traffic deaths?
In which year were there the most traffic deaths?
Unlock Deck
Unlock for access to all 149 flashcards in this deck.
Unlock Deck
k this deck
63
Create a scatter plot for the following data:
Unlock Deck
Unlock for access to all 149 flashcards in this deck.
Unlock Deck
k this deck
64
Use the graph to fill in the table.
Unlock Deck
Unlock for access to all 149 flashcards in this deck.
Unlock Deck
k this deck
65
Consider the table giving values for variables x and y.
Determine whether y is a function of x.
A) y is a function of x
B) y is not a function of x
Determine whether y is a function of x.
A) y is a function of x
B) y is not a function of x
Unlock Deck
Unlock for access to all 149 flashcards in this deck.
Unlock Deck
k this deck
66
Consider the table giving values for variables s and t.
Determine which of the following best describes the relationship between s and t.
A) t is a function of s
B) s is a function of t
C) both A and B
D) None of the above
Determine which of the following best describes the relationship between s and t.
A) t is a function of s
B) s is a function of t
C) both A and B
D) None of the above
Unlock Deck
Unlock for access to all 149 flashcards in this deck.
Unlock Deck
k this deck
67
Consider the table giving values for height and weight of 5 individuals.
Determine which of the following best describes the relationship between height and weight.
A) Height is a function of weight.
B) Weight is a function of height.
C) Both A and B
D) None of the above.
Determine which of the following best describes the relationship between height and weight.
A) Height is a function of weight.
B) Weight is a function of height.
C) Both A and B
D) None of the above.
Unlock Deck
Unlock for access to all 149 flashcards in this deck.
Unlock Deck
k this deck
68
The equation defines y as a function of x.
Unlock Deck
Unlock for access to all 149 flashcards in this deck.
Unlock Deck
k this deck
69
In the graph below, y is a function of x.
Unlock Deck
Unlock for access to all 149 flashcards in this deck.
Unlock Deck
k this deck
70
Based upon the scatterplot choose the answer that best describes the relationship between x and y.
A) y is a function of x
B) x is a function of y
C) both A and B
D) None of the above
A) y is a function of x
B) x is a function of y
C) both A and B
D) None of the above
Unlock Deck
Unlock for access to all 149 flashcards in this deck.
Unlock Deck
k this deck
71
In the situation below, identify
A) the independent (input) variable, and
B) the dependent (output) variable.
Enter the variable only.
At the bookstore the total bill (b) is a function of the number of pencils you buy (p).
A) the independent (input) variable, and
B) the dependent (output) variable.
Enter the variable only.
At the bookstore the total bill (b) is a function of the number of pencils you buy (p).
Unlock Deck
Unlock for access to all 149 flashcards in this deck.
Unlock Deck
k this deck
72
For the following data, find a formula that expresses y in terms of x.
Unlock Deck
Unlock for access to all 149 flashcards in this deck.
Unlock Deck
k this deck
73
Find a formula that gives y in terms of x.
Unlock Deck
Unlock for access to all 149 flashcards in this deck.
Unlock Deck
k this deck
74
A plumber charges $20 for a house call plus $27 per hour while she is there, up to a maximum of 8 hours.
Write a formula to describe the price, p, of a house call by the plumber in terms of the hours, h, spent at the house.
Write a formula to describe the price, p, of a house call by the plumber in terms of the hours, h, spent at the house.
Unlock Deck
Unlock for access to all 149 flashcards in this deck.
Unlock Deck
k this deck
75
A taxi company has the following fare policy: any trip of 5 miles or less costs $5.00 and the cost for each additional mile is $0.35. The company will not make a trip longer than 30 miles.
Which formula and domain best describe the relationship between the cab fare, f, and the length of the trip, t, 5 miles or longer.
A) ; Domain: [5,30]
B) ; Domain: [0, )
C) ; Domain: (0,30]
D) ; Domain: [5, )
Which formula and domain best describe the relationship between the cab fare, f, and the length of the trip, t, 5 miles or longer.
A)
; Domain: [5,30]B)
; Domain: [0, )C)
; Domain: (0,30]D)
; Domain: [5, ) Unlock Deck
Unlock for access to all 149 flashcards in this deck.
Unlock Deck
k this deck
76
Determine if this set of points represents a function.
(7, 10), (6, -1), (-4, -6), (-8, -3), (4, -8)
A) Yes. The points represent a function.
B) No. The points do not represent a function.
(7, 10), (6, -1), (-4, -6), (-8, -3), (4, -8)
A) Yes. The points represent a function.
B) No. The points do not represent a function.
Unlock Deck
Unlock for access to all 149 flashcards in this deck.
Unlock Deck
k this deck
77
Determine if this table describes a function.
A) Yes. The points represent a function.
B) No. The points do not represent a function.
A) Yes. The points represent a function.
B) No. The points do not represent a function.
Unlock Deck
Unlock for access to all 149 flashcards in this deck.
Unlock Deck
k this deck
78
Find an equation that represents the relationship between x and y in this table:
Unlock Deck
Unlock for access to all 149 flashcards in this deck.
Unlock Deck
k this deck
79
Find an equation that represents the relationship between x and y in this table:
Unlock Deck
Unlock for access to all 149 flashcards in this deck.
Unlock Deck
k this deck
80
Find an equation that represents the relationship between x and y in this table:
Unlock Deck
Unlock for access to all 149 flashcards in this deck.
Unlock Deck
k this deck
Unlock Deck
Unlock for access to all 149 flashcards in this deck.


