Deck 12: Creating Advanced Reports
Full screen (f)
Question
Question
 The chart in the figure above is an example of a 3-D chart.
 Question
 The chart shown in the figure above is being edited.
 Question
 In the figure above, item 3 refers to the datasheet.
 Question
 In the figure above, item 4 refers to the legend.
 Question
Question
 The chart in the figure above is an example of a bar chart.
 Question
Question
Question
Question
Question
Question
Question
Question
Question
Question
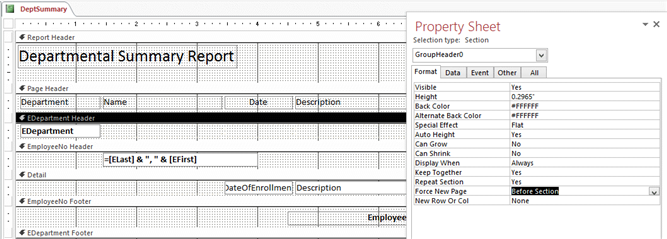 In the figure above, which property is being modified?
A) Force New Page
B) New Row or Col
C) Department Header
D) DeptSummary
Question
Question
Question
Question
Question
Question
Question
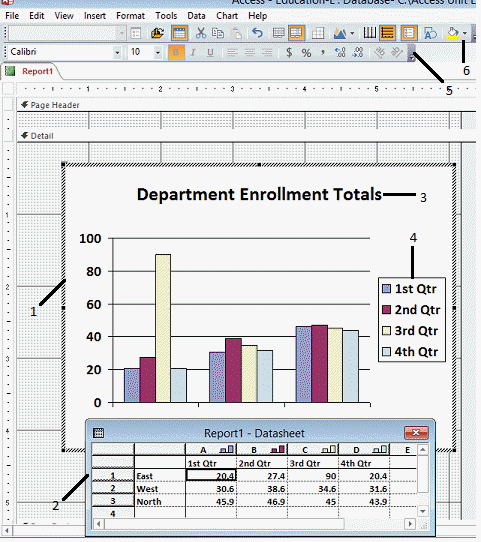 In the figure above, item 6 points to the ____.
A) Chart Standard toolbar
B) Chart Formatting toolbar
C) Datasheet toolbar
D) Editing toolbar
Question
Question
Question
 The chart in the figure above is a(n) ____ chart.
A) Area
B) Column
C) Line
D) Pie
Question
Question
Question
Question
Question
Question
Question
 In the figure above, item 2 is the ____.
A) Title
B) Datasheet
C) Chart Standard toolbar
D) Placeholder
Question
Question
Question
Question
Question
Question
Question
 In the figure above, item 5 points to the ____.
A) Chart Standard toolbar
B) Chart Formatting toolbar
C) Datasheet toolbar
D) Editing toolbar
Question
Question
Question
Question
Question
Question
 In the figure above, which chart would you most likely use to show comparisons of values, such as annual sales for a different product for several sales representatives?
A) Column
B) Pie
C) Doughnut
D) Scatter
Question
 In the figure above, which chart would you most likely use to show parts of a whole, such as the contribution of three sales divisions to the entire company's profits for the year?
A) Column
B) Line
C) Pie
D) Area
Question
Question
Question
Question
Question
 In the figure above, item 4 is the ____.
A) Title
B) Legend
C) Chart Standard toolbar
D) Placeholder
Question
Question
Question
Question
Question
Question
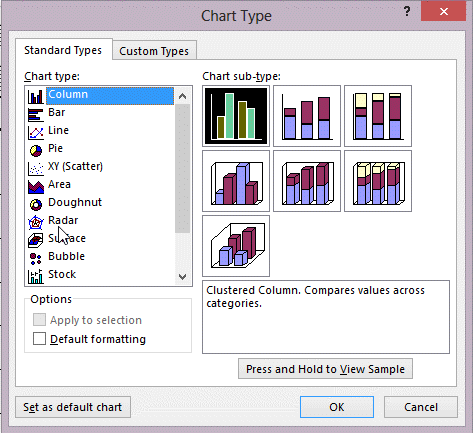 In the figure above, which chart would you most likely use to show cumulative totals in a stacked arrangement?
A) Scatter
B) Area
C) Bubble
D) Stock
Question
 In the figure above, which chart would you most likely use to show trends over time?
A) Surface
B) Pie
C) Radar
D) Line
Question
Question
Question
Question
Question
Question
Question
Question
Question
Question
Question
Question
Question
Question
Question
Question
Question
Question
Question
Question

Unlock Deck
Sign up to unlock the cards in this deck!
Unlock Deck
Unlock Deck
1/81
Play
Full screen (f)
Deck 12: Creating Advanced Reports
1
The Stacked layout is most often used in reports.
False
2
The chart in the figure above is an example of a 3-D chart.False
3
The chart shown in the figure above is being edited.True
4
In the figure above, item 3 refers to the datasheet. Unlock Deck
Unlock for access to all 81 flashcards in this deck.
Unlock Deck
k this deck
5
In the figure above, item 4 refers to the legend. Unlock Deck
Unlock for access to all 81 flashcards in this deck.
Unlock Deck
k this deck
6
Three-dimensional charts are always more effective than two-dimensional charts.
Unlock Deck
Unlock for access to all 81 flashcards in this deck.
Unlock Deck
k this deck
7
The chart in the figure above is an example of a bar chart. Unlock Deck
Unlock for access to all 81 flashcards in this deck.
Unlock Deck
k this deck
8
If a chart only has one set of values that represent 100% of something, it is a good candidate for a pie chart.
Unlock Deck
Unlock for access to all 81 flashcards in this deck.
Unlock Deck
k this deck
9
Numbers on a report can be displayed in Currency, Percent, or Standard formats.
Unlock Deck
Unlock for access to all 81 flashcards in this deck.
Unlock Deck
k this deck
10
Before using the Chart Wizard, it's a good idea to plan what specific fields you want the chart to display.
Unlock Deck
Unlock for access to all 81 flashcards in this deck.
Unlock Deck
k this deck
11
This property makes sure that controls in the page section repeat at the top of every page.
A) Force New Page
B) Repeat Section
C) Force Every Page
D) Repeat Every Page
A) Force New Page
B) Repeat Section
C) Force Every Page
D) Repeat Every Page
Unlock Deck
Unlock for access to all 81 flashcards in this deck.
Unlock Deck
k this deck
12
Layout in Access forms and reports means ____.
A) Sorting records in a report under a group header
B) Connecting controls as a set
C) Changing fonts and colors
D) Chart selection and placement
A) Sorting records in a report under a group header
B) Connecting controls as a set
C) Changing fonts and colors
D) Chart selection and placement
Unlock Deck
Unlock for access to all 81 flashcards in this deck.
Unlock Deck
k this deck
13
Each type of control on a report has formatting properties.
Unlock Deck
Unlock for access to all 81 flashcards in this deck.
Unlock Deck
k this deck
14
The ____ layout is most often used in forms.
A) Formula
B) Stacked
C) Tabular
D) Datasheet
A) Formula
B) Stacked
C) Tabular
D) Datasheet
Unlock Deck
Unlock for access to all 81 flashcards in this deck.
Unlock Deck
k this deck
15
Which of the following is NOT a formatting property available for many report controls?
A) Text Align
B) Width
C) Format
D) Data Type
A) Text Align
B) Width
C) Format
D) Data Type
Unlock Deck
Unlock for access to all 81 flashcards in this deck.
Unlock Deck
k this deck
16
A hashed border of a chart placeholder control indicates that the chart is displaying the most current data.
Unlock Deck
Unlock for access to all 81 flashcards in this deck.
Unlock Deck
k this deck
17
In the figure above, which property is being modified?A) Force New Page
B) New Row or Col
C) Department Header
D) DeptSummary
Unlock Deck
Unlock for access to all 81 flashcards in this deck.
Unlock Deck
k this deck
18
The Stacked layout positions labels to the left of their respective text boxes.
Unlock Deck
Unlock for access to all 81 flashcards in this deck.
Unlock Deck
k this deck
19
You can view margins on a report in Print Preview.
Unlock Deck
Unlock for access to all 81 flashcards in this deck.
Unlock Deck
k this deck
20
The ____ layout positions labels across the top in the Page Header section forming columns of data with text boxes positioned in the Detail section.
A) Formula
B) Stacked
C) Tabular
D) Datasheet
A) Formula
B) Stacked
C) Tabular
D) Datasheet
Unlock Deck
Unlock for access to all 81 flashcards in this deck.
Unlock Deck
k this deck
21
The first step in creating a chart is to ____.
A) select the data that the chart will graph
B) format the chart
C) resize the chart to fit the page
D) test different 3D chart options
A) select the data that the chart will graph
B) format the chart
C) resize the chart to fit the page
D) test different 3D chart options
Unlock Deck
Unlock for access to all 81 flashcards in this deck.
Unlock Deck
k this deck
22
What is the third optional argument for a domain function?
A) Criteria to select given records in the calculation
B) Domain name
C) Field used in the calculation
D) Standard disclaimer
A) Criteria to select given records in the calculation
B) Domain name
C) Field used in the calculation
D) Standard disclaimer
Unlock Deck
Unlock for access to all 81 flashcards in this deck.
Unlock Deck
k this deck
23
What is the second argument in the DLookup function?
A) the domain
B) the criteria
C) true or false
D) the field that is used for the calculation
A) the domain
B) the criteria
C) true or false
D) the field that is used for the calculation
Unlock Deck
Unlock for access to all 81 flashcards in this deck.
Unlock Deck
k this deck
24
In the figure above, item 6 points to the ____.A) Chart Standard toolbar
B) Chart Formatting toolbar
C) Datasheet toolbar
D) Editing toolbar
Unlock Deck
Unlock for access to all 81 flashcards in this deck.
Unlock Deck
k this deck
25
What are the two required arguments for a domain function?
A) Criteria and calculation
B) Criteria and domain name
C) Field used in the calculation and domain name
D) Field used in the calculation and criteria
A) Criteria and calculation
B) Criteria and domain name
C) Field used in the calculation and domain name
D) Field used in the calculation and criteria
Unlock Deck
Unlock for access to all 81 flashcards in this deck.
Unlock Deck
k this deck
26
When charts are displayed in Layout View, you will see which of the following?
A) Actual data
B) A chart placeholder
C) A pie chart
D) A data table
A) Actual data
B) A chart placeholder
C) A pie chart
D) A data table
Unlock Deck
Unlock for access to all 81 flashcards in this deck.
Unlock Deck
k this deck
27
The chart in the figure above is a(n) ____ chart.A) Area
B) Column
C) Line
D) Pie
Unlock Deck
Unlock for access to all 81 flashcards in this deck.
Unlock Deck
k this deck
28
Which chart type would best illustrate the cumulative total sales effort by month for several employees for a given year?
A) Area
B) Pie
C) Line
D) Column
A) Area
B) Pie
C) Line
D) Column
Unlock Deck
Unlock for access to all 81 flashcards in this deck.
Unlock Deck
k this deck
29
Which function would help you return a value from a specified table or query?
A) Seek
B) Disclaimer
C) DLookup
D) Domain
A) Seek
B) Disclaimer
C) DLookup
D) Domain
Unlock Deck
Unlock for access to all 81 flashcards in this deck.
Unlock Deck
k this deck
30
Which chart type would use horizontal bars to show annual sales for different sales representatives?
A) Column
B) Bar
C) Line
D) Area
A) Column
B) Bar
C) Line
D) Area
Unlock Deck
Unlock for access to all 81 flashcards in this deck.
Unlock Deck
k this deck
31
The domain in a domain aggregate function is the ____ that contains the field used in the calculation.
A) table or query
B) form or report
C) text box or label
D) property or control
A) table or query
B) form or report
C) text box or label
D) property or control
Unlock Deck
Unlock for access to all 81 flashcards in this deck.
Unlock Deck
k this deck
32
Where do you specify the number of columns for a report?
A) Print Preview toolbar
B) Page Setup dialog box
C) Form Design property sheet
D) Tab Set properties
A) Print Preview toolbar
B) Page Setup dialog box
C) Form Design property sheet
D) Tab Set properties
Unlock Deck
Unlock for access to all 81 flashcards in this deck.
Unlock Deck
k this deck
33
Which chart type would best show sales trends by connecting several points over time?
A) Column
B) Bar
C) Line
D) Area
A) Column
B) Bar
C) Line
D) Area
Unlock Deck
Unlock for access to all 81 flashcards in this deck.
Unlock Deck
k this deck
34
In the figure above, item 2 is the ____.A) Title
B) Datasheet
C) Chart Standard toolbar
D) Placeholder
Unlock Deck
Unlock for access to all 81 flashcards in this deck.
Unlock Deck
k this deck
35
The chart type that shows comparisons of values in horizontal bars is a(n) ____ chart.
A) Column
B) Bar
C) Line
D) Progress
A) Column
B) Bar
C) Line
D) Progress
Unlock Deck
Unlock for access to all 81 flashcards in this deck.
Unlock Deck
k this deck
36
What is the first argument in the DLookup function?
A) the domain
B) the criteria
C) true or false
D) the field that is used for the calculation
A) the domain
B) the criteria
C) true or false
D) the field that is used for the calculation
Unlock Deck
Unlock for access to all 81 flashcards in this deck.
Unlock Deck
k this deck
37
Which chart type would use vertical bars to show annual sales for different sales representatives?
A) Column
B) Bar
C) Line
D) Area
A) Column
B) Bar
C) Line
D) Area
Unlock Deck
Unlock for access to all 81 flashcards in this deck.
Unlock Deck
k this deck
38
Which chart type would best show cumulative sales by several representatives over time?
A) Column
B) Bar
C) Line
D) Area
A) Column
B) Bar
C) Line
D) Area
Unlock Deck
Unlock for access to all 81 flashcards in this deck.
Unlock Deck
k this deck
39
Which chart type would be used to best compare the annual sales for a different products for a given year?
A) Area
B) Pie
C) Line
D) Column
A) Area
B) Pie
C) Line
D) Column
Unlock Deck
Unlock for access to all 81 flashcards in this deck.
Unlock Deck
k this deck
40
Which chart type would best illustrate the contribution of three products to total company sales for a given year?
A) Area
B) Pie
C) Line
D) Column
A) Area
B) Pie
C) Line
D) Column
Unlock Deck
Unlock for access to all 81 flashcards in this deck.
Unlock Deck
k this deck
41
In the figure above, item 5 points to the ____.A) Chart Standard toolbar
B) Chart Formatting toolbar
C) Datasheet toolbar
D) Editing toolbar
Unlock Deck
Unlock for access to all 81 flashcards in this deck.
Unlock Deck
k this deck
42
____________________, also called graphs, are visual representations of numeric data that help users see comparisons, patterns, and trends in data.
Unlock Deck
Unlock for access to all 81 flashcards in this deck.
Unlock Deck
k this deck
43
The chart type that shows parts of a whole with slices is a(n) ____________________ Chart.
Unlock Deck
Unlock for access to all 81 flashcards in this deck.
Unlock Deck
k this deck
44
This chart area determines the x-axis on the chart.
A) Axis
B) Series
C) Legend
D) Data
A) Axis
B) Series
C) Legend
D) Data
Unlock Deck
Unlock for access to all 81 flashcards in this deck.
Unlock Deck
k this deck
45
The chart type that shows comparisons of values in horizontal bars is a(n) ____________________ Chart.
Unlock Deck
Unlock for access to all 81 flashcards in this deck.
Unlock Deck
k this deck
46
Access provides a(n) ____________________ Wizard that steps you through the process of creating charts within forms and reports.
Unlock Deck
Unlock for access to all 81 flashcards in this deck.
Unlock Deck
k this deck
47
In the figure above, which chart would you most likely use to show comparisons of values, such as annual sales for a different product for several sales representatives?A) Column
B) Pie
C) Doughnut
D) Scatter
Unlock Deck
Unlock for access to all 81 flashcards in this deck.
Unlock Deck
k this deck
48
In the figure above, which chart would you most likely use to show parts of a whole, such as the contribution of three sales divisions to the entire company's profits for the year?A) Column
B) Line
C) Pie
D) Area
Unlock Deck
Unlock for access to all 81 flashcards in this deck.
Unlock Deck
k this deck
49
The x-axis is also called the ____ axis.
A) y-
B) vertical
C) horizontal
D) legend
A) y-
B) vertical
C) horizontal
D) legend
Unlock Deck
Unlock for access to all 81 flashcards in this deck.
Unlock Deck
k this deck
50
This chart area determines the legend on the chart.
A) X-Axis
B) Series
C) Datasheet
D) Y-Axis
A) X-Axis
B) Series
C) Datasheet
D) Y-Axis
Unlock Deck
Unlock for access to all 81 flashcards in this deck.
Unlock Deck
k this deck
51
The chart type that shows trends over time by connecting points is a(n) ____________________ Chart.
Unlock Deck
Unlock for access to all 81 flashcards in this deck.
Unlock Deck
k this deck
52
Which of the following is NOT a common Access chart type?
A) Line
B) Progress
C) Pie
D) Area
A) Line
B) Progress
C) Pie
D) Area
Unlock Deck
Unlock for access to all 81 flashcards in this deck.
Unlock Deck
k this deck
53
In the figure above, item 4 is the ____.A) Title
B) Legend
C) Chart Standard toolbar
D) Placeholder
Unlock Deck
Unlock for access to all 81 flashcards in this deck.
Unlock Deck
k this deck
54
The chart type that shows comparisons of values in vertical bars is a(n) ____________________ Chart.
Unlock Deck
Unlock for access to all 81 flashcards in this deck.
Unlock Deck
k this deck
55
This chart area determines what field the bars on the chart represent.
A) Axis
B) Series
C) Legend
D) Data
A) Axis
B) Series
C) Legend
D) Data
Unlock Deck
Unlock for access to all 81 flashcards in this deck.
Unlock Deck
k this deck
56
A(n) ____________________ report repeats information in more than one column on the page.
Unlock Deck
Unlock for access to all 81 flashcards in this deck.
Unlock Deck
k this deck
57
The ____ area of a chart determines what field the bars on the chart represent.
A) Data
B) Axis
C) Series
D) None of the above
A) Data
B) Axis
C) Series
D) None of the above
Unlock Deck
Unlock for access to all 81 flashcards in this deck.
Unlock Deck
k this deck
58
____________________ functions are used in an expression to calculate a value based on a field that is not included in the Record Source property for the form or report.
Unlock Deck
Unlock for access to all 81 flashcards in this deck.
Unlock Deck
k this deck
59
In the figure above, which chart would you most likely use to show cumulative totals in a stacked arrangement?A) Scatter
B) Area
C) Bubble
D) Stock
Unlock Deck
Unlock for access to all 81 flashcards in this deck.
Unlock Deck
k this deck
60
In the figure above, which chart would you most likely use to show trends over time?A) Surface
B) Pie
C) Radar
D) Line
Unlock Deck
Unlock for access to all 81 flashcards in this deck.
Unlock Deck
k this deck
61
Jennifer works at the local animal shelter. Her boss wants her to use the shelter's database of animals to categorize the total number of cats, dogs, and other types of animals brought into the shelter this year. Her boss wants these categories: cats, dogs, and other. What kind of graph would be the best choice? Why?
Unlock Deck
Unlock for access to all 81 flashcards in this deck.
Unlock Deck
k this deck
62
You cannot always see actual chart values in Design View. _________________________
Unlock Deck
Unlock for access to all 81 flashcards in this deck.
Unlock Deck
k this deck
63
To format a number with a $ such as $50.99, use the Standard format. _________________________
Unlock Deck
Unlock for access to all 81 flashcards in this deck.
Unlock Deck
k this deck
64
The Page Numbers button is found on the VIEW tab of the ribbon. _________________________
Unlock Deck
Unlock for access to all 81 flashcards in this deck.
Unlock Deck
k this deck
65
Explain how the Page N of M option in the Page Numbers dialog box will present in the first three pages of a ten page report.
Unlock Deck
Unlock for access to all 81 flashcards in this deck.
Unlock Deck
k this deck
66
Identify four common chart types and what they are most commonly used for.
Unlock Deck
Unlock for access to all 81 flashcards in this deck.
Unlock Deck
k this deck
67
Ben works at the local animal shelter. His boss wants him to use the shelter's database of animals to graph the monthly adoptions of cats vs. dogs for the past 12 months. What kind of graph would be the best choice? Why?
Unlock Deck
Unlock for access to all 81 flashcards in this deck.
Unlock Deck
k this deck
68
Sara works at the local animal shelter. Her boss wants her to use the shelter's database of animals to graph the number of dogs adopted per month for the past 12 months and emphasize whether the trend is increasing or decreasing. What kind of graph would be the best choice? Why?
Unlock Deck
Unlock for access to all 81 flashcards in this deck.
Unlock Deck
k this deck
69
Charts can be added to forms or queries . _________________________
Unlock Deck
Unlock for access to all 81 flashcards in this deck.
Unlock Deck
k this deck
70
To change the color of the bars on a chart you must work in Report View. _________________________
Unlock Deck
Unlock for access to all 81 flashcards in this deck.
Unlock Deck
k this deck
71
You can open and close the Group Header and Group Footer sections in the Group, Sort, and Total pane. _________________________
Unlock Deck
Unlock for access to all 81 flashcards in this deck.
Unlock Deck
k this deck
72
Suzy has created a report that tracks the animals going in and out of the animal shelter where she works. Each animal's ID number is shown in the AnimalID Footer section. She wants to print each animal's record as a separate document so it can be used in the animal's file. How would she do this?
Unlock Deck
Unlock for access to all 81 flashcards in this deck.
Unlock Deck
k this deck
73
The text in a form or report tab is determined by the form or report's Title property. _________________________
Unlock Deck
Unlock for access to all 81 flashcards in this deck.
Unlock Deck
k this deck
74
The Remove Layout button is provided for a report only in Report Design View. _________________________
Unlock Deck
Unlock for access to all 81 flashcards in this deck.
Unlock Deck
k this deck
75
Explain the purpose of grouping controls together in a report table layout.
Unlock Deck
Unlock for access to all 81 flashcards in this deck.
Unlock Deck
k this deck
76
A date formatted as 19-Apr-16 has a Short Date format. _________________________
Unlock Deck
Unlock for access to all 81 flashcards in this deck.
Unlock Deck
k this deck
77
Aaron has created a report that tracks the animals going in and out of the animal shelter where he works. Each animal's record has been set up to print on a separate page. He wants to print the records for just the first 10 animals in the report. How would he do this?
Unlock Deck
Unlock for access to all 81 flashcards in this deck.
Unlock Deck
k this deck
78
All charts are modified in the ____________________ View of the form or report where the chart exists.
Unlock Deck
Unlock for access to all 81 flashcards in this deck.
Unlock Deck
k this deck
79
The chart type that shows cumulative totals using stacked sections is a(n) ____________________ Chart.
Unlock Deck
Unlock for access to all 81 flashcards in this deck.
Unlock Deck
k this deck
80
In a report, the Narrow margin option sets all four margins to 0.25". _________________________
Unlock Deck
Unlock for access to all 81 flashcards in this deck.
Unlock Deck
k this deck
Unlock Deck
Unlock for access to all 81 flashcards in this deck.


