Deck 52: An Introduction to Ecology and the Biosphere
Full screen (f)
Question
Question
Question
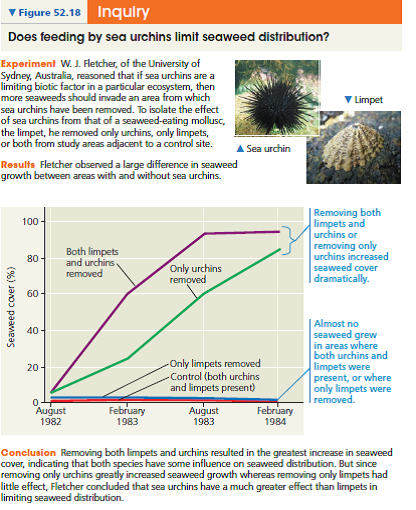
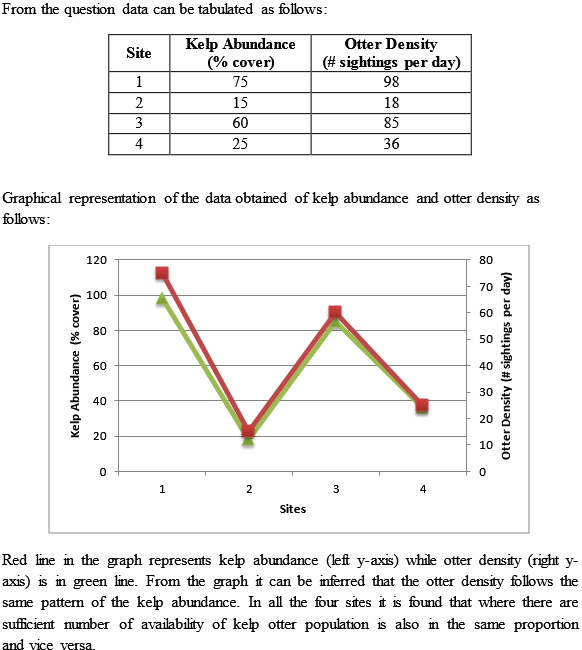
Interpret the Data After examining Figure 52.18, you decide to study feeding relationships among sea otters, sea urchins, and kelp. You know that sea otters prey on sea urchins and that urchins eat kelp. At four coastal sites, you measure kelp abundance. Then you spend one day at each site and mark whether otters are present or absent every 5 minutes during the day. Make a graph that shows how otter density depends on kelp abundance, using the data below. Then formulate a hypothesis to explain the pattern you observed. 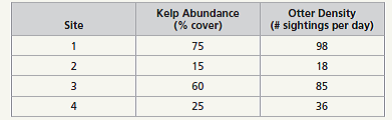
Question
Question
Jens Clausen and colleagues, at the Carnegie Institution of Washington, studied how the size of yarrow plants (Achillea lanulosa) growing on the slopes of the Sierra Nevada varied with elevation. They found that plants from low elevations were generally taller than plants from high elevations, as shown below: 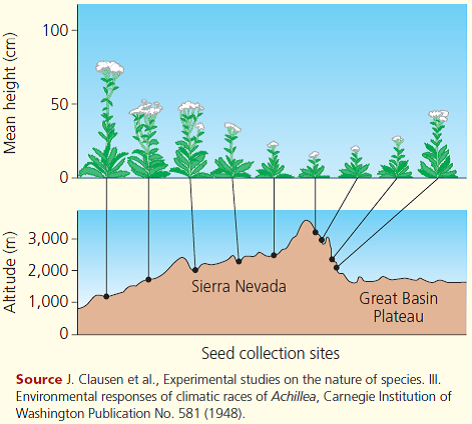
Clausen and colleagues proposed two hypotheses to explain this variation within a species: (1) There are genetic differences between populations of plants found at different elevations. (2) The species has developmental flexibility and can assume tall or short growth forms, depending on local abiotic factors. If you had seeds from yarrow plants found at low and high elevations, what experiments would you perform to test these hypotheses
Clausen and colleagues proposed two hypotheses to explain this variation within a species: (1) There are genetic differences between populations of plants found at different elevations. (2) The species has developmental flexibility and can assume tall or short growth forms, depending on local abiotic factors. If you had seeds from yarrow plants found at low and high elevations, what experiments would you perform to test these hypotheses
Question
Question
Making a Bar Graph and a Line Graph to Interpret Data
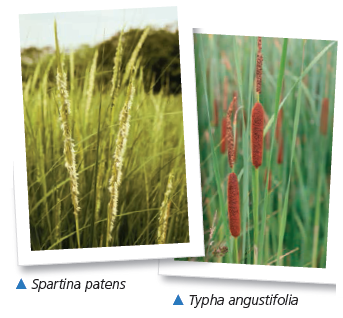
How Do Salinity and Competition Affect the Distribution of Plants in an Estuary Field observations show that Spartina patens (salt marsh hay) is a dominant plant in salt marshes and Typha angustifolia (cattail) is a dominant plant in freshwater marshes. In this exercise, you will graph and interpret data from an experiment that examined the influence of an abiotic factor, salinity, and a biotic factor, competition, on the growth of these two species.
How the Experiment Was Done Researchers planted S. patens and T. angustifolia in salt marshes and freshwater marshes with and without neighboring plants. After two growing seasons (1.5 years), they measured the biomass of each species in each treatment. The researchers also grew both species in a greenhouse at six salinity levels and measured the biomass at each level after eight weeks.
Data from the Field Experiment (averages of 16 replicate samples)
Data from the Greenhouse Experiment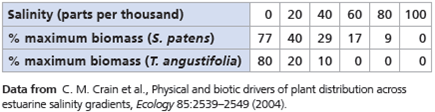

Make a bar graph of the data from the field experiment. (For additional information about graphs, see the Scientific Skills Review in Appendix F.) What do these data indicate about the salinity tolerances of S. patens and T. angustifolia
Instructors : A version of this Scientific Skills Exercise can be assigned in MasteringBiology.
How Do Salinity and Competition Affect the Distribution of Plants in an Estuary Field observations show that Spartina patens (salt marsh hay) is a dominant plant in salt marshes and Typha angustifolia (cattail) is a dominant plant in freshwater marshes. In this exercise, you will graph and interpret data from an experiment that examined the influence of an abiotic factor, salinity, and a biotic factor, competition, on the growth of these two species.
How the Experiment Was Done Researchers planted S. patens and T. angustifolia in salt marshes and freshwater marshes with and without neighboring plants. After two growing seasons (1.5 years), they measured the biomass of each species in each treatment. The researchers also grew both species in a greenhouse at six salinity levels and measured the biomass at each level after eight weeks.
Data from the Field Experiment (averages of 16 replicate samples)
Data from the Greenhouse Experiment
Make a bar graph of the data from the field experiment. (For additional information about graphs, see the Scientific Skills Review in Appendix F.) What do these data indicate about the salinity tolerances of S. patens and T. angustifolia
Instructors : A version of this Scientific Skills Exercise can be assigned in MasteringBiology.
Question
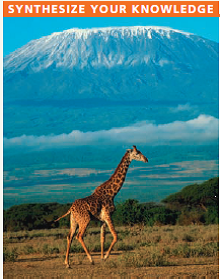
If you were to hike up Mount Kilimanjaro in Tanzania, you would pass through several habitats, including savanna at the base, forest on the slopes, and alpine tundra near the top. Explain how such diverse habitats can be found at one location near the equator.
Question
Question
Making a Bar Graph and a Line Graph to Interpret Data
How Do Salinity and Competition Affect the Distribution of Plants in an Estuary Field observations show that Spartina patens (salt marsh hay) is a dominant plant in salt marshes and Typha angustifolia (cattail) is a dominant plant in freshwater marshes. In this exercise, you will graph and interpret data from an experiment that examined the influence of an abiotic factor, salinity, and a biotic factor, competition, on the growth of these two species.
How the Experiment Was Done Researchers planted S. patens and T. angustifolia in salt marshes and freshwater marshes with and without neighboring plants. After two growing seasons (1.5 years), they measured the biomass of each species in each treatment. The researchers also grew both species in a greenhouse at six salinity levels and measured the biomass at each level after eight weeks.
Data from the Field Experiment (averages of 16 replicate samples)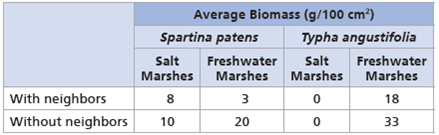
Data from the Greenhouse Experiment

What do the data from the field experiment indicate about the effect of competition on the growth of these two species Which species was limited more by competition
Instructors : A version of this Scientific Skills Exercise can be assigned in MasteringBiology.
How Do Salinity and Competition Affect the Distribution of Plants in an Estuary Field observations show that Spartina patens (salt marsh hay) is a dominant plant in salt marshes and Typha angustifolia (cattail) is a dominant plant in freshwater marshes. In this exercise, you will graph and interpret data from an experiment that examined the influence of an abiotic factor, salinity, and a biotic factor, competition, on the growth of these two species.
How the Experiment Was Done Researchers planted S. patens and T. angustifolia in salt marshes and freshwater marshes with and without neighboring plants. After two growing seasons (1.5 years), they measured the biomass of each species in each treatment. The researchers also grew both species in a greenhouse at six salinity levels and measured the biomass at each level after eight weeks.
Data from the Field Experiment (averages of 16 replicate samples)
Data from the Greenhouse Experiment
What do the data from the field experiment indicate about the effect of competition on the growth of these two species Which species was limited more by competition
Instructors : A version of this Scientific Skills Exercise can be assigned in MasteringBiology.
Question
Question
Making a Bar Graph and a Line Graph to Interpret Data
How Do Salinity and Competition Affect the Distribution of Plants in an Estuary Field observations show that Spartina patens (salt marsh hay) is a dominant plant in salt marshes and Typha angustifolia (cattail) is a dominant plant in freshwater marshes. In this exercise, you will graph and interpret data from an experiment that examined the influence of an abiotic factor, salinity, and a biotic factor, competition, on the growth of these two species.
How the Experiment Was Done Researchers planted S. patens and T. angustifolia in salt marshes and freshwater marshes with and without neighboring plants. After two growing seasons (1.5 years), they measured the biomass of each species in each treatment. The researchers also grew both species in a greenhouse at six salinity levels and measured the biomass at each level after eight weeks.
Data from the Field Experiment (averages of 16 replicate samples)
Data from the Greenhouse Experiment
Make a line graph of the data from the greenhouse experiment. Decide which values constitute the dependent and independent variables, and use these values to set up the axes of your graph.
Instructors : A version of this Scientific Skills Exercise can be assigned in MasteringBiology.
Question
Question
Making a Bar Graph and a Line Graph to Interpret Data
How Do Salinity and Competition Affect the Distribution of Plants in an Estuary Field observations show that Spartina patens (salt marsh hay) is a dominant plant in salt marshes and Typha angustifolia (cattail) is a dominant plant in freshwater marshes. In this exercise, you will graph and interpret data from an experiment that examined the influence of an abiotic factor, salinity, and a biotic factor, competition, on the growth of these two species.
How the Experiment Was Done Researchers planted S. patens and T. angustifolia in salt marshes and freshwater marshes with and without neighboring plants. After two growing seasons (1.5 years), they measured the biomass of each species in each treatment. The researchers also grew both species in a greenhouse at six salinity levels and measured the biomass at each level after eight weeks.
Data from the Field Experiment (averages of 16 replicate samples)
Data from the Greenhouse Experiment

(a) In the field, S. patens is typically absent from freshwater marshes. Based on the data, does this appear to be due to salinity or competition Explain your answer. (b) T. angustifolia does not grow in salt marshes. Does this appear to be due to salinity or competition Explain your answer.
Instructors : A version of this Scientific Skills Exercise can be assigned in MasteringBiology.
How Do Salinity and Competition Affect the Distribution of Plants in an Estuary Field observations show that Spartina patens (salt marsh hay) is a dominant plant in salt marshes and Typha angustifolia (cattail) is a dominant plant in freshwater marshes. In this exercise, you will graph and interpret data from an experiment that examined the influence of an abiotic factor, salinity, and a biotic factor, competition, on the growth of these two species.
How the Experiment Was Done Researchers planted S. patens and T. angustifolia in salt marshes and freshwater marshes with and without neighboring plants. After two growing seasons (1.5 years), they measured the biomass of each species in each treatment. The researchers also grew both species in a greenhouse at six salinity levels and measured the biomass at each level after eight weeks.
Data from the Field Experiment (averages of 16 replicate samples)
Data from the Greenhouse Experiment
(a) In the field, S. patens is typically absent from freshwater marshes. Based on the data, does this appear to be due to salinity or competition Explain your answer. (b) T. angustifolia does not grow in salt marshes. Does this appear to be due to salinity or competition Explain your answer.
Instructors : A version of this Scientific Skills Exercise can be assigned in MasteringBiology.
Question
Question
Question

Unlock Deck
Sign up to unlock the cards in this deck!
Unlock Deck
Unlock Deck
1/17
Play
Full screen (f)
Deck 52: An Introduction to Ecology and the Biosphere
1
Suppose that the number of bird species is determined mainly by the number of vertical strata found in the environment. If so, in which of the following biomes would you find the greatest number of bird species
A) tropical rain forest
B) savanna
C) desert
D) temperate broadleaf forest
A) tropical rain forest
B) savanna
C) desert
D) temperate broadleaf forest
Tropical rain forests are distributed over equatorial and subequatorial regions across the globe which makes them receive maximum sun rays throughout the day. This provides better precipitation and conducive environs for dense forests to grow which supports other living creatures to survive in the vicinity. Therefore, in comparison to other terrestrial biomes tropical rain forest are having greatest number of bird species.
Hence, the correct option is (a) tropical rain forest
Hence, the correct option is (a) tropical rain forest
2
What I F If the direction of Earth's rotation reversed, the most predictable effect would be
A) a big change in the length of the year.
B) winds blowing from west to east along the equator.
C) a loss of seasonal variation at high latitudes.
D) the elimination of ocean currents.
A) a big change in the length of the year.
B) winds blowing from west to east along the equator.
C) a loss of seasonal variation at high latitudes.
D) the elimination of ocean currents.
In normal condition when earth rotes from east to west equatorial winds blow from east to west. When the direction of the earth is reversed it will reverse the direction of equatorial wind only and all other phenomenon will remain as it is.
Hence, the correct option is (c) winds blowing from west to east along the equator.
Day and night on earth is caused its rotation on its axis. It is independent of the direction of spin of the earth.
Therefore, the option (a) is incorrect.
The length of the year is the time taken by earth for one complete revolution around the sun and is independent of the direction of spin of the earth on its axis.
Therefore, the option (b) is incorrect.
Seasonal variation on earth at various altitudes is due to the tilt of 23.5 o from the normal and is independent of the direction of rotation of earth on its axis.
Therefore, the option (d) is incorrect.
Ocean current are caused by the rotation of earth on its own axis. With the change in the direction of rotation of earth on its axis the direction of ocean currents will also get reversed but they will not be eliminated.
Therefore, the option (e) is incorrect.
3
Interpret the Data After examining Figure 52.18, you decide to study feeding relationships among sea otters, sea urchins, and kelp. You know that sea otters prey on sea urchins and that urchins eat kelp. At four coastal sites, you measure kelp abundance. Then you spend one day at each site and mark whether otters are present or absent every 5 minutes during the day. Make a graph that shows how otter density depends on kelp abundance, using the data below. Then formulate a hypothesis to explain the pattern you observed.


4
EVOLUTION CONNECTION Discuss how the distribution of a species can be affected both by its evolutionary history and by ecological factors. Could ongoing evolutionary change also affect its distribution Explain.
Unlock Deck
Unlock for access to all 17 flashcards in this deck.
Unlock Deck
k this deck
5
Jens Clausen and colleagues, at the Carnegie Institution of Washington, studied how the size of yarrow plants (Achillea lanulosa) growing on the slopes of the Sierra Nevada varied with elevation. They found that plants from low elevations were generally taller than plants from high elevations, as shown below:
Clausen and colleagues proposed two hypotheses to explain this variation within a species: (1) There are genetic differences between populations of plants found at different elevations. (2) The species has developmental flexibility and can assume tall or short growth forms, depending on local abiotic factors. If you had seeds from yarrow plants found at low and high elevations, what experiments would you perform to test these hypotheses
Clausen and colleagues proposed two hypotheses to explain this variation within a species: (1) There are genetic differences between populations of plants found at different elevations. (2) The species has developmental flexibility and can assume tall or short growth forms, depending on local abiotic factors. If you had seeds from yarrow plants found at low and high elevations, what experiments would you perform to test these hypotheses
Unlock Deck
Unlock for access to all 17 flashcards in this deck.
Unlock Deck
k this deck
6
WRITE ABOUT A THEME: INTERACTIONS Global warming is occurring rapidly in arctic marine and terrestrial ecosystems. The reflective white snow and ice cover are melting quickly and extensively, uncovering darker-colored ocean water, plants, and rocks. In a short essay (100-150 words), explain how this process might exemplify positive feedback.
Unlock Deck
Unlock for access to all 17 flashcards in this deck.
Unlock Deck
k this deck
7
Making a Bar Graph and a Line Graph to Interpret Data
How Do Salinity and Competition Affect the Distribution of Plants in an Estuary Field observations show that Spartina patens (salt marsh hay) is a dominant plant in salt marshes and Typha angustifolia (cattail) is a dominant plant in freshwater marshes. In this exercise, you will graph and interpret data from an experiment that examined the influence of an abiotic factor, salinity, and a biotic factor, competition, on the growth of these two species.
How the Experiment Was Done Researchers planted S. patens and T. angustifolia in salt marshes and freshwater marshes with and without neighboring plants. After two growing seasons (1.5 years), they measured the biomass of each species in each treatment. The researchers also grew both species in a greenhouse at six salinity levels and measured the biomass at each level after eight weeks.
Data from the Field Experiment (averages of 16 replicate samples)
Data from the Greenhouse Experiment
Make a bar graph of the data from the field experiment. (For additional information about graphs, see the Scientific Skills Review in Appendix F.) What do these data indicate about the salinity tolerances of S. patens and T. angustifolia
Instructors : A version of this Scientific Skills Exercise can be assigned in MasteringBiology.
Unlock Deck
Unlock for access to all 17 flashcards in this deck.
Unlock Deck
k this deck
8
If you were to hike up Mount Kilimanjaro in Tanzania, you would pass through several habitats, including savanna at the base, forest on the slopes, and alpine tundra near the top. Explain how such diverse habitats can be found at one location near the equator.
Unlock Deck
Unlock for access to all 17 flashcards in this deck.
Unlock Deck
k this deck
9
Which of the following areas of study focuses on the exchange of energy, organisms, and materials between ecosystems
A) organismal ecology
B) landscape ecology
C) ecosystem ecology
D) community ecology
A) organismal ecology
B) landscape ecology
C) ecosystem ecology
D) community ecology
Unlock Deck
Unlock for access to all 17 flashcards in this deck.
Unlock Deck
k this deck
10
Making a Bar Graph and a Line Graph to Interpret Data
How Do Salinity and Competition Affect the Distribution of Plants in an Estuary Field observations show that Spartina patens (salt marsh hay) is a dominant plant in salt marshes and Typha angustifolia (cattail) is a dominant plant in freshwater marshes. In this exercise, you will graph and interpret data from an experiment that examined the influence of an abiotic factor, salinity, and a biotic factor, competition, on the growth of these two species.
How the Experiment Was Done Researchers planted S. patens and T. angustifolia in salt marshes and freshwater marshes with and without neighboring plants. After two growing seasons (1.5 years), they measured the biomass of each species in each treatment. The researchers also grew both species in a greenhouse at six salinity levels and measured the biomass at each level after eight weeks.
Data from the Field Experiment (averages of 16 replicate samples)
Data from the Greenhouse Experiment
What do the data from the field experiment indicate about the effect of competition on the growth of these two species Which species was limited more by competition
Instructors : A version of this Scientific Skills Exercise can be assigned in MasteringBiology.
Unlock Deck
Unlock for access to all 17 flashcards in this deck.
Unlock Deck
k this deck
11
Which lake zone would be absent in a very shallow lake
A) benthic zone
B) aphotic zone
C) pelagic zone
D) littoral zone
A) benthic zone
B) aphotic zone
C) pelagic zone
D) littoral zone
Unlock Deck
Unlock for access to all 17 flashcards in this deck.
Unlock Deck
k this deck
12
Making a Bar Graph and a Line Graph to Interpret Data
How Do Salinity and Competition Affect the Distribution of Plants in an Estuary Field observations show that Spartina patens (salt marsh hay) is a dominant plant in salt marshes and Typha angustifolia (cattail) is a dominant plant in freshwater marshes. In this exercise, you will graph and interpret data from an experiment that examined the influence of an abiotic factor, salinity, and a biotic factor, competition, on the growth of these two species.
How the Experiment Was Done Researchers planted S. patens and T. angustifolia in salt marshes and freshwater marshes with and without neighboring plants. After two growing seasons (1.5 years), they measured the biomass of each species in each treatment. The researchers also grew both species in a greenhouse at six salinity levels and measured the biomass at each level after eight weeks.
Data from the Field Experiment (averages of 16 replicate samples)
Data from the Greenhouse Experiment
Make a line graph of the data from the greenhouse experiment. Decide which values constitute the dependent and independent variables, and use these values to set up the axes of your graph.
Instructors : A version of this Scientific Skills Exercise can be assigned in MasteringBiology.
Unlock Deck
Unlock for access to all 17 flashcards in this deck.
Unlock Deck
k this deck
13
Which of the following is characteristic of most terrestrial biomes
A) a distribution predicted almost entirely by rock and soil patterns
B) clear boundaries between adjacent biomes
C) vegetation demonstrating vertical layering
D) cold winter months
A) a distribution predicted almost entirely by rock and soil patterns
B) clear boundaries between adjacent biomes
C) vegetation demonstrating vertical layering
D) cold winter months
Unlock Deck
Unlock for access to all 17 flashcards in this deck.
Unlock Deck
k this deck
14
Making a Bar Graph and a Line Graph to Interpret Data
How Do Salinity and Competition Affect the Distribution of Plants in an Estuary Field observations show that Spartina patens (salt marsh hay) is a dominant plant in salt marshes and Typha angustifolia (cattail) is a dominant plant in freshwater marshes. In this exercise, you will graph and interpret data from an experiment that examined the influence of an abiotic factor, salinity, and a biotic factor, competition, on the growth of these two species.
How the Experiment Was Done Researchers planted S. patens and T. angustifolia in salt marshes and freshwater marshes with and without neighboring plants. After two growing seasons (1.5 years), they measured the biomass of each species in each treatment. The researchers also grew both species in a greenhouse at six salinity levels and measured the biomass at each level after eight weeks.
Data from the Field Experiment (averages of 16 replicate samples)
Data from the Greenhouse Experiment
(a) In the field, S. patens is typically absent from freshwater marshes. Based on the data, does this appear to be due to salinity or competition Explain your answer. (b) T. angustifolia does not grow in salt marshes. Does this appear to be due to salinity or competition Explain your answer.
Instructors : A version of this Scientific Skills Exercise can be assigned in MasteringBiology.
Unlock Deck
Unlock for access to all 17 flashcards in this deck.
Unlock Deck
k this deck
15
The oceans affect the biosphere in all of the following ways except
A) producing a substantial amount of the biosphere's oxygen.
B) removing carbon dioxide from the atmosphere.
C) moderating the climate of terrestrial biomes.
D) regulating the pH of freshwater biomes and terrestrial groundwater.
A) producing a substantial amount of the biosphere's oxygen.
B) removing carbon dioxide from the atmosphere.
C) moderating the climate of terrestrial biomes.
D) regulating the pH of freshwater biomes and terrestrial groundwater.
Unlock Deck
Unlock for access to all 17 flashcards in this deck.
Unlock Deck
k this deck
16
Which statement about dispersal is false
A) Dispersal is a common component of the life cycles of plants and animals.
B) Colonization of devastated areas after floods or volcanic eruptions depends on dispersal.
C) Dispersal occurs only on an evolutionary time scale.
D) The ability to disperse can expand the geographic distribution of a species.
Unlock Deck
Unlock for access to all 17 flashcards in this deck.
Unlock Deck
k this deck
17
When climbing a mountain, we can observe transitions in biological communities that are analogous to the changes
A) in biomes at different latitudes.
B) in different depths in the ocean.
C) in a community through different seasons.
D) in an ecosystem as it evolves over time.
A) in biomes at different latitudes.
B) in different depths in the ocean.
C) in a community through different seasons.
D) in an ecosystem as it evolves over time.
Unlock Deck
Unlock for access to all 17 flashcards in this deck.
Unlock Deck
k this deck
Unlock Deck
Unlock for access to all 17 flashcards in this deck.


