Deck 19: Implementing and Controlling Marketing Plans: Evolution and Revolution
Full screen (f)
Question
Question
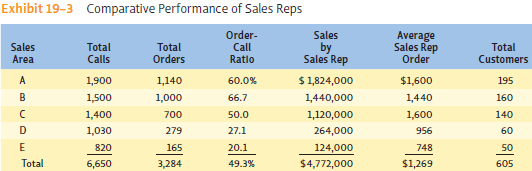
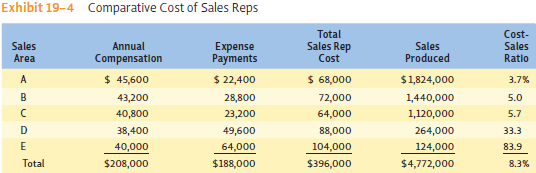
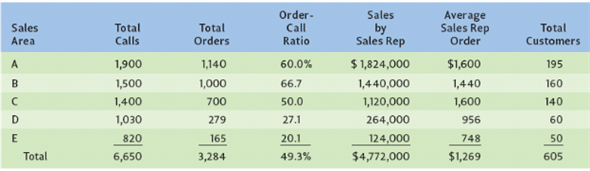
Explain the meaning of the comparative performance and comparative cost data in Exhibits 19-3 and 19-4. Why does it appear that eliminating sales areas D and E would be profitable?
Question
Question
Question
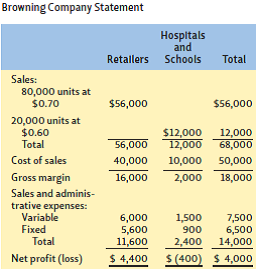
The June profit and loss statement for the Browning Company is shown. If competitive conditions make price increases impossible and management has cut costs as much as possible, should the Browning Company stop selling to hospitals and schools? Why?
Question
Question
Question
Question
Question
Question
Question
Question

Unlock Deck
Sign up to unlock the cards in this deck!
Unlock Deck
Unlock Deck
1/13
Play
Full screen (f)
Deck 19: Implementing and Controlling Marketing Plans: Evolution and Revolution
1
Carefully explain what the iceberg principle should mean to the marketing manager.
Iceberg principle:
Iceberg principle states that one should be cautious in making decision by considering the entire information of a context. The principle works based on 1/10 concept. It assumes that, in most of the decision-making cases, a small amount of information is available i.e. 1part of actual information. The remaining 10parts of the information is said to be hidden or unavailable.
The similar concept of iceberg principle is implemented in marketing context. Whenever a policy is formulated, a marketing manager must ensure to understand the exact problem, consider entire information, and should try to solve the issue. This is because, sometimes strategies are made just after understanding available information i.e. 1part of the actual information. By considering single part of information, one cannot formulate powerful strategy, and such an attempt would go wrong. Hence, the formulated strategy will not serve the purpose. It would be beneficial for a marketing manager to analyze the market, procure necessary information, and build a suitable strategy for his product to penetrate into the market.
For example, consider a scenario in which, a marketing manager is trying to deal with an issue related to downfall of sales. To solve this issue, he or she should not limit his/her efforts just to know about reasons for less sales. The manager should be able to consider other reasons, which had made the sales figure down. This attempt to know actual information will give rise to additional reasons. For example, changes in market environment such as increase in number of competitors, change in customers' perceptive, etc. By considering the entire information, the marketing manager will be able to build new strategies to increases sales of the products.
Thus, iceberg principle of decision-making helps a marketing manager to consider entire information of an issue to make a productive decision for a company.
2
Explain the meaning of the comparative performance and comparative cost data in Exhibits 19-3 and 19-4. Why does it appear that eliminating sales areas D and E would be profitable?
Comparative performance:
Comparative performance means analysis of relationship between two variables in the financial statement. For example, Comparing sales with profit.
Comparative cost data:
Comparative cost data means comparison of cost of the company with previous year costs. For example, comparing cost of current year with previous year.
Comparative performance of sales rep before elimination of D and E, and after elimination of D and E is shown below:
Before elimination.
 After elimination.
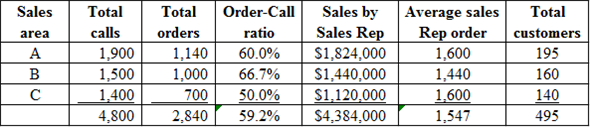 After eliminating the sales area of D and E the comparative performance of Sales Reps is higher. Order to calls ratio is increased by 9.9% (59.2 - 49.3). The average sales orders by sales rep shows the efficiency of sales rep for increase in average sales order 278 (1,549 - 1,269).
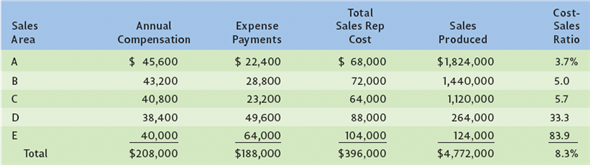
Comparative cost of sales Reps before eliminating sales area of D and E, and after elimination of sales area D and E is shown below:
Before elimination.
 After elimination.
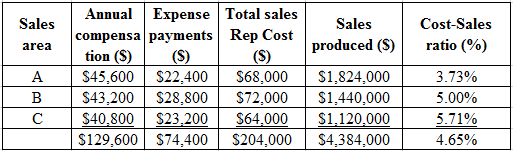 The total cost to sales ratio before elimination is 8.3%. After elimination of D and E total cost to sales ratio is 4.65%. The cost to sales ratio is decreased to 4.65%, this will increase the profit.
Comparative performance means analysis of relationship between two variables in the financial statement. For example, Comparing sales with profit.
Comparative cost data:
Comparative cost data means comparison of cost of the company with previous year costs. For example, comparing cost of current year with previous year.
Comparative performance of sales rep before elimination of D and E, and after elimination of D and E is shown below:
Before elimination.
After elimination. After eliminating the sales area of D and E the comparative performance of Sales Reps is higher. Order to calls ratio is increased by 9.9% (59.2 - 49.3). The average sales orders by sales rep shows the efficiency of sales rep for increase in average sales order 278 (1,549 - 1,269).Comparative cost of sales Reps before eliminating sales area of D and E, and after elimination of sales area D and E is shown below:
Before elimination.
After elimination. The total cost to sales ratio before elimination is 8.3%. After elimination of D and E total cost to sales ratio is 4.65%. The cost to sales ratio is decreased to 4.65%, this will increase the profit. 3
Most sales forecasting is subject to some error (perhaps 5 to 10 percent). Should we then expect variations in sales performance of 5 to 10 percent above or below quota? If so, how should we treat such variations in evaluating performance?
Performance analysis: this looks for exceptions for planned performance, normally in sales analysis the figures are listed in the records. In sales forecasting the figures compared with the standard figures. The comparison might be with one territory against the another or the performance of one year compared with the last year performance.
The sales forecasting will have some variations and errors of 5 to 10 percent from quotas they are usually expected. But the variation should not be ignored as it influences sales performance. Analysis of data may indicate why the errors in sales forecast occur and how the marketing mix might be adjusted to improve the situation.
If random variations occur in the sales forecasting figures it must be considered while evaluating the sales performance of the company. Without considering the variations or errors, the sales performance may become positive or negative, hence expected variations should not be ignored and they should be considered in evaluating the sales performance.
4
Why is there controversy between the advocates of the full-cost and the contribution-margin approaches to cost analysis?
Unlock Deck
Unlock for access to all 13 flashcards in this deck.
Unlock Deck
k this deck
5
The June profit and loss statement for the Browning Company is shown. If competitive conditions make price increases impossible and management has cut costs as much as possible, should the Browning Company stop selling to hospitals and schools? Why?
Unlock Deck
Unlock for access to all 13 flashcards in this deck.
Unlock Deck
k this deck
6
Explain why a marketing audit might be desirable, even in a well-run company. Who or what kind of an organization would be best to conduct a marketing audit? Would a marketing research firm be good? Would the present CPA firms be most suitable? Why?
Unlock Deck
Unlock for access to all 13 flashcards in this deck.
Unlock Deck
k this deck
7
MARKETING COST ANALYSIS
This problem emphasizes the differences between the fullcost approach and contribution-margin approach to marketing cost analysis.
Tapco, Inc., currently sells two products. Sales commissions and unit costs vary with the quantity of each product sold. With the full-cost approach, Tapco's administrative and advertising costs are allocated to each product based on its share of total sales dollars. Details of Tapco's costs and other data are given in the spreadsheet. The first column shows a cost analysis based on the full-cost approach. The second column shows an analysis based on the contribution-margin approach.
a. If the number of Product A units sold were to increase by 1,000 units, what would happen to the allocated administrative expense for Product A? How would the change in sales of Product A affect the allocated administrative expense for Product B? Briefly discuss why the changes you observe might cause conflict between the product managers of the two different products.
b. What would happen to total profits if Tapco stopped selling Product A but continued to sell 4,000 units of Product B? What happens to total profits if the firm stops selling Product B but continues to sell 5,000 units of Product A? (Hint: To stop selling a product means that the quantity sold would be zero.)
c. If the firm dropped Product B and increased the price of Product A by $2.00, what quantity of Product A would it have to sell to earn a total profit as large as it was originally earning with both products? (Hint: Change values in the spreadsheet to reflect the changes the firm is considering, and then use the What If analysis to vary the quantity of Product A sold and display what happens to total profit.)
Unlock Deck
Unlock for access to all 13 flashcards in this deck.
Unlock Deck
k this deck
8
The Marketing Plan Coach software on the text Web site includes a sample marketing plan for Hillside Veterinary Clinic. Look through the "Implementation" section.
a. Does the plan say anything about how Hillside will handle complaints? What could Hillside do in this area?
b. How could Hillside break down its sales and performance analysis? What type of analysis would you recommend? How could this be used to provide control for the marketing plan?
c. What type of cost analysis should Hillside do? How could this be used to provide control of the marketing plan?
Unlock Deck
Unlock for access to all 13 flashcards in this deck.
Unlock Deck
k this deck
9
Give an example of how a firm has used information technology to improve its marketing implementation and do a better job of meeting your needs.
Unlock Deck
Unlock for access to all 13 flashcards in this deck.
Unlock Deck
k this deck
10
Should marketing managers leave it to the accountants to develop reports that the marketing manager will use to improve implementation and control? Why or why not?
Unlock Deck
Unlock for access to all 13 flashcards in this deck.
Unlock Deck
k this deck
11
Give an example of a firm that has a competitive advantage because of the excellent job it does with implementation activities that directly impact customer satisfaction. Explain why you think your example is a good one.
Unlock Deck
Unlock for access to all 13 flashcards in this deck.
Unlock Deck
k this deck
12
Various breakdowns can be used for sales analysis depending on the nature of the company and its products. Describe a situation (one for each) where each of the following breakdowns would yield useful information. Explain why.
a. By geographic region.
b. By product.
c. By customer.
d. By size of order.
e. By size of sales rep commission on each product or product group.
a. By geographic region.
b. By product.
c. By customer.
d. By size of order.
e. By size of sales rep commission on each product or product group.
Unlock Deck
Unlock for access to all 13 flashcards in this deck.
Unlock Deck
k this deck
13
Distinguish between a sales analysis and a performance analysis.
Unlock Deck
Unlock for access to all 13 flashcards in this deck.
Unlock Deck
k this deck
Unlock Deck
Unlock for access to all 13 flashcards in this deck.


