Deck 7: Statistics and Probability
Full screen (f)
Question
There are approximately 300,000,000 people living in the United States. The circle graph in Figure given below, shows the breakdown of the U.S. population by ethnic origin. Approximately how many more people of Asian ethnic origin live in the United States than people of American Indian/Alaska Native Islander ethnic origin? 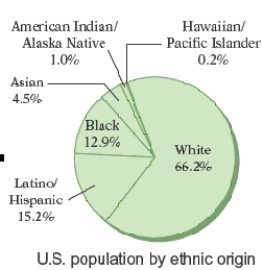
A) 10,600,000 more people
B) 10,400,000 more people
C) 10,700,000 more people
D) 10,500,000 more people
E) 10,300,000 more people
A) 10,600,000 more people
B) 10,400,000 more people
C) 10,700,000 more people
D) 10,500,000 more people
E) 10,300,000 more people
Question
An accounting major recorded the number of units required in each discipline to graduate with a degree in accounting. The results are shown in the circle graph below. What percent of the units required to graduate are taken in Humanities? Round your answer to one decimal place. 
A) 0.2
B) 1.2
C) 85.0
D) 15.0
E) 11.7
A) 0.2
B) 1.2
C) 85.0
D) 15.0
E) 11.7
Question
The circle graph shows the number of students enrolled in the various health programs offered at Southeastern Community College. Find the total number of students enrolled in health programs at Southeastern Community College. 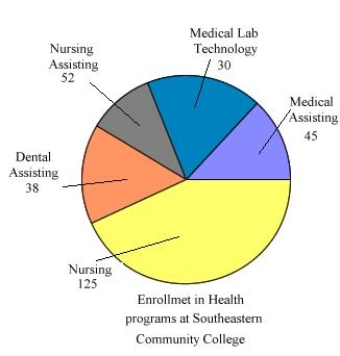
A) 300 students
B) 280 students
C) 290 students
D) 294 students
E) 286 students
A) 300 students
B) 280 students
C) 290 students
D) 294 students
E) 286 students
Question
Suppose that a typical household in the United States has an average after-tax income of $38,950. The circle graph below represents how this annual income is spent. (Note: It is because of rounding that the percents do not add up to 100%.) Approximately what amount is spent on clothing? 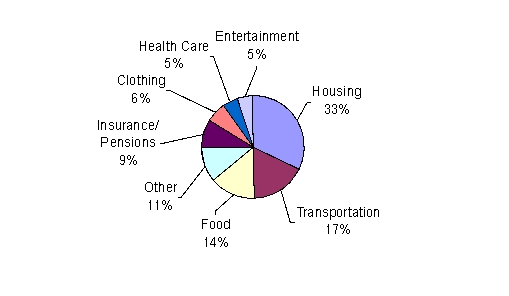
A) $233.70
B) $2337.00
C) $2.34
D) $36,613.00
E) $6491.67
A) $233.70
B) $2337.00
C) $2.34
D) $36,613.00
E) $6491.67
Question
An accounting major recorded the number of units required in each discipline to graduate with a degree in accounting. The results are shown in the circle graph below. What is the ratio of the number of units in Math to the number of units in Humanities? 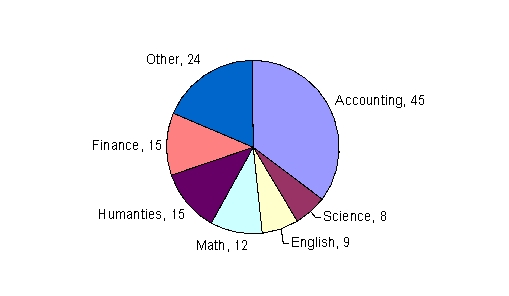
A)
B)
C)
D)
E)
A)
B)
C)
D)
E)
Question
A nursing student at a community college recorded the number of units required in each discipline to graduate with an Associate Degree Nursing. The results are shown in the circle graph. How many units are required to graduate with an Associate Degree Nursing? 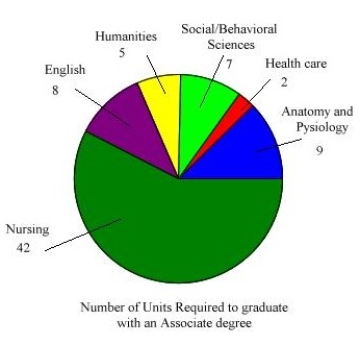
A) 74 units
B) 75 units
C) 72 units
D) 73 units
E) 71 units
A) 74 units
B) 75 units
C) 72 units
D) 73 units
E) 71 units
Question
The circle graph shows a breakdown, according to age, of the homeless in America. Use the graph. What percent of the homeless population is under the age of 54? 
A) 89
B) 88
C) 95
D) 92
E) 96
A) 89
B) 88
C) 95
D) 92
E) 96
Question
The circle graph shows the budget allocation for the Griner family's income. The annual family income is $125,000. Find the amount of money budgeted annually for vehicle and housing and utilities. 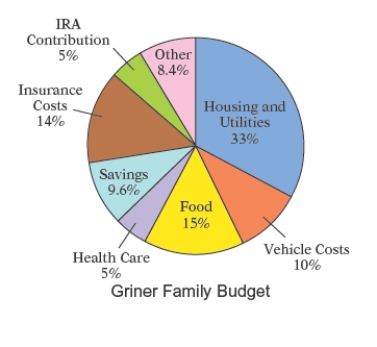
A) $53,850
B) $54,750
C) $52,750
D) $52,250
E) $53,750
A) $53,850
B) $54,750
C) $52,750
D) $52,250
E) $53,750
Question
Suppose that a typical household in the United States has an average after-tax income of $38,450. The circle graph below represents how this annual income is spent. (Note: It is because of rounding that the percents do not add up to 100 .) How much more is spent on food than on entertainment? 
A) $34.61
B) $3460.50
C) $3360.50
D) $346.05
E) $3560.50
A) $34.61
B) $3460.50
C) $3360.50
D) $346.05
E) $3560.50
Question
There are approximately 300,000,000 people living in the United States. The circle graph in figure given below, shows the breakdown of the U.S. population by ethnic origin. Approximately how many people living in the United States are of American Indian/Alaska Native ethnic origin? 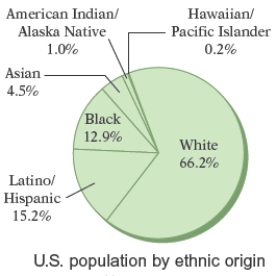
A) 2,998,000 people
B) 3,000,000 people
C) 3,001,000 people
D) 3,002,000 people
E) 2,999,000 people
A) 2,998,000 people
B) 3,000,000 people
C) 3,001,000 people
D) 3,002,000 people
E) 2,999,000 people
Question
The circle graph shows the budget allocation for the Griner family's income. The annual family income is $125,000. What fractional amount of the budget is designated for insurance costs? 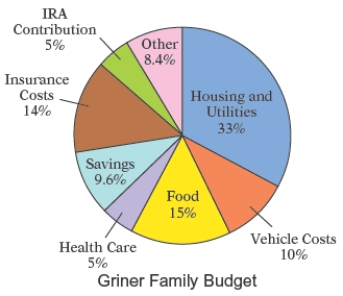
A)
B)
C)
D)
E)
A)
B)
C)
D)
E)
Question
The pictograph below shows the approximate gross revenues in the United States from four Walt Disney animated movies. Find the percent of the total gross revenue that was earned by The Lion King. Round your answer to two decimal places. 
A) 13.33
B) 26.67
C) 40.00
D) 20.00
E) 60.00
A) 13.33
B) 26.67
C) 40.00
D) 20.00
E) 60.00
Question
The circle graph shows the number of blood donors of the following blood type who participated in the previous blood drive at a community college. Use the following graph. What percent of donors had blood type A+? Round to the nearest tenth of a percent. 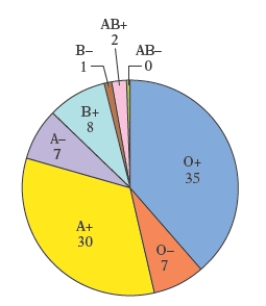
A) 30.1
B) 29.8
C) 33.3
D) 29.6
E) 30.3
A) 30.1
B) 29.8
C) 33.3
D) 29.6
E) 30.3
Question
The circle graph shows the number of students enrolled in the various health programs offered at Southeastern Community College. What percent of the students enrolled in health programs are enrolled in the medical assisting program? Round to the nearest tenth of a percent. 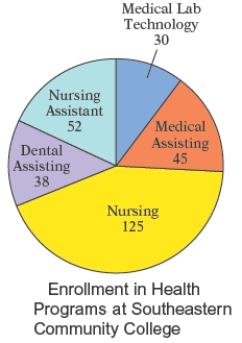
A) 14.5
B) 17.5
C) 13.5
D) 16.5
E) 15.5
A) 14.5
B) 17.5
C) 13.5
D) 16.5
E) 15.5
Question
The circle graph shows the number of blood donors of each blood type who participated in the previous blood drive at a community college. What is the ratio of donors with type A- blood to those with type O+ blood? 
A)
B)
C)
D)
E)
A)
B)
C)
D)
E)
Question
The circle graph shows the number of students enrolled in the various health programs offered at Southeastern Community College. How many more students are in the nursing assisting than in the medical assisting program? 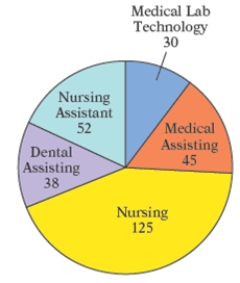
A) 6 students
B) 8 students
C) 9 students
D) 7 students
E) 10 students
A) 6 students
B) 8 students
C) 9 students
D) 7 students
E) 10 students
Question
The pictograph below shows the approximate gross revenues in the United States from four Walt Disney animated movies. Find the ratio of the gross revenue of Beauty and the Beast to the gross revenue of Aladdin. 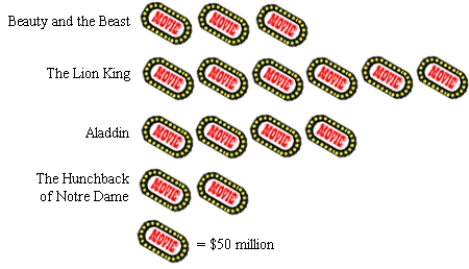
A)
B)
C)
D)
E)
A)
B)
C)
D)
E)
Question
The circle graph shows the number of students enrolled in the various health programs offered at Southeastern Community College. What percent of students enrolled in health programs are enrolled in the medical assisting program? Round to the nearest tenth of a percent. 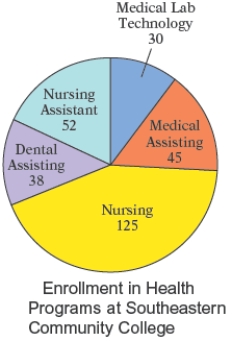
A) 19.5
B) 18.5
C) 15.5
D) 16.5
E) 14.5
A) 19.5
B) 18.5
C) 15.5
D) 16.5
E) 14.5
Question
The pictograph in the following figure gives typical hourly rates for these health care providers. Use the graph and find the ratio of the hourly rate for a Certified Dental Assistant to the hourly rate for a Certified Nurse Assistant. 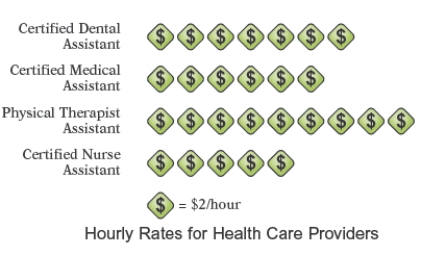
A) 7 to 5
B) 6 to 5
C) 7 to 9
D) 5 to 6
E) 5 to 3
A) 7 to 5
B) 6 to 5
C) 7 to 9
D) 5 to 6
E) 5 to 3
Question
The circle graph shows a breakdown, according to age, of the homeless in America. On average, how many of every 100,000 homeless people in America are over the age of 35? 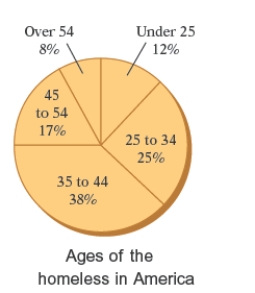
A) 62000 people
B) 63000 people
C) 64000 people
D) 65000 people
E) 61000 people
A) 62000 people
B) 63000 people
C) 64000 people
D) 65000 people
E) 61000 people
Question
The broken-line graph below shows the average monthly snowfall during ski season around Aspen, Colorado. During which month is the snowfall the least? 
A) April
B) January
C) November
D) October
E) March
A) April
B) January
C) November
D) October
E) March
Question
The double-bar graph below shows the fuel efficiency of four vehicles, as rated by the Environmental Protection Agency. They are among the most fuel-efficient 2003 model-year cars for city and highway mileage. Is the fuel efficiency of the Toyota Prius greater on the highway or in city driving? 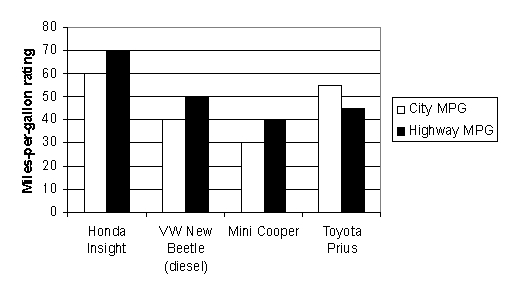
A) No difference
B) On the highway
C) In city driving
A) No difference
B) On the highway
C) In city driving
Question
The bar graph below shows the regions in which all the passenger cars were produced during a recent year. What percent of the passenger cars were produced in Western Europe? Round your answer to the nearest percent. 
A) 38
B) 28
C) 21
D) 8
E) 5
A) 38
B) 28
C) 21
D) 8
E) 5
Question
The bar graph below shows the regions in which all the passenger cars were produced during a recent year. What is the difference between the number of passenger cars produced in Western Europe and the number produced in Eastern Europe/Russia? 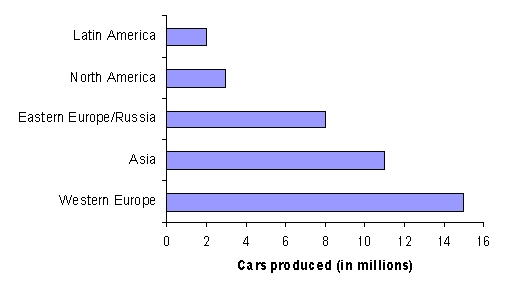
A) 9 million passenger cars
B) 23 million passenger cars
C) 7 million passenger cars
D) 11 million passenger cars
E) 24 million passenger cars
A) 9 million passenger cars
B) 23 million passenger cars
C) 7 million passenger cars
D) 11 million passenger cars
E) 24 million passenger cars
Question
The double-broken-line graph shows the number of Calories per day that should be consumed by women and men in various age groups. Use the following graph. What is the difference between the number of Calories recommended for men and the number recommended for women 11 to 14 years of age? 
A) 600 Calories
B) 500 Calories
C) 400 Calories
D) 700 Calories
E) 300 Calories
A) 600 Calories
B) 500 Calories
C) 400 Calories
D) 700 Calories
E) 300 Calories
Question
The double-bar graph below shows the fuel efficiency of four vehicles, as rated by the Environmental Protection Agency. They are among the most fuel-efficient 2003 model-year cars for city and highway mileage. Approximately how many more miles per gallon does the Toyota Prius get while traveling in the city than on the highway? 
A) No difference
B) Approximately 5 miles per gallon
C) Approximately 20 miles per gallon
D) Approximately 15 miles per gallon
E) Approximately 10 miles per gallon
A) No difference
B) Approximately 5 miles per gallon
C) Approximately 20 miles per gallon
D) Approximately 15 miles per gallon
E) Approximately 10 miles per gallon
Question
A nurse monitors the blood glucose levels of a patient during the patient's hospital stay. The broken-line graph given below shows the readings during the three-day period. Use this graph. What was the patient's blood sugar level at 7 A.M. on Monday? 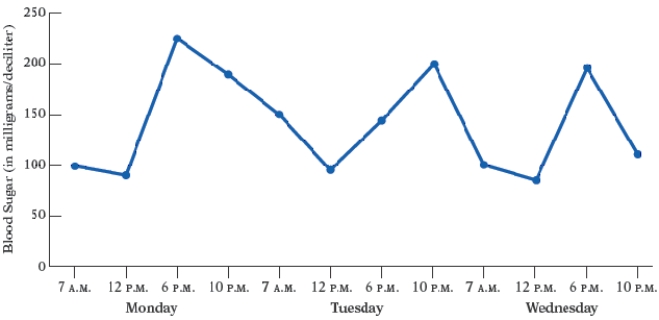
A) 150 milligrams/deciliter
B) 100 milligrams/deciliter
C) 200 milligrams/deciliter
D) 300 milligrams/deciliter
E) 50 milligrams/deciliter
A) 150 milligrams/deciliter
B) 100 milligrams/deciliter
C) 200 milligrams/deciliter
D) 300 milligrams/deciliter
E) 50 milligrams/deciliter
Question
A nurse monitors the blood glucose levels of a patient during the patient's hospital stay. The broken-line graph shows the readings during the three-day period. Use this graph. If a normal blood sugar reading is between 75 and 150 milligrams/deciliter, how many readings are outside the normal range? 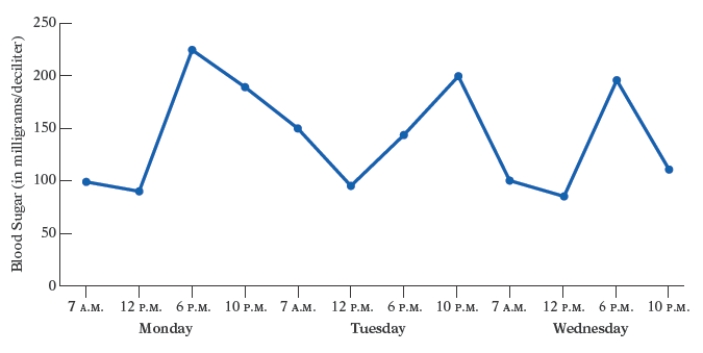
A) 9 readings
B) 5 readings
C) 3 readings
D) 8 readings
E) 4 readings
A) 9 readings
B) 5 readings
C) 3 readings
D) 8 readings
E) 4 readings
Question
The broken-line graph shows the percent of adults in the United States over 18 years old who took the influenza vaccine during recent years. Use the graph. What percent of U.S. adults aged 18 and older took the influenza vaccine in 2003? 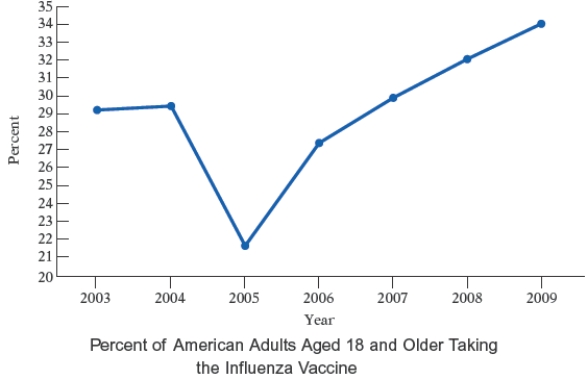
A) 29
B) 29.5
C) 28.5
D) 31
E) 27
A) 29
B) 29.5
C) 28.5
D) 31
E) 27
Question
The double-broken-line graph below shows the number of Calories per day that should be consumed by women and men in various age groups. Men should consume more Calories than women. What is the difference between the number of Calories recommended for men and the number recommended for women 19-22 years of age? 
A) 600 Calories
B) 500 Calories
C) 800 Calories
D) 1000 Calories
E) 1200 Calories
A) 600 Calories
B) 500 Calories
C) 800 Calories
D) 1000 Calories
E) 1200 Calories
Question
A nurse monitors the blood glucose levels of a patient during the patient's hospital stay. The broken-line graph shows the readings during the three-day period. Use this graph. What was the highest blood sugar reading recorded? When was it recorded? 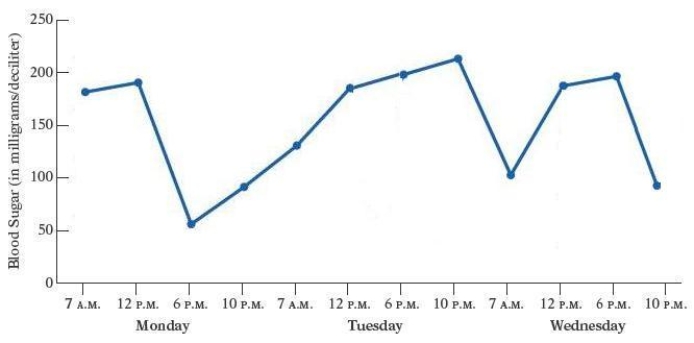
A) 215 milligrams/deciliter; Tuesday at 7 A.M.
B) 210 milligrams/deciliter; Wednesday at 12 P.M.
C) 210 milligrams/deciliter; Tuesday at 10 P.M.
D) 205 milligrams/deciliter; Monday at 10 P.M.
E) 220 milligrams/deciliter; Wednesday at 10 P.M.
A) 215 milligrams/deciliter; Tuesday at 7 A.M.
B) 210 milligrams/deciliter; Wednesday at 12 P.M.
C) 210 milligrams/deciliter; Tuesday at 10 P.M.
D) 205 milligrams/deciliter; Monday at 10 P.M.
E) 220 milligrams/deciliter; Wednesday at 10 P.M.
Question
The double-broken-line graph below shows the number of Calories per day that should be consumed by women and men in various age groups. Men should consume more Calories than women. People of what age and gender have the highest recommended number of Calories? 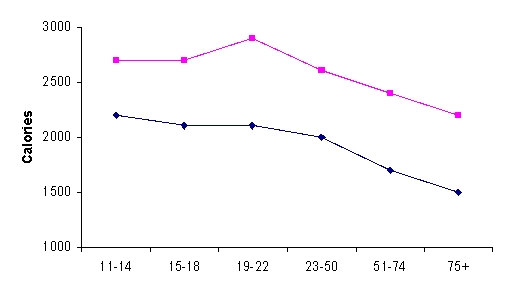
A) Women ages 19-22
B) Men ages 19-22
C) Men ages 75+
D) Women ages 75+
E) Women ages 11-14
A) Women ages 19-22
B) Men ages 19-22
C) Men ages 75+
D) Women ages 75+
E) Women ages 11-14
Question
The broken-line graph shows the percent of adults in the United States over 18 years old who took the influenza vaccine during recent years. Use the graph. What was the percent increase in U.S. adults aged 18 and older taking the influenza vaccine from 2006 to 2007? 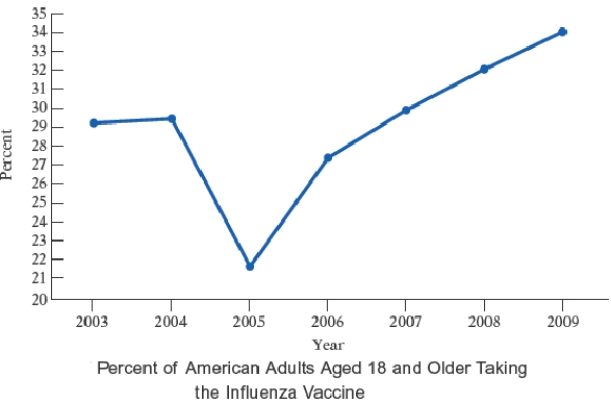
A) 2.5
B) 4
C) 3
D) 5
E) 6
A) 2.5
B) 4
C) 3
D) 5
E) 6
Question
The broken-line graph below shows the average monthly snowfall during ski season around Aspen, Colorado. What is the average snowfall during March? 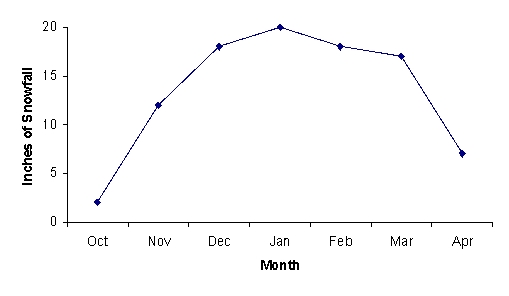
A) 15 inches
B) 19 inches
C) 17 inches
D) 20 inches
E) 16 inches
A) 15 inches
B) 19 inches
C) 17 inches
D) 20 inches
E) 16 inches
Question
A nurse monitors the blood glucose levels of a patient during the patient's hospital stay. The broken-line graph shows the readings during the three-day period. Use this graph. Find the difference between the blood sugar reading at 7 A.M. Monday and the reading at 7 A.M. Tuesday. 
A) 50 milligrams/deciliter
B) 60 milligrams/deciliter
C) 40 milligrams/deciliter
D) 70 milligrams/deciliter
E) 45 milligrams/deciliter
A) 50 milligrams/deciliter
B) 60 milligrams/deciliter
C) 40 milligrams/deciliter
D) 70 milligrams/deciliter
E) 45 milligrams/deciliter
Question
The broken-line graph shows the percent of adults in the United States over 18 years old who took the influenza vaccine during recent years. Use the graph Between what two consecutive years was there a decrease in the percent of U.S. adults aged 18 and older taking the influenza vaccine? 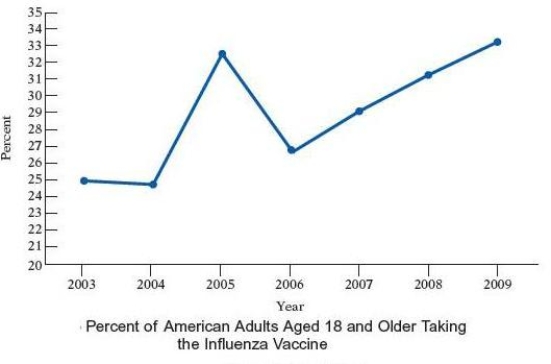
A) 2006 and 2007
B) 2005 and 2006
C) 2004 and 2005
D) 2004 and 2006
E) 2005 and 2007
A) 2006 and 2007
B) 2005 and 2006
C) 2004 and 2005
D) 2004 and 2006
E) 2005 and 2007
Question
The double-broken-line graph shows the number of Calories per day that should be consumed by women and men in various age groups. Use the following graph. People of what age and gender have the lowest recommended number of Calories? 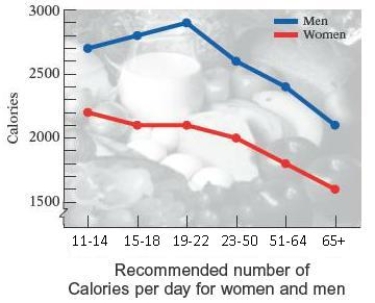
A) 70+ women
B) 75+ women
C) 60+ women
D) 65+ women
E) 80+ women
A) 70+ women
B) 75+ women
C) 60+ women
D) 65+ women
E) 80+ women
Question
The bar graph shows the increasing life expectancy of males in the United States from 1930 to 2010. Use this graph. How much greater is the life expectancy for American males in 2000 than it was in 1960? 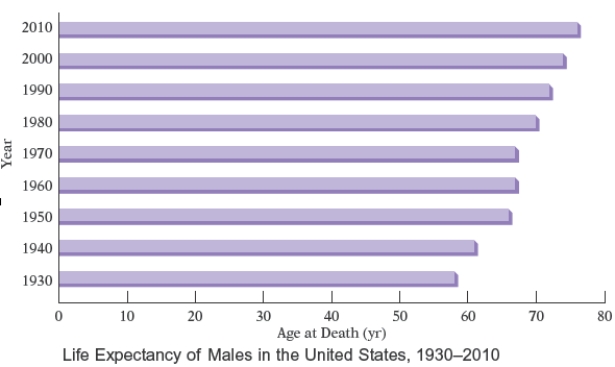
A) 6 years
B) 8 years
C) 7 years
D) 9 years
E) 5 years
A) 6 years
B) 8 years
C) 7 years
D) 9 years
E) 5 years
Question
The bar graph shows the increasing life expectancy of males in the United States from 1930 to 2010. Use this graph. In which of the years shown was the life expectancy of males in the United States approximately the same? 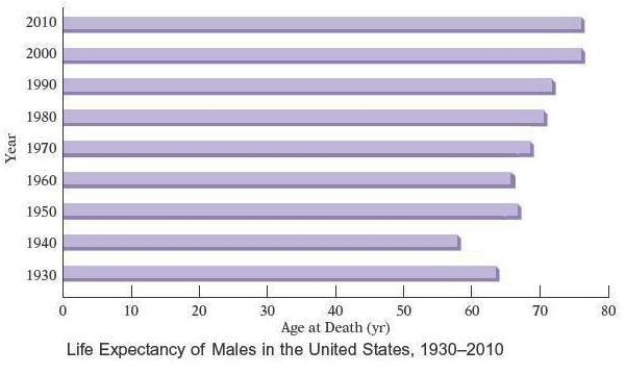
A) 2000 and 2010
B) 2010 and 2020
C) 1990 and 2000
D) 1980 and 2030
E) 2010 and 1990
A) 2000 and 2010
B) 2010 and 2020
C) 1990 and 2000
D) 1980 and 2030
E) 2010 and 1990
Question
The bar graph shows the increasing life expectancy of males in the United States from 1930 to 2010. Use this graph. Between what two decades shown on the graph did the life expectancy increase by approximately one years? 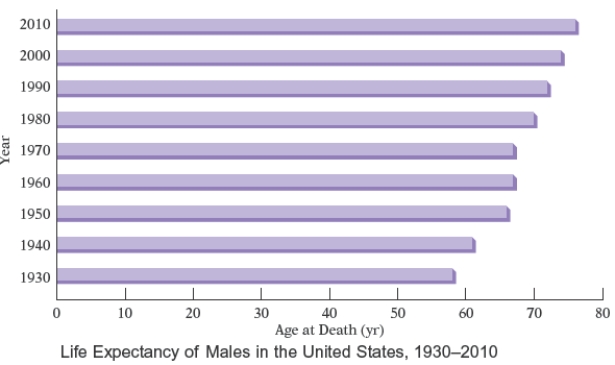
A) 1940 and 1960
B) 1940 and 1950
C) 1950 and 1960
D) 1960 and 1950
E) 1960 and 1970
A) 1940 and 1960
B) 1940 and 1950
C) 1950 and 1960
D) 1960 and 1950
E) 1960 and 1970
Question
Most health statistics list normal body temperature as 98.6°. A recent study of 30 healthy adults recorded their body temperatures at 8 A.M. and then displayed the results in the histogram in the following Figure. Use the Figure and find the percent of body temperatures that were higher than 98.5°. 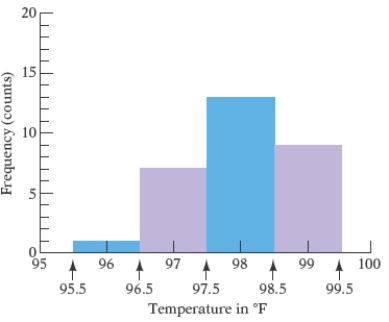
A) 29.5
B) 30.5
C) 28.5
D) 31.5
E) 30
A) 29.5
B) 30.5
C) 28.5
D) 31.5
E) 30
Question
The total cholesterol readings for 40 female patients seen this week at a doctor's office were recorded. Figure is a histogram of these data. Use the following figure. How many patients had total cholesterol readings between 500 and 600? 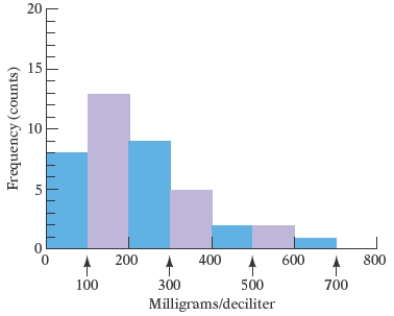
A) 4 patients
B) 3 patients
C) 2 patients
D) 5 patients
E) 6 patients
A) 4 patients
B) 3 patients
C) 2 patients
D) 5 patients
E) 6 patients
Question
The frequency polygon Figure shows the approximate numbers of runners in the 2008 Boston Marathon to finish in each of the given time slots (times are given in hours and minutes). Use the following figure. Find the approximate number of marathoners who finished with times of more than 3 hours. 
A) 20,900 marathoners
B) 21,000 marathoners
C) 21,100 marathoners
D) 21,200 marathoners
E) 20,800 marathoners
A) 20,900 marathoners
B) 21,000 marathoners
C) 21,100 marathoners
D) 21,200 marathoners
E) 20,800 marathoners
Question
The heights, in inches, of the women in a nursing class were recorded. The results are displayed in the frequency polygon in the Figure. Use the following figure. How many women are between 61 inches and 64 inches tall? 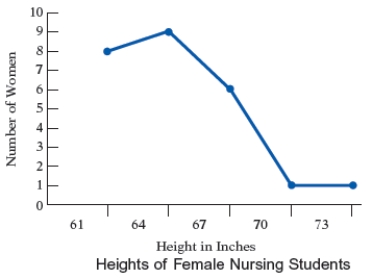
A) 11 women
B) 12 women
C) 9 women
D) 10 women
E) 8 women
A) 11 women
B) 12 women
C) 9 women
D) 10 women
E) 8 women
Question
Most health statistics list normal body temperature as 98.6°. A recent study of 30 healthy adults recorded their body temperatures at 8 A.M. and then displayed the results in the histogram given below. Use the figure. How many body temperatures were lower than 96.5°? 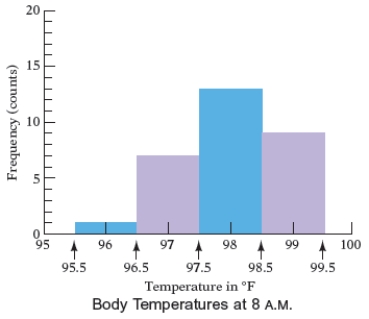
A) 2 temperatures
B) 3 temperatures
C) 0 temperatures
D) 4 temperatures
E) 1 temperatures
A) 2 temperatures
B) 3 temperatures
C) 0 temperatures
D) 4 temperatures
E) 1 temperatures
Question
Question
The frequency polygon in the below Figure shows the approximate numbers of runners in the 2008 Boston Marathon to finish in each of the given time slots (times are given in hours and minutes). Use the following figure. Determine the approximate number of runners who finished with times between 2 hours and 6 hours. 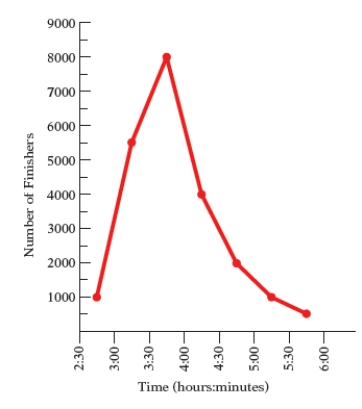
A) 23,000 runners
B) 22,000 runners
C) 21,000 runners
D) 24,000 runners
E) 20,000 runners
A) 23,000 runners
B) 22,000 runners
C) 21,000 runners
D) 24,000 runners
E) 20,000 runners
Question
The double-broken-line graph shows the number of Calories per day that should be consumed by women and men in various age groups. Use the following graph. Find the ratio of the number of Calories recommended for women 11 to 14 years old to the number recommended for women '23 to 50 years old. 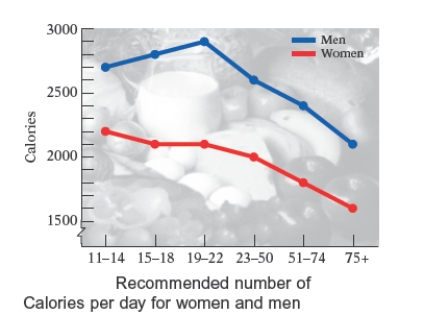
A)
B)
C)
D)
E)
A)
B)
C)
D)
E)
Question
The frequency polygon below shows the distances thrown by the entrants in the University and College Discus Finals at the 2003 Drake Relays. What percent of the entrants had distances between 160 and 170 feet? Round your answer to two decimal places. 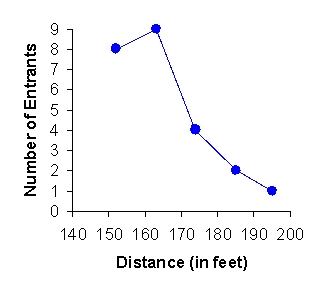
A) 8.33
B) 16.67
C) 37.50
D) 4.17
E) 0.00
A) 8.33
B) 16.67
C) 37.50
D) 4.17
E) 0.00
Question
The annual tuition for undergraduate college students attending 4-year institutions varies depending on the college. The histogram below shows the tuition amounts for a representative sample of 124 students from various parts of the United States. What percent of the total number of students spend less than $12,000 annually for tuition? Round your answer to two decimal places. 
A) 93.55
B) 85.48
C) 100.00
D) 33.87
E) 70.97
A) 93.55
B) 85.48
C) 100.00
D) 33.87
E) 70.97
Question
The annual tuition for undergraduate college students attending 4-year institutions varies depending on the college. The histogram below shows the tuition amounts for a representative sample of 124 students from various parts of the United States. How many students pay more than $6000 annually for tuition? 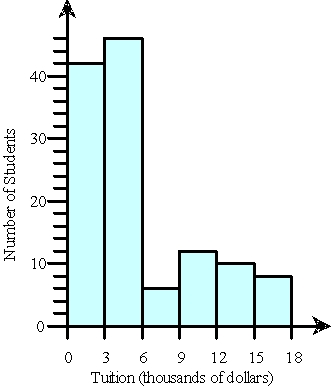
A) 36 students
B) 30 students
C) 18 students
D) 8 students
E) 0 students
A) 36 students
B) 30 students
C) 18 students
D) 8 students
E) 0 students
Question
The heights, in inches, of the women in a nursing class were recorded. The results are displayed in the frequency polygon in the Figure.Use the following figure. What percent of the women are taller than 64 inches? 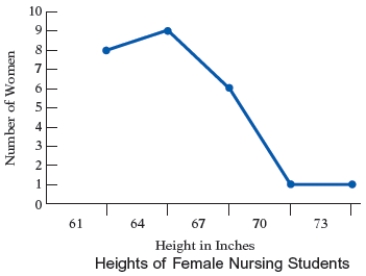
A) 69
B) 68
C) 70
D) 71
E) 67
A) 69
B) 68
C) 70
D) 71
E) 67
Question
The total cholesterol readings for 40 female patients seen this week at a doctor's office were recorded. Figure is a histogram of these data. Use the following figure.Total cholesterol readings lower than 200 are considered normal. How many patients had readings lower than 200? 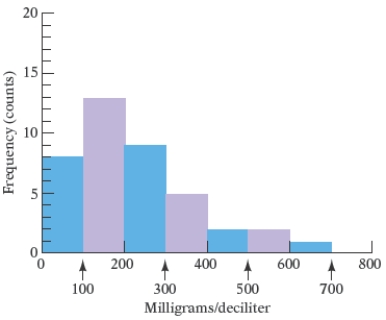
A) 25 patients
B) 24 patients
C) 23 patients
D) 22 patients
E) 21 patients
A) 25 patients
B) 24 patients
C) 23 patients
D) 22 patients
E) 21 patients
Question
The frequency polygon below shows the distances thrown by the entrants in the University and College Discus Finals at the 2003 Drake Relays. Find the number of entrants with distances of more than 150 feet. 
A) 3
B) 16
C) 7
D) 24
E) 1
A) 3
B) 16
C) 7
D) 24
E) 1
Question
Most health statistics list normal body temperature as 98.6°. A recent study of 30 healthy adults recorded their body temperatures at 8 A.M. and then displayed the results in the histogram in the following Figure. Use the Figure. Which class has the highest frequency? 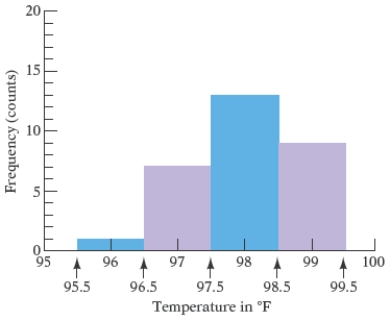
A) 96.5° to 98.5°
B) 97.5° to 98.5°
C) 96.5° to 97.5°
D) 98.5° to 99.5°
E) 95.5° to 97.5°
A) 96.5° to 98.5°
B) 97.5° to 98.5°
C) 96.5° to 97.5°
D) 98.5° to 99.5°
E) 95.5° to 97.5°
Question
The total cholesterol readings for 40 female patients seen this week at a doctor's office were recorded. Figure is a histogram of these data. Use the following figure.If a patient has a total cholesterol reading higher than 300, a doctor may prescribe a cholesterol-lowering medication as well as a change in diet. What percent of these patients had total cholesterol readings higher than 400? 
A) 12.5%
B) 14%
C) 14.5%
D) 11%
E) 11.5%
A) 12.5%
B) 14%
C) 14.5%
D) 11%
E) 11.5%
Question
The annual tuition for undergraduate college students attending 4-year institutions varies depending on the college. The histogram below shows the tuition amounts for a representative sample of 124 students from various parts of the United States. How many students have a tuition that is between $12,000 and $15,000 per year? 
A) 10 students
B) 8 students
C) 42 students
D) 46 students
E) 6 students
A) 10 students
B) 8 students
C) 42 students
D) 46 students
E) 6 students
Question
The frequency polygon in Figure shows the distribution of scores of the approximately 1,548,000 students who took the SAT Math exam in 2010. Use the following figure Approximately how many students scored lower than 700? 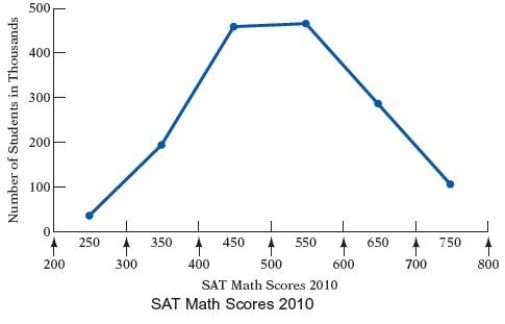
A) Approximately 691,000 students
B) Approximately 689,000 students
C) Approximately 688,500 students
D) Approximately 691,500 students
E) Approximately 690,000 students
A) Approximately 691,000 students
B) Approximately 689,000 students
C) Approximately 688,500 students
D) Approximately 691,500 students
E) Approximately 690,000 students
Question
The frequency polygon in Figure shows the distribution of scores of the approximately 1,548,000 students who took the SAT Math exam in 2010. Use the following figure Approximately how many students scored between 200 and 300 on the SAT Math exam? 
A) Approximately 31,000 students
B) Approximately 30,000 students
C) Approximately 29,000 students
D) Approximately 31,500 students
E) Approximately 28,500 students
A) Approximately 31,000 students
B) Approximately 30,000 students
C) Approximately 29,000 students
D) Approximately 31,500 students
E) Approximately 28,500 students
Question
Question
Question
Question
Question
Question
Question
The cholesterol levels for 100 adults were recorded and then displayed in the box-and-whiskers plot shown below.
a. How many adults had a cholestorol level above 212?
b. How many adults had a cholestorol level below 249?
c. How many cholestorol levels are represented in each quartile?
d. What percent of the adults had a cholestorol level of not more than 193?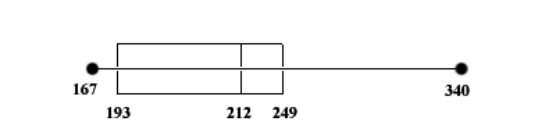
A) (a) 50 adults; (b) 75 adults; (c) 25 cholestorol levels; (d) 25
B) (a) 50 adults; (b) 25 adults; (c) 75 cholestorol levels; (d) 75
C) (a) 25 adults; (b) 75 adults; (c) 50 cholestorol levels; (d) 75
D) (a) 25 adults; (b) 75 adults; (c) 50 cholestorol levels; (d) 25
E) None of the above
Question
Question
Question
Question
Question
Question
Question
The box-and-whiskers plot below shows the distribution of median incomes for 50 towns. What is the lowest value in the set of data? The highest value? The first quartile? The third quartile? The median? Find the range and the interquartile range. 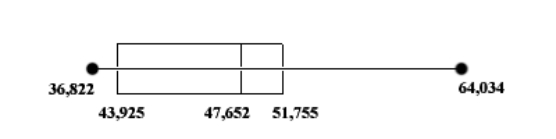
A) Lowest = $36,822; highest = $64,034; Q1 = $51,755; Q3 = $43,925; median = $47,652; range = $27,212; interquartile range = $7830
B) Lowest = $36,822; highest = $64,034; Q1 = $43,925; Q3 = $51,755; median = $47,652; range = $7830; interquartile range = $27,212
C) Lowest = $36,822; highest = $64,034; Q1 = $43,925; Q3 = $51,755; median = $47,652; range = $27,212; interquartile range = $7830
D) Lowest = $36,822; highest = $64,034; Q1 = $51,755; Q3 = $43,925; median = $47,652; range = $7830; interquartile range = $27,212
E) None of the above
Question
Question
Question
Question
Question
Question
Question

Unlock Deck
Sign up to unlock the cards in this deck!
Unlock Deck
Unlock Deck
1/84
Play
Full screen (f)
Deck 7: Statistics and Probability
1
There are approximately 300,000,000 people living in the United States. The circle graph in Figure given below, shows the breakdown of the U.S. population by ethnic origin. Approximately how many more people of Asian ethnic origin live in the United States than people of American Indian/Alaska Native Islander ethnic origin?
A) 10,600,000 more people
B) 10,400,000 more people
C) 10,700,000 more people
D) 10,500,000 more people
E) 10,300,000 more people
A) 10,600,000 more people
B) 10,400,000 more people
C) 10,700,000 more people
D) 10,500,000 more people
E) 10,300,000 more people
10,500,000 more people
2
An accounting major recorded the number of units required in each discipline to graduate with a degree in accounting. The results are shown in the circle graph below. What percent of the units required to graduate are taken in Humanities? Round your answer to one decimal place.
A) 0.2
B) 1.2
C) 85.0
D) 15.0
E) 11.7
A) 0.2
B) 1.2
C) 85.0
D) 15.0
E) 11.7
11.7
3
The circle graph shows the number of students enrolled in the various health programs offered at Southeastern Community College. Find the total number of students enrolled in health programs at Southeastern Community College.
A) 300 students
B) 280 students
C) 290 students
D) 294 students
E) 286 students
A) 300 students
B) 280 students
C) 290 students
D) 294 students
E) 286 students
290 students
4
Suppose that a typical household in the United States has an average after-tax income of $38,950. The circle graph below represents how this annual income is spent. (Note: It is because of rounding that the percents do not add up to 100%.) Approximately what amount is spent on clothing?
A) $233.70
B) $2337.00
C) $2.34
D) $36,613.00
E) $6491.67
A) $233.70
B) $2337.00
C) $2.34
D) $36,613.00
E) $6491.67
Unlock Deck
Unlock for access to all 84 flashcards in this deck.
Unlock Deck
k this deck
5
An accounting major recorded the number of units required in each discipline to graduate with a degree in accounting. The results are shown in the circle graph below. What is the ratio of the number of units in Math to the number of units in Humanities?
A)
B)
C)
D)
E)
A)
B)
C)
D)
E)
Unlock Deck
Unlock for access to all 84 flashcards in this deck.
Unlock Deck
k this deck
6
A nursing student at a community college recorded the number of units required in each discipline to graduate with an Associate Degree Nursing. The results are shown in the circle graph. How many units are required to graduate with an Associate Degree Nursing?
A) 74 units
B) 75 units
C) 72 units
D) 73 units
E) 71 units
A) 74 units
B) 75 units
C) 72 units
D) 73 units
E) 71 units
Unlock Deck
Unlock for access to all 84 flashcards in this deck.
Unlock Deck
k this deck
7
The circle graph shows a breakdown, according to age, of the homeless in America. Use the graph. What percent of the homeless population is under the age of 54?
A) 89
B) 88
C) 95
D) 92
E) 96
A) 89
B) 88
C) 95
D) 92
E) 96
Unlock Deck
Unlock for access to all 84 flashcards in this deck.
Unlock Deck
k this deck
8
The circle graph shows the budget allocation for the Griner family's income. The annual family income is $125,000. Find the amount of money budgeted annually for vehicle and housing and utilities.
A) $53,850
B) $54,750
C) $52,750
D) $52,250
E) $53,750
A) $53,850
B) $54,750
C) $52,750
D) $52,250
E) $53,750
Unlock Deck
Unlock for access to all 84 flashcards in this deck.
Unlock Deck
k this deck
9
Suppose that a typical household in the United States has an average after-tax income of $38,450. The circle graph below represents how this annual income is spent. (Note: It is because of rounding that the percents do not add up to 100 .) How much more is spent on food than on entertainment?
A) $34.61
B) $3460.50
C) $3360.50
D) $346.05
E) $3560.50
A) $34.61
B) $3460.50
C) $3360.50
D) $346.05
E) $3560.50
Unlock Deck
Unlock for access to all 84 flashcards in this deck.
Unlock Deck
k this deck
10
There are approximately 300,000,000 people living in the United States. The circle graph in figure given below, shows the breakdown of the U.S. population by ethnic origin. Approximately how many people living in the United States are of American Indian/Alaska Native ethnic origin?
A) 2,998,000 people
B) 3,000,000 people
C) 3,001,000 people
D) 3,002,000 people
E) 2,999,000 people
A) 2,998,000 people
B) 3,000,000 people
C) 3,001,000 people
D) 3,002,000 people
E) 2,999,000 people
Unlock Deck
Unlock for access to all 84 flashcards in this deck.
Unlock Deck
k this deck
11
The circle graph shows the budget allocation for the Griner family's income. The annual family income is $125,000. What fractional amount of the budget is designated for insurance costs?
A)
B)
C)
D)
E)
A)
B)
C)
D)
E)
Unlock Deck
Unlock for access to all 84 flashcards in this deck.
Unlock Deck
k this deck
12
The pictograph below shows the approximate gross revenues in the United States from four Walt Disney animated movies. Find the percent of the total gross revenue that was earned by The Lion King. Round your answer to two decimal places.
A) 13.33
B) 26.67
C) 40.00
D) 20.00
E) 60.00
A) 13.33
B) 26.67
C) 40.00
D) 20.00
E) 60.00
Unlock Deck
Unlock for access to all 84 flashcards in this deck.
Unlock Deck
k this deck
13
The circle graph shows the number of blood donors of the following blood type who participated in the previous blood drive at a community college. Use the following graph. What percent of donors had blood type A+? Round to the nearest tenth of a percent.
A) 30.1
B) 29.8
C) 33.3
D) 29.6
E) 30.3
A) 30.1
B) 29.8
C) 33.3
D) 29.6
E) 30.3
Unlock Deck
Unlock for access to all 84 flashcards in this deck.
Unlock Deck
k this deck
14
The circle graph shows the number of students enrolled in the various health programs offered at Southeastern Community College. What percent of the students enrolled in health programs are enrolled in the medical assisting program? Round to the nearest tenth of a percent.
A) 14.5
B) 17.5
C) 13.5
D) 16.5
E) 15.5
A) 14.5
B) 17.5
C) 13.5
D) 16.5
E) 15.5
Unlock Deck
Unlock for access to all 84 flashcards in this deck.
Unlock Deck
k this deck
15
The circle graph shows the number of blood donors of each blood type who participated in the previous blood drive at a community college. What is the ratio of donors with type A- blood to those with type O+ blood?
A)
B)
C)
D)
E)
A)
B)
C)
D)
E)
Unlock Deck
Unlock for access to all 84 flashcards in this deck.
Unlock Deck
k this deck
16
The circle graph shows the number of students enrolled in the various health programs offered at Southeastern Community College. How many more students are in the nursing assisting than in the medical assisting program?
A) 6 students
B) 8 students
C) 9 students
D) 7 students
E) 10 students
A) 6 students
B) 8 students
C) 9 students
D) 7 students
E) 10 students
Unlock Deck
Unlock for access to all 84 flashcards in this deck.
Unlock Deck
k this deck
17
The pictograph below shows the approximate gross revenues in the United States from four Walt Disney animated movies. Find the ratio of the gross revenue of Beauty and the Beast to the gross revenue of Aladdin.
A)
B)
C)
D)
E)
A)
B)
C)
D)
E)
Unlock Deck
Unlock for access to all 84 flashcards in this deck.
Unlock Deck
k this deck
18
The circle graph shows the number of students enrolled in the various health programs offered at Southeastern Community College. What percent of students enrolled in health programs are enrolled in the medical assisting program? Round to the nearest tenth of a percent.
A) 19.5
B) 18.5
C) 15.5
D) 16.5
E) 14.5
A) 19.5
B) 18.5
C) 15.5
D) 16.5
E) 14.5
Unlock Deck
Unlock for access to all 84 flashcards in this deck.
Unlock Deck
k this deck
19
The pictograph in the following figure gives typical hourly rates for these health care providers. Use the graph and find the ratio of the hourly rate for a Certified Dental Assistant to the hourly rate for a Certified Nurse Assistant.
A) 7 to 5
B) 6 to 5
C) 7 to 9
D) 5 to 6
E) 5 to 3
A) 7 to 5
B) 6 to 5
C) 7 to 9
D) 5 to 6
E) 5 to 3
Unlock Deck
Unlock for access to all 84 flashcards in this deck.
Unlock Deck
k this deck
20
The circle graph shows a breakdown, according to age, of the homeless in America. On average, how many of every 100,000 homeless people in America are over the age of 35?
A) 62000 people
B) 63000 people
C) 64000 people
D) 65000 people
E) 61000 people
A) 62000 people
B) 63000 people
C) 64000 people
D) 65000 people
E) 61000 people
Unlock Deck
Unlock for access to all 84 flashcards in this deck.
Unlock Deck
k this deck
21
The broken-line graph below shows the average monthly snowfall during ski season around Aspen, Colorado. During which month is the snowfall the least?
A) April
B) January
C) November
D) October
E) March
A) April
B) January
C) November
D) October
E) March
Unlock Deck
Unlock for access to all 84 flashcards in this deck.
Unlock Deck
k this deck
22
The double-bar graph below shows the fuel efficiency of four vehicles, as rated by the Environmental Protection Agency. They are among the most fuel-efficient 2003 model-year cars for city and highway mileage. Is the fuel efficiency of the Toyota Prius greater on the highway or in city driving?
A) No difference
B) On the highway
C) In city driving
A) No difference
B) On the highway
C) In city driving
Unlock Deck
Unlock for access to all 84 flashcards in this deck.
Unlock Deck
k this deck
23
The bar graph below shows the regions in which all the passenger cars were produced during a recent year. What percent of the passenger cars were produced in Western Europe? Round your answer to the nearest percent.
A) 38
B) 28
C) 21
D) 8
E) 5
A) 38
B) 28
C) 21
D) 8
E) 5
Unlock Deck
Unlock for access to all 84 flashcards in this deck.
Unlock Deck
k this deck
24
The bar graph below shows the regions in which all the passenger cars were produced during a recent year. What is the difference between the number of passenger cars produced in Western Europe and the number produced in Eastern Europe/Russia?
A) 9 million passenger cars
B) 23 million passenger cars
C) 7 million passenger cars
D) 11 million passenger cars
E) 24 million passenger cars
A) 9 million passenger cars
B) 23 million passenger cars
C) 7 million passenger cars
D) 11 million passenger cars
E) 24 million passenger cars
Unlock Deck
Unlock for access to all 84 flashcards in this deck.
Unlock Deck
k this deck
25
The double-broken-line graph shows the number of Calories per day that should be consumed by women and men in various age groups. Use the following graph. What is the difference between the number of Calories recommended for men and the number recommended for women 11 to 14 years of age?
A) 600 Calories
B) 500 Calories
C) 400 Calories
D) 700 Calories
E) 300 Calories
A) 600 Calories
B) 500 Calories
C) 400 Calories
D) 700 Calories
E) 300 Calories
Unlock Deck
Unlock for access to all 84 flashcards in this deck.
Unlock Deck
k this deck
26
The double-bar graph below shows the fuel efficiency of four vehicles, as rated by the Environmental Protection Agency. They are among the most fuel-efficient 2003 model-year cars for city and highway mileage. Approximately how many more miles per gallon does the Toyota Prius get while traveling in the city than on the highway?
A) No difference
B) Approximately 5 miles per gallon
C) Approximately 20 miles per gallon
D) Approximately 15 miles per gallon
E) Approximately 10 miles per gallon
A) No difference
B) Approximately 5 miles per gallon
C) Approximately 20 miles per gallon
D) Approximately 15 miles per gallon
E) Approximately 10 miles per gallon
Unlock Deck
Unlock for access to all 84 flashcards in this deck.
Unlock Deck
k this deck
27
A nurse monitors the blood glucose levels of a patient during the patient's hospital stay. The broken-line graph given below shows the readings during the three-day period. Use this graph. What was the patient's blood sugar level at 7 A.M. on Monday?
A) 150 milligrams/deciliter
B) 100 milligrams/deciliter
C) 200 milligrams/deciliter
D) 300 milligrams/deciliter
E) 50 milligrams/deciliter
A) 150 milligrams/deciliter
B) 100 milligrams/deciliter
C) 200 milligrams/deciliter
D) 300 milligrams/deciliter
E) 50 milligrams/deciliter
Unlock Deck
Unlock for access to all 84 flashcards in this deck.
Unlock Deck
k this deck
28
A nurse monitors the blood glucose levels of a patient during the patient's hospital stay. The broken-line graph shows the readings during the three-day period. Use this graph. If a normal blood sugar reading is between 75 and 150 milligrams/deciliter, how many readings are outside the normal range?
A) 9 readings
B) 5 readings
C) 3 readings
D) 8 readings
E) 4 readings
A) 9 readings
B) 5 readings
C) 3 readings
D) 8 readings
E) 4 readings
Unlock Deck
Unlock for access to all 84 flashcards in this deck.
Unlock Deck
k this deck
29
The broken-line graph shows the percent of adults in the United States over 18 years old who took the influenza vaccine during recent years. Use the graph. What percent of U.S. adults aged 18 and older took the influenza vaccine in 2003?
A) 29
B) 29.5
C) 28.5
D) 31
E) 27
A) 29
B) 29.5
C) 28.5
D) 31
E) 27
Unlock Deck
Unlock for access to all 84 flashcards in this deck.
Unlock Deck
k this deck
30
The double-broken-line graph below shows the number of Calories per day that should be consumed by women and men in various age groups. Men should consume more Calories than women. What is the difference between the number of Calories recommended for men and the number recommended for women 19-22 years of age?
A) 600 Calories
B) 500 Calories
C) 800 Calories
D) 1000 Calories
E) 1200 Calories
A) 600 Calories
B) 500 Calories
C) 800 Calories
D) 1000 Calories
E) 1200 Calories
Unlock Deck
Unlock for access to all 84 flashcards in this deck.
Unlock Deck
k this deck
31
A nurse monitors the blood glucose levels of a patient during the patient's hospital stay. The broken-line graph shows the readings during the three-day period. Use this graph. What was the highest blood sugar reading recorded? When was it recorded?
A) 215 milligrams/deciliter; Tuesday at 7 A.M.
B) 210 milligrams/deciliter; Wednesday at 12 P.M.
C) 210 milligrams/deciliter; Tuesday at 10 P.M.
D) 205 milligrams/deciliter; Monday at 10 P.M.
E) 220 milligrams/deciliter; Wednesday at 10 P.M.
A) 215 milligrams/deciliter; Tuesday at 7 A.M.
B) 210 milligrams/deciliter; Wednesday at 12 P.M.
C) 210 milligrams/deciliter; Tuesday at 10 P.M.
D) 205 milligrams/deciliter; Monday at 10 P.M.
E) 220 milligrams/deciliter; Wednesday at 10 P.M.
Unlock Deck
Unlock for access to all 84 flashcards in this deck.
Unlock Deck
k this deck
32
The double-broken-line graph below shows the number of Calories per day that should be consumed by women and men in various age groups. Men should consume more Calories than women. People of what age and gender have the highest recommended number of Calories?
A) Women ages 19-22
B) Men ages 19-22
C) Men ages 75+
D) Women ages 75+
E) Women ages 11-14
A) Women ages 19-22
B) Men ages 19-22
C) Men ages 75+
D) Women ages 75+
E) Women ages 11-14
Unlock Deck
Unlock for access to all 84 flashcards in this deck.
Unlock Deck
k this deck
33
The broken-line graph shows the percent of adults in the United States over 18 years old who took the influenza vaccine during recent years. Use the graph. What was the percent increase in U.S. adults aged 18 and older taking the influenza vaccine from 2006 to 2007?
A) 2.5
B) 4
C) 3
D) 5
E) 6
A) 2.5
B) 4
C) 3
D) 5
E) 6
Unlock Deck
Unlock for access to all 84 flashcards in this deck.
Unlock Deck
k this deck
34
The broken-line graph below shows the average monthly snowfall during ski season around Aspen, Colorado. What is the average snowfall during March?
A) 15 inches
B) 19 inches
C) 17 inches
D) 20 inches
E) 16 inches
A) 15 inches
B) 19 inches
C) 17 inches
D) 20 inches
E) 16 inches
Unlock Deck
Unlock for access to all 84 flashcards in this deck.
Unlock Deck
k this deck
35
A nurse monitors the blood glucose levels of a patient during the patient's hospital stay. The broken-line graph shows the readings during the three-day period. Use this graph. Find the difference between the blood sugar reading at 7 A.M. Monday and the reading at 7 A.M. Tuesday.
A) 50 milligrams/deciliter
B) 60 milligrams/deciliter
C) 40 milligrams/deciliter
D) 70 milligrams/deciliter
E) 45 milligrams/deciliter
A) 50 milligrams/deciliter
B) 60 milligrams/deciliter
C) 40 milligrams/deciliter
D) 70 milligrams/deciliter
E) 45 milligrams/deciliter
Unlock Deck
Unlock for access to all 84 flashcards in this deck.
Unlock Deck
k this deck
36
The broken-line graph shows the percent of adults in the United States over 18 years old who took the influenza vaccine during recent years. Use the graph Between what two consecutive years was there a decrease in the percent of U.S. adults aged 18 and older taking the influenza vaccine?
A) 2006 and 2007
B) 2005 and 2006
C) 2004 and 2005
D) 2004 and 2006
E) 2005 and 2007
A) 2006 and 2007
B) 2005 and 2006
C) 2004 and 2005
D) 2004 and 2006
E) 2005 and 2007
Unlock Deck
Unlock for access to all 84 flashcards in this deck.
Unlock Deck
k this deck
37
The double-broken-line graph shows the number of Calories per day that should be consumed by women and men in various age groups. Use the following graph. People of what age and gender have the lowest recommended number of Calories?
A) 70+ women
B) 75+ women
C) 60+ women
D) 65+ women
E) 80+ women
A) 70+ women
B) 75+ women
C) 60+ women
D) 65+ women
E) 80+ women
Unlock Deck
Unlock for access to all 84 flashcards in this deck.
Unlock Deck
k this deck
38
The bar graph shows the increasing life expectancy of males in the United States from 1930 to 2010. Use this graph. How much greater is the life expectancy for American males in 2000 than it was in 1960?
A) 6 years
B) 8 years
C) 7 years
D) 9 years
E) 5 years
A) 6 years
B) 8 years
C) 7 years
D) 9 years
E) 5 years
Unlock Deck
Unlock for access to all 84 flashcards in this deck.
Unlock Deck
k this deck
39
The bar graph shows the increasing life expectancy of males in the United States from 1930 to 2010. Use this graph. In which of the years shown was the life expectancy of males in the United States approximately the same?
A) 2000 and 2010
B) 2010 and 2020
C) 1990 and 2000
D) 1980 and 2030
E) 2010 and 1990
A) 2000 and 2010
B) 2010 and 2020
C) 1990 and 2000
D) 1980 and 2030
E) 2010 and 1990
Unlock Deck
Unlock for access to all 84 flashcards in this deck.
Unlock Deck
k this deck
40
The bar graph shows the increasing life expectancy of males in the United States from 1930 to 2010. Use this graph. Between what two decades shown on the graph did the life expectancy increase by approximately one years?
A) 1940 and 1960
B) 1940 and 1950
C) 1950 and 1960
D) 1960 and 1950
E) 1960 and 1970
A) 1940 and 1960
B) 1940 and 1950
C) 1950 and 1960
D) 1960 and 1950
E) 1960 and 1970
Unlock Deck
Unlock for access to all 84 flashcards in this deck.
Unlock Deck
k this deck
41
Most health statistics list normal body temperature as 98.6°. A recent study of 30 healthy adults recorded their body temperatures at 8 A.M. and then displayed the results in the histogram in the following Figure. Use the Figure and find the percent of body temperatures that were higher than 98.5°.
A) 29.5
B) 30.5
C) 28.5
D) 31.5
E) 30
A) 29.5
B) 30.5
C) 28.5
D) 31.5
E) 30
Unlock Deck
Unlock for access to all 84 flashcards in this deck.
Unlock Deck
k this deck
42
The total cholesterol readings for 40 female patients seen this week at a doctor's office were recorded. Figure is a histogram of these data. Use the following figure. How many patients had total cholesterol readings between 500 and 600?
A) 4 patients
B) 3 patients
C) 2 patients
D) 5 patients
E) 6 patients
A) 4 patients
B) 3 patients
C) 2 patients
D) 5 patients
E) 6 patients
Unlock Deck
Unlock for access to all 84 flashcards in this deck.
Unlock Deck
k this deck
43
The frequency polygon Figure shows the approximate numbers of runners in the 2008 Boston Marathon to finish in each of the given time slots (times are given in hours and minutes). Use the following figure. Find the approximate number of marathoners who finished with times of more than 3 hours.
A) 20,900 marathoners
B) 21,000 marathoners
C) 21,100 marathoners
D) 21,200 marathoners
E) 20,800 marathoners
A) 20,900 marathoners
B) 21,000 marathoners
C) 21,100 marathoners
D) 21,200 marathoners
E) 20,800 marathoners
Unlock Deck
Unlock for access to all 84 flashcards in this deck.
Unlock Deck
k this deck
44
The heights, in inches, of the women in a nursing class were recorded. The results are displayed in the frequency polygon in the Figure. Use the following figure. How many women are between 61 inches and 64 inches tall?
A) 11 women
B) 12 women
C) 9 women
D) 10 women
E) 8 women
A) 11 women
B) 12 women
C) 9 women
D) 10 women
E) 8 women
Unlock Deck
Unlock for access to all 84 flashcards in this deck.
Unlock Deck
k this deck
45
Most health statistics list normal body temperature as 98.6°. A recent study of 30 healthy adults recorded their body temperatures at 8 A.M. and then displayed the results in the histogram given below. Use the figure. How many body temperatures were lower than 96.5°?
A) 2 temperatures
B) 3 temperatures
C) 0 temperatures
D) 4 temperatures
E) 1 temperatures
A) 2 temperatures
B) 3 temperatures
C) 0 temperatures
D) 4 temperatures
E) 1 temperatures
Unlock Deck
Unlock for access to all 84 flashcards in this deck.
Unlock Deck
k this deck
46
The resting heart rates for a group of men involved in a clinical trial of a new medication were recorded at the beginning of the study. The results in beats per minute were 70, 87, 66, 67, 75, 78, 78, 82, 71, 74, 82, and 69.9. Calculate the mean, the median, and the mode of the resting heart rates of the group.
A) Mean: 69.9 beats/minute; median: 78.0 beats/minute; mode: 78 beats/minute
B) Mean: 70.9 beats/minute; median: 79.0 beats/minute; mode: 79 beats/minute
C) Mean: 71.9 beats/minute; median: 80.0 beats/minute; mode: 80 beats/minute
D) Mean: 72.9 beats/minute; median: 81.0 beats/minute; mode: 81 beats/minute
E) Mean: 73.9 beats/minute; median: 82.0 beats/minute; mode: 82 beats/minute
Unlock Deck
Unlock for access to all 84 flashcards in this deck.
Unlock Deck
k this deck
47
The frequency polygon in the below Figure shows the approximate numbers of runners in the 2008 Boston Marathon to finish in each of the given time slots (times are given in hours and minutes). Use the following figure. Determine the approximate number of runners who finished with times between 2 hours and 6 hours.
A) 23,000 runners
B) 22,000 runners
C) 21,000 runners
D) 24,000 runners
E) 20,000 runners
A) 23,000 runners
B) 22,000 runners
C) 21,000 runners
D) 24,000 runners
E) 20,000 runners
Unlock Deck
Unlock for access to all 84 flashcards in this deck.
Unlock Deck
k this deck
48
The double-broken-line graph shows the number of Calories per day that should be consumed by women and men in various age groups. Use the following graph. Find the ratio of the number of Calories recommended for women 11 to 14 years old to the number recommended for women '23 to 50 years old.
A)
B)
C)
D)
E)
A)
B)
C)
D)
E)
Unlock Deck
Unlock for access to all 84 flashcards in this deck.
Unlock Deck
k this deck
49
The frequency polygon below shows the distances thrown by the entrants in the University and College Discus Finals at the 2003 Drake Relays. What percent of the entrants had distances between 160 and 170 feet? Round your answer to two decimal places.
A) 8.33
B) 16.67
C) 37.50
D) 4.17
E) 0.00
A) 8.33
B) 16.67
C) 37.50
D) 4.17
E) 0.00
Unlock Deck
Unlock for access to all 84 flashcards in this deck.
Unlock Deck
k this deck
50
The annual tuition for undergraduate college students attending 4-year institutions varies depending on the college. The histogram below shows the tuition amounts for a representative sample of 124 students from various parts of the United States. What percent of the total number of students spend less than $12,000 annually for tuition? Round your answer to two decimal places.
A) 93.55
B) 85.48
C) 100.00
D) 33.87
E) 70.97
A) 93.55
B) 85.48
C) 100.00
D) 33.87
E) 70.97
Unlock Deck
Unlock for access to all 84 flashcards in this deck.
Unlock Deck
k this deck
51
The annual tuition for undergraduate college students attending 4-year institutions varies depending on the college. The histogram below shows the tuition amounts for a representative sample of 124 students from various parts of the United States. How many students pay more than $6000 annually for tuition?
A) 36 students
B) 30 students
C) 18 students
D) 8 students
E) 0 students
A) 36 students
B) 30 students
C) 18 students
D) 8 students
E) 0 students
Unlock Deck
Unlock for access to all 84 flashcards in this deck.
Unlock Deck
k this deck
52
The heights, in inches, of the women in a nursing class were recorded. The results are displayed in the frequency polygon in the Figure.Use the following figure. What percent of the women are taller than 64 inches?
A) 69
B) 68
C) 70
D) 71
E) 67
A) 69
B) 68
C) 70
D) 71
E) 67
Unlock Deck
Unlock for access to all 84 flashcards in this deck.
Unlock Deck
k this deck
53
The total cholesterol readings for 40 female patients seen this week at a doctor's office were recorded. Figure is a histogram of these data. Use the following figure.Total cholesterol readings lower than 200 are considered normal. How many patients had readings lower than 200?
A) 25 patients
B) 24 patients
C) 23 patients
D) 22 patients
E) 21 patients
A) 25 patients
B) 24 patients
C) 23 patients
D) 22 patients
E) 21 patients
Unlock Deck
Unlock for access to all 84 flashcards in this deck.
Unlock Deck
k this deck
54
The frequency polygon below shows the distances thrown by the entrants in the University and College Discus Finals at the 2003 Drake Relays. Find the number of entrants with distances of more than 150 feet.
A) 3
B) 16
C) 7
D) 24
E) 1
A) 3
B) 16
C) 7
D) 24
E) 1
Unlock Deck
Unlock for access to all 84 flashcards in this deck.
Unlock Deck
k this deck
55
Most health statistics list normal body temperature as 98.6°. A recent study of 30 healthy adults recorded their body temperatures at 8 A.M. and then displayed the results in the histogram in the following Figure. Use the Figure. Which class has the highest frequency?
A) 96.5° to 98.5°
B) 97.5° to 98.5°
C) 96.5° to 97.5°
D) 98.5° to 99.5°
E) 95.5° to 97.5°
A) 96.5° to 98.5°
B) 97.5° to 98.5°
C) 96.5° to 97.5°
D) 98.5° to 99.5°
E) 95.5° to 97.5°
Unlock Deck
Unlock for access to all 84 flashcards in this deck.
Unlock Deck
k this deck
56
The total cholesterol readings for 40 female patients seen this week at a doctor's office were recorded. Figure is a histogram of these data. Use the following figure.If a patient has a total cholesterol reading higher than 300, a doctor may prescribe a cholesterol-lowering medication as well as a change in diet. What percent of these patients had total cholesterol readings higher than 400?
A) 12.5%
B) 14%
C) 14.5%
D) 11%
E) 11.5%
A) 12.5%
B) 14%
C) 14.5%
D) 11%
E) 11.5%
Unlock Deck
Unlock for access to all 84 flashcards in this deck.
Unlock Deck
k this deck
57
The annual tuition for undergraduate college students attending 4-year institutions varies depending on the college. The histogram below shows the tuition amounts for a representative sample of 124 students from various parts of the United States. How many students have a tuition that is between $12,000 and $15,000 per year?
A) 10 students
B) 8 students
C) 42 students
D) 46 students
E) 6 students
A) 10 students
B) 8 students
C) 42 students
D) 46 students
E) 6 students
Unlock Deck
Unlock for access to all 84 flashcards in this deck.
Unlock Deck
k this deck
58
The frequency polygon in Figure shows the distribution of scores of the approximately 1,548,000 students who took the SAT Math exam in 2010. Use the following figure Approximately how many students scored lower than 700?
A) Approximately 691,000 students
B) Approximately 689,000 students
C) Approximately 688,500 students
D) Approximately 691,500 students
E) Approximately 690,000 students
A) Approximately 691,000 students
B) Approximately 689,000 students
C) Approximately 688,500 students
D) Approximately 691,500 students
E) Approximately 690,000 students
Unlock Deck
Unlock for access to all 84 flashcards in this deck.
Unlock Deck
k this deck
59
The frequency polygon in Figure shows the distribution of scores of the approximately 1,548,000 students who took the SAT Math exam in 2010. Use the following figure Approximately how many students scored between 200 and 300 on the SAT Math exam?
A) Approximately 31,000 students
B) Approximately 30,000 students
C) Approximately 29,000 students
D) Approximately 31,500 students
E) Approximately 28,500 students
A) Approximately 31,000 students
B) Approximately 30,000 students
C) Approximately 29,000 students
D) Approximately 31,500 students
E) Approximately 28,500 students
Unlock Deck
Unlock for access to all 84 flashcards in this deck.
Unlock Deck
k this deck
60
The number of big-screen televisions sold each month for 1 year was recorded by an electronics store. The results were 14, 10, 22, 22, 20, 17, 23, 24, 17, 22, 14, and 35. Calculate the mean, the median, and the mode of the number of televisions sold per month.
A) Mean: 21 TVs; median: 22 TVs; mode: 20 TVs
B) Mean: 20 TVs; median: 22 TVs; mode: 21 TVs
C) Mean: 21 TVs; median: 21 TVs; mode: 22 TVs
D) Mean: 20 TVs; median: 20 TVs; mode: 21 TVs
E) Mean: 20 TVs; median: 21 TVs; mode: 22 TVs
A) Mean: 21 TVs; median: 22 TVs; mode: 20 TVs
B) Mean: 20 TVs; median: 22 TVs; mode: 21 TVs
C) Mean: 21 TVs; median: 21 TVs; mode: 22 TVs
D) Mean: 20 TVs; median: 20 TVs; mode: 21 TVs
E) Mean: 20 TVs; median: 21 TVs; mode: 22 TVs
Unlock Deck
Unlock for access to all 84 flashcards in this deck.
Unlock Deck
k this deck
61
The life expectancies, in years, in ten selected Central and South American countries are given at the below.
a. Find the mean life expectancy in this group of countries.
b. Find the median life expectancy in this group of countries.
A) Mean: 80.5 years; median: 80 years
B) Mean: 81.5 years; median: 79 years
C) Mean: 78.5 years; median: 78 years
D) Mean: 77.5 years; median: 77 years
E) Mean: 79.5 years; median: 76 years
Unlock Deck
Unlock for access to all 84 flashcards in this deck.
Unlock Deck
k this deck
62
Eight health maintenance organizations (HMOs) presented group health insurance plans to a company. The monthly rates per employee were $410, $381, $391, $385, $413, $350, $390, and $416. Calculate the mean and the median monthly rates for these eight HMOs.
A) Mean: $390.5; median: $390.5
B) Mean: $390.5; median: $392
C) Mean: $392; median: $392
D) Mean: $392; median: $390.5
E) Mean: $784; median: $390.5
A) Mean: $390.5; median: $390.5
B) Mean: $390.5; median: $392
C) Mean: $392; median: $392
D) Mean: $392; median: $390.5
E) Mean: $784; median: $390.5
Unlock Deck
Unlock for access to all 84 flashcards in this deck.
Unlock Deck
k this deck
63
The times, in seconds, for a 100-meter dash at a college track meet were 11.00, 10.76, 11.09, 11.50, 10.80, 11.43, 11.22, 11.15, 11.06, and 11.28.
a. Calculate the mean time for the 100-meter dash.
b. Calculate the median time for the 100-meter dash.
A) (a) Mean: 11.129 seconds; (b) median: 11.129 seconds
B) (a) Mean: 11.129 seconds; (b) median: 11.12 seconds
C) (a) Mean: 11.12 seconds; (b) median: 11.12 seconds
D) (a) Mean: 11.12 seconds; (b) median: 11.129 seconds
E) (a) Mean: 12.37 seconds; (b) median: 11.12 seconds
Unlock Deck
Unlock for access to all 84 flashcards in this deck.
Unlock Deck
k this deck
64
A consumer research group recently reported the amount of sugar in 12-ounce servings of six popular soft drinks. The results in grams were 29, 52, 31.5, 36, 47, and 52. Calculate the mean, the median, and the mode of the amount of sugar in these soft drinks.
A) Mean: 43.3 grams; median: 40.5 grams; mode: 32.5grams
B) Mean: 41.3 grams; median: 41.5 grams; mode: 52 grams
C) Mean: 42.3 grams; median: 43.5 grams; mode: 29.5 grams
D) Mean: 40.3 grams; median: 42.5 grams; mode: 30.5 grams
E) Mean: 39.3 grams; median: 39.5 grams; mode: 33.5 grams
A) Mean: 43.3 grams; median: 40.5 grams; mode: 32.5grams
B) Mean: 41.3 grams; median: 41.5 grams; mode: 52 grams
C) Mean: 42.3 grams; median: 43.5 grams; mode: 29.5 grams
D) Mean: 40.3 grams; median: 42.5 grams; mode: 30.5 grams
E) Mean: 39.3 grams; median: 39.5 grams; mode: 33.5 grams
Unlock Deck
Unlock for access to all 84 flashcards in this deck.
Unlock Deck
k this deck
65
The number of seats occupied per flight on a jet for 16 trans-Atlantic flights was recorded. The numbers were 310, 419, 381, 416, 402, 352, 362, 320, 412, 386, 331, 407, 397, 377, 415, and 393. Calculate the mean, the median, and the mode of the number of seats occupied per flight.
A) Mean: 389.5 seats; median: 389.5 seats; mode: 384.75 seats
B) Mean: 380 seats; median: 384.75 seats; mode: 389.5 seats
C) Mean: 380 seats; median: 389.5 seats; mode: no mode
D) Mean: 384.75 seats; median: 389.5 seats; mode: no mode
E) Mean: 384.75 seats; median: 389.5 seats; mode: 380 seats
A) Mean: 389.5 seats; median: 389.5 seats; mode: 384.75 seats
B) Mean: 380 seats; median: 384.75 seats; mode: 389.5 seats
C) Mean: 380 seats; median: 389.5 seats; mode: no mode
D) Mean: 384.75 seats; median: 389.5 seats; mode: no mode
E) Mean: 384.75 seats; median: 389.5 seats; mode: 380 seats
Unlock Deck
Unlock for access to all 84 flashcards in this deck.
Unlock Deck
k this deck
66
The cholesterol levels for 100 adults were recorded and then displayed in the box-and-whiskers plot shown below.
a. How many adults had a cholestorol level above 212?
b. How many adults had a cholestorol level below 249?
c. How many cholestorol levels are represented in each quartile?
d. What percent of the adults had a cholestorol level of not more than 193?
A) (a) 50 adults; (b) 75 adults; (c) 25 cholestorol levels; (d) 25
B) (a) 50 adults; (b) 25 adults; (c) 75 cholestorol levels; (d) 75
C) (a) 25 adults; (b) 75 adults; (c) 50 cholestorol levels; (d) 75
D) (a) 25 adults; (b) 75 adults; (c) 50 cholestorol levels; (d) 25
E) None of the above
a. How many adults had a cholestorol level above 212?
b. How many adults had a cholestorol level below 249?
c. How many cholestorol levels are represented in each quartile?
d. What percent of the adults had a cholestorol level of not more than 193?
A) (a) 50 adults; (b) 75 adults; (c) 25 cholestorol levels; (d) 25
B) (a) 50 adults; (b) 25 adults; (c) 75 cholestorol levels; (d) 75
C) (a) 25 adults; (b) 75 adults; (c) 50 cholestorol levels; (d) 75
D) (a) 25 adults; (b) 75 adults; (c) 50 cholestorol levels; (d) 25
E) None of the above
Unlock Deck
Unlock for access to all 84 flashcards in this deck.
Unlock Deck
k this deck
67
A consumer research group purchased identical items in eight drugstores. The costs for the purchased items were $85.74, $90.7, $81.43, $80.65, $88.73, $82.42, $87.9, and $85.82. Calculate the mean and the median costs of the purchased items.
A) Mean: $87.421; median: $87.780
B) Mean: $86.421; median: $86.780
C) Mean: $85.421; median: $85.780
D) Mean: $87.621; median: $87.980
E) Mean: $88.721; median: $89.080
A) Mean: $87.421; median: $87.780
B) Mean: $86.421; median: $86.780
C) Mean: $85.421; median: $85.780
D) Mean: $87.621; median: $87.980
E) Mean: $88.721; median: $89.080
Unlock Deck
Unlock for access to all 84 flashcards in this deck.
Unlock Deck
k this deck
68
Cymbalta is a prescription medication used to treat depression. The probabilities of some of the side effects from this medication are listed in below table.
a. If 35 patients take this medication, how many would you expect to experience headaches as a side effect?
b. If 65 patients take this medication and five of them report dizziness as a side effect, is this more or less than the number you would expect based on the probabilities in the table?
A) a. 7 patients b. Less
B) a. 6 patients b. Less
C) a. 8 patients b. More
D) a. 5 patients b. More
E) a. 9 patients b. Less
Unlock Deck
Unlock for access to all 84 flashcards in this deck.
Unlock Deck
k this deck
69
Of 3981 obese patients who had weight loss bariatric surgery including stomach stapling, stomach banding and gastric bypass, 67 died after surgery. Suppose these statistics are used to determine the probability of death following bariatric surgery. Calculate that probability in the form of a percent. Round to the nearest tenth of a percent.
A) 2.6
B) 2.9
C) 1.2
D) 1.7
E) 1.5
A) 2.6
B) 2.9
C) 1.2
D) 1.7
E) 1.5
Unlock Deck
Unlock for access to all 84 flashcards in this deck.
Unlock Deck
k this deck
70
The number of days that 12 patients stayed in a hospital after hip replacement was recorded during January and are shown in the table below. Find the mean and median length of hospital stay for these patients. Round to the nearest tenth. 5
8
4
4
8
6
4
5
5
8
5
4
A) Mean: 6.5 days; Median: 6.0 days
B) Mean: 5.5 days; Median: 5.0 days
C) Mean: 4.5 days; Median: 4.0 days
D) Mean: 7.5 days; Median: 7.0 days
E) Mean: 3.5 days; Median: 3.0 days
8
4
4
8
6
4
5
5
8
5
4
A) Mean: 6.5 days; Median: 6.0 days
B) Mean: 5.5 days; Median: 5.0 days
C) Mean: 4.5 days; Median: 4.0 days
D) Mean: 7.5 days; Median: 7.0 days
E) Mean: 3.5 days; Median: 3.0 days
Unlock Deck
Unlock for access to all 84 flashcards in this deck.
Unlock Deck
k this deck
71
Two dice are rolled.
a. What is the probability that the sum of the dots on the upward faces is 7?
b. What is the probability that the sum of the dots on the upward faces is 13?
c. What is the probability that the sum of the dots on the upward faces is less than 16?
d. What is the probability that the sum of the dots on the upward faces is 4?
A) (a) ; (b) 0; (c) 1; (d)
B) (a) ; (b) 1; (c) 0; (d)
C) (a) ; (b) 0; (c) 1; (d)
D) (a) ; (b) 1; (c) 0; (d)
E) (a) ; (b) 1; (c) 0; (d)
Unlock Deck
Unlock for access to all 84 flashcards in this deck.
Unlock Deck
k this deck
72
Each of the letters of the word MISSISSIPPI is written on a card, and the cards are placed in a hat. One card is drawn at random from the hat.
a. What is the probability that the card has the letter P on it?
b. Which is greater, the probability of choosing a letter P or that of choosing a letter I?
A) (a) ; (b) Choosing a letter I
B) (a) ; (b) Neither
C) (a) ; (b) Choosing a letter P
D) (a) ; (b) Choosing a letter I
E) (a) ; (b) Choosing a letter P
Unlock Deck
Unlock for access to all 84 flashcards in this deck.
Unlock Deck
k this deck
73
The box-and-whiskers plot below shows the distribution of median incomes for 50 towns. What is the lowest value in the set of data? The highest value? The first quartile? The third quartile? The median? Find the range and the interquartile range.
A) Lowest = $36,822; highest = $64,034; Q1 = $51,755; Q3 = $43,925; median = $47,652; range = $27,212; interquartile range = $7830
B) Lowest = $36,822; highest = $64,034; Q1 = $43,925; Q3 = $51,755; median = $47,652; range = $7830; interquartile range = $27,212
C) Lowest = $36,822; highest = $64,034; Q1 = $43,925; Q3 = $51,755; median = $47,652; range = $27,212; interquartile range = $7830
D) Lowest = $36,822; highest = $64,034; Q1 = $51,755; Q3 = $43,925; median = $47,652; range = $7830; interquartile range = $27,212
E) None of the above
Unlock Deck
Unlock for access to all 84 flashcards in this deck.
Unlock Deck
k this deck
74
A dodecahedral die has 12 sides numbered from 1 to 12. The die is rolled once.
a. What is the probability that the upward face shows a number divisible by 2?
b. What is the probability that the upward face shows a number that is a multiple of 11?
A) (a) ; (b)
B) (a) ; (b)
C) (a) ; (b)
D) (a) ; (b)
E) (a) ; (b)
a. What is the probability that the upward face shows a number divisible by 2?
b. What is the probability that the upward face shows a number that is a multiple of 11?
A) (a) ; (b)
B) (a) ; (b)
C) (a) ; (b)
D) (a) ; (b)
E) (a) ; (b)
Unlock Deck
Unlock for access to all 84 flashcards in this deck.
Unlock Deck
k this deck
75
A patient's blood sugar readings were recorded during a recent stay in the hospital. The results in milligrams/deciliter were 210, 202, 163, 184, 199, 159, 130, 159, 122, 103, 108, and 92.
a. Calculate the mean blood sugar reading for this patient.
b. Calculate the median blood sugar reading for this patient.
A) a. 154.6 milligrams/deciliter b. 161 milligrams/deciliter
B) a. 153.6 milligrams/deciliter b. 160 milligrams/deciliter
C) a. 151.6 milligrams/deciliter b. 158 milligrams/deciliter
D) a. 152.6 milligrams/deciliter b. 159 milligrams/deciliter
E) a. 150.6 milligrams/deciliter b. 157 milligrams/deciliter
Unlock Deck
Unlock for access to all 84 flashcards in this deck.
Unlock Deck
k this deck
76
A consumer research group purchased identical items in eight grocery stores. The costs for the purchased items were $42.27, $48.60, $37.79, $37.01, $45.21, $38.78, $44.31, and $42.21. Calculate the mean and the median costs of the purchased items. Round your answers to four decimal places.
A) Mean: $42.2400; median: $42.2400
B) Mean: $42.0225; median: $42.2400
C) Mean: $42.0225; median: $42.0225
D) Mean: $42.2400; median: $42.0225
E) Mean: $48.0257; median: $42.2400
A) Mean: $42.2400; median: $42.2400
B) Mean: $42.0225; median: $42.2400
C) Mean: $42.0225; median: $42.0225
D) Mean: $42.2400; median: $42.0225
E) Mean: $48.0257; median: $42.2400
Unlock Deck
Unlock for access to all 84 flashcards in this deck.
Unlock Deck
k this deck
77
Eight health maintenance organizations (HMOs) presented group health insurance plans to a company. The monthly rates per employee were $430, $398, $405, $387, $424, $353, $410 and $435. Calculate the mean and the median monthly rates for these eight companies.
A) Mean: $410.25; median: $410.50
B) Mean: $407.25; median: $408.50
C) Mean: $405.25; median: $407.50
D) Mean: $404.25; median: $409.50
E) Mean: $408.25; median: $406.50
A) Mean: $410.25; median: $410.50
B) Mean: $407.25; median: $408.50
C) Mean: $405.25; median: $407.50
D) Mean: $404.25; median: $409.50
E) Mean: $408.25; median: $406.50
Unlock Deck
Unlock for access to all 84 flashcards in this deck.
Unlock Deck
k this deck
78
Three blue marbles, eight green marbles, and seven red marbles are placed in a bag. One marble is chosen at random.
a. What is the probability that the marble chosen is red?
b. Which is greater, the probability of choosing a blue marble or that of choosing a red marble?
A) (a) ; (b) Choosing a red marble
B) (a) ; (b) Neither
C) (a) ; (b) Choosing a blue marble
D) (a) ; (b) Choosing a red marble
E) (a) ; (b) Choosing a blue marble
Unlock Deck
Unlock for access to all 84 flashcards in this deck.
Unlock Deck
k this deck
79
There are 15 students in the medical assisting class at the community college. Their ages are 22, 27, 21, 30, 44, 26, 23, 24, 46, 37, 38, 30, 24, 22, and 49. Find the mean and median ages of this class of students. Round to the nearest tenth.
A) Mean: 35.9 years; Median: 29.7 years
B) Mean: 31.9 years; Median: 28.7 years
C) Mean: 33.9 years; Median: 26.7 years
D) Mean: 30.9 years; Median: 27.7 years
E) Mean: 32.9 years; Median: 25.7 years
A) Mean: 35.9 years; Median: 29.7 years
B) Mean: 31.9 years; Median: 28.7 years
C) Mean: 33.9 years; Median: 26.7 years
D) Mean: 30.9 years; Median: 27.7 years
E) Mean: 32.9 years; Median: 25.7 years
Unlock Deck
Unlock for access to all 84 flashcards in this deck.
Unlock Deck
k this deck
80
A survey of 573 people showed that 711 had a group health insurance plan where they worked. On the basis of this survey, what is the empirical probability that an employee has a group health insurance plan? Write the answer as a decimal rounded to the nearest hundredth.
A) 1.81
B) 0.61
C) 2.81
D) 0.81
E) 0.41
A) 1.81
B) 0.61
C) 2.81
D) 0.81
E) 0.41
Unlock Deck
Unlock for access to all 84 flashcards in this deck.
Unlock Deck
k this deck
Unlock Deck
Unlock for access to all 84 flashcards in this deck.


