Deck 8: Economic Growth
Full screen (f)
Question
Question
Question
Question
Question
Question
Question
Question
Question
Question
Question
Question
Question
Question
Question
Question
Question
Question
Question
Question
Question
Question
Question
Question
Question
Question
Question
Question
Question
Question
Question
Question
Question
Question
Question
Question
Question
Question
Question
Question
Question
Question
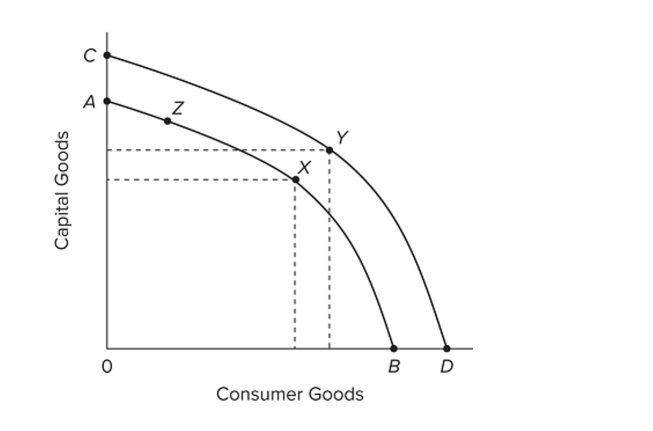
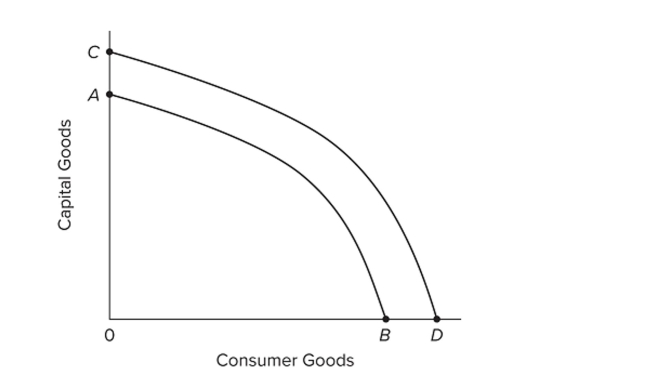 Refer to the graph. An increase in the economy's human capital would
A) move the economy away from point A and toward point B.
B) shift curve CD to AB.
C) move the economy away from point B and toward point A.
D) shift curve AB to CD.
Question
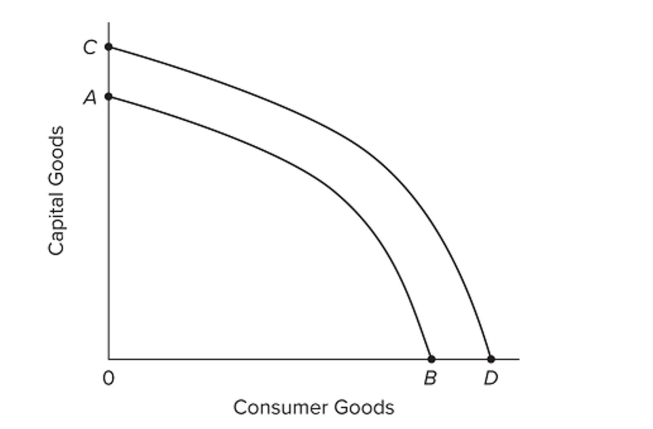 Refer to the graph. An increase in an economy's labor productivity would
A) move the economy away from point A and toward point B.
B) move the economy away from point B and toward point A.
C) shift curve AB to CD.
D) shift curve CD to AB.
Question
Question
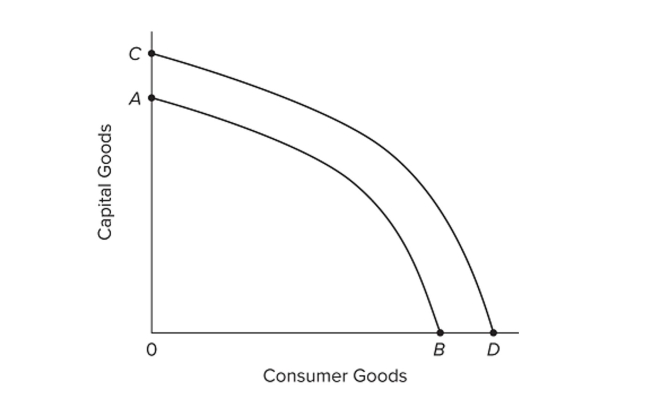 Refer to the graph. Growth of production capacity is shown by the
A) shift from AB to CD.
B) shift from CD to AB.
C) movement away from point A and toward point B.
D) movement away from point B and toward point A.
Question
Question
Question
Question
Question
Question
Question
Question
Question
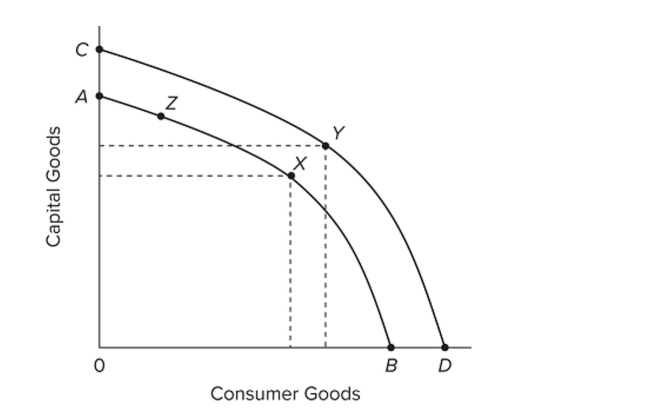 Refer to the diagram. Increases in the quantity and quality of human resources and capital are best represented by a
A) shift in the production possibilities curve from AB to CD.
B) move from Y on CD to X on AB.
C) shift in the production possibilities curve from CD to AB.
D) move from X to Z along AB.
Question
 Refer to the diagram. Realized economic growth is best represented by a
A) move from Z to X along AB.
B) move from X on AB to Y on CD.
C) shift in the production possibilities curve from CD to AB.
D) move from X to Z along AB.
Question
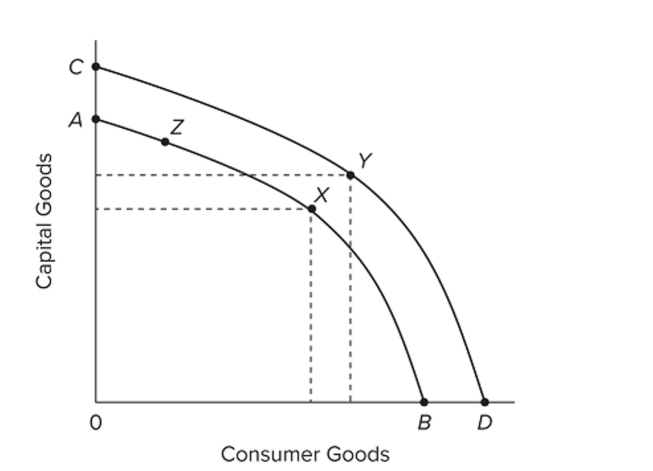 Refer to the diagram. The most likely cause of a shift from AB to CD would be a(n)
A) increase in productivity.
B) increase in the price level.
C) decrease in the size of the labor force.
D) increase in government spending.
Question
Question
Question
Question
Question
Question
Question
Question
Question
Question
Question
Question
Question
Question
Question
Question
Question
Question
Question
Question
Question
Question
Question
Question

Unlock Deck
Sign up to unlock the cards in this deck!
Unlock Deck
Unlock Deck
1/274
Play
Full screen (f)
Deck 8: Economic Growth
1
Real GDP per capita
A) cannot grow more rapidly than real GDP.
B) cannot grow more slowly than real GDP.
C) necessarily grows more rapidly than real GDP.
D) can grow either more slowly or more rapidly than real GDP.
A) cannot grow more rapidly than real GDP.
B) cannot grow more slowly than real GDP.
C) necessarily grows more rapidly than real GDP.
D) can grow either more slowly or more rapidly than real GDP.
can grow either more slowly or more rapidly than real GDP.
2
Between 1950 and 2018, U.S. real GDP per capita grew at an average annual rate of about
A) 5.5 percent.
B) 4.2 percent.
C) 3.2 percent.
D) 2.0 percent.
A) 5.5 percent.
B) 4.2 percent.
C) 3.2 percent.
D) 2.0 percent.
2.0 percent.
3
If a nation's real GDP is growing by 5 percent per year, its real GDP will double in approximately
A) 22 years.
B) 20 years.
C) 14 years.
D) 8 years.
A) 22 years.
B) 20 years.
C) 14 years.
D) 8 years.
14 years.
4
If the economy's real GDP doubles in 18 years, we can
A) not say anything about the average annual rate of growth.
B) conclude that its average annual rate of growth is about 5.5 percent.
C) conclude that its average annual rate of growth is about 2.4 percent.
D) conclude that its average annual rate of growth is about 3.9 percent.
A) not say anything about the average annual rate of growth.
B) conclude that its average annual rate of growth is about 5.5 percent.
C) conclude that its average annual rate of growth is about 2.4 percent.
D) conclude that its average annual rate of growth is about 3.9 percent.
Unlock Deck
Unlock for access to all 274 flashcards in this deck.
Unlock Deck
k this deck
5
Given the annual rate of economic growth, the "rule of 70" allows one to
A) determine the accompanying rate of inflation.
B) calculate the size of the GDP gap.
C) calculate the number of years required for real GDP to double.
D) determine the growth rate of per capita GDP.
A) determine the accompanying rate of inflation.
B) calculate the size of the GDP gap.
C) calculate the number of years required for real GDP to double.
D) determine the growth rate of per capita GDP.
Unlock Deck
Unlock for access to all 274 flashcards in this deck.
Unlock Deck
k this deck
6
If a nation's real GDP increases from 100 billion to 106 billion and its population jumps from 200 million to 212 million, its real GDP per capita will
A) remain constant.
B) fall by 6 percent.
C) rise by 6 percent.
D) fall by 12 percent.
A) remain constant.
B) fall by 6 percent.
C) rise by 6 percent.
D) fall by 12 percent.
Unlock Deck
Unlock for access to all 274 flashcards in this deck.
Unlock Deck
k this deck
7
Refer to the table. Between years 1 and 2, real GDP grew by __________ percent in Alta.
A) 3
B) 4
C) 5
D) 10
A) 3
B) 4
C) 5
D) 10
Unlock Deck
Unlock for access to all 274 flashcards in this deck.
Unlock Deck
k this deck
8
Refer to the table. Between years 1 and 2, real GDP per capita grew by approximately __________ percent in Alta.
A) 3
B) 4
C) 5
D) 10
A) 3
B) 4
C) 5
D) 10
Unlock Deck
Unlock for access to all 274 flashcards in this deck.
Unlock Deck
k this deck
9
Refer to the table. Per capita GDP was about
A) $105 in year 3 in Alta.
B) $303 in year 3 in Zorn.
C) $200 in year 1 in Zorn.
D) $5 in year 2 in Alta.
A) $105 in year 3 in Alta.
B) $303 in year 3 in Zorn.
C) $200 in year 1 in Zorn.
D) $5 in year 2 in Alta.
Unlock Deck
Unlock for access to all 274 flashcards in this deck.
Unlock Deck
k this deck
10
Real GDP per capita is found by
A) adding real GDP and the population.
B) subtracting the population from real GDP.
C) dividing real GDP by the population.
D) dividing the population by real GDP.
A) adding real GDP and the population.
B) subtracting the population from real GDP.
C) dividing real GDP by the population.
D) dividing the population by real GDP.
Unlock Deck
Unlock for access to all 274 flashcards in this deck.
Unlock Deck
k this deck
11
Which of the following best measures improvements in the standard of living of a nation?
A) growth of nominal GDP
B) growth of real GDP
C) growth of real GDP per capita
D) growth of national income
A) growth of nominal GDP
B) growth of real GDP
C) growth of real GDP per capita
D) growth of national income
Unlock Deck
Unlock for access to all 274 flashcards in this deck.
Unlock Deck
k this deck
12
Between 1950 and 2018, U.S. real GDP grew at an average annual rate of about
A) 2.0 percent.
B) 3.1 percent.
C) 5.1 percent.
D) 8.6 percent.
A) 2.0 percent.
B) 3.1 percent.
C) 5.1 percent.
D) 8.6 percent.
Unlock Deck
Unlock for access to all 274 flashcards in this deck.
Unlock Deck
k this deck
13
Growth is advantageous to a nation because it
A) promotes faster population growth.
B) lessens the burden of scarcity.
C) eliminates the economizing problem.
D) slows the growth of wants.
A) promotes faster population growth.
B) lessens the burden of scarcity.
C) eliminates the economizing problem.
D) slows the growth of wants.
Unlock Deck
Unlock for access to all 274 flashcards in this deck.
Unlock Deck
k this deck
14
At an annual growth rate of 7 percent, real GDP will double in about
A)
B) 10 years.
C)
D) 9 years.
A)
B) 10 years.
C)
D) 9 years.
Unlock Deck
Unlock for access to all 274 flashcards in this deck.
Unlock Deck
k this deck
15
For comparing changes in potential military strength and political preeminence, the most meaningful measure of economic growth would be changes in
A) total nominal output.
B) total real output.
C) per capita output.
D) per family output.
A) total nominal output.
B) total real output.
C) per capita output.
D) per family output.
Unlock Deck
Unlock for access to all 274 flashcards in this deck.
Unlock Deck
k this deck
16
Real per capita GDP in the United States in 2018 was approximately
A) $18,571.
B) $47,845.
C) $56,793.
D) $18.6 trillion.
A) $18,571.
B) $47,845.
C) $56,793.
D) $18.6 trillion.
Unlock Deck
Unlock for access to all 274 flashcards in this deck.
Unlock Deck
k this deck
17
The number of years required for real GDP to double can be found by
A) dividing the annual growth rate by 0.07.
B) multiplying the annual growth rate by 70.
C) dividing 70 by the annual growth rate.
D) adding 14 to annual growth rate.
A) dividing the annual growth rate by 0.07.
B) multiplying the annual growth rate by 70.
C) dividing 70 by the annual growth rate.
D) adding 14 to annual growth rate.
Unlock Deck
Unlock for access to all 274 flashcards in this deck.
Unlock Deck
k this deck
18
Economic growth is best defined as an increase in
A) either real GDP or real GDP per capita.
B) nominal GDP.
C) total consumption expenditures.
D) wealth in the economy.
A) either real GDP or real GDP per capita.
B) nominal GDP.
C) total consumption expenditures.
D) wealth in the economy.
Unlock Deck
Unlock for access to all 274 flashcards in this deck.
Unlock Deck
k this deck
19
For a nation's real GDP per capita to rise during a year,
A) consumption spending must increase.
B) real GDP must increase more rapidly than the population.
C) the population must increase more rapidly than real GDP.
D) investment spending must increase.
A) consumption spending must increase.
B) real GDP must increase more rapidly than the population.
C) the population must increase more rapidly than real GDP.
D) investment spending must increase.
Unlock Deck
Unlock for access to all 274 flashcards in this deck.
Unlock Deck
k this deck
20
Refer to the table. Between years 2 and 3,
A) Alta's real GDP grew more rapidly than Zorn's real GDP.
B) real GDP fell in Zorn.
C) population growth reduced Alta's real GDP growth to zero.
D) population fell in Alta.
A) Alta's real GDP grew more rapidly than Zorn's real GDP.
B) real GDP fell in Zorn.
C) population growth reduced Alta's real GDP growth to zero.
D) population fell in Alta.
Unlock Deck
Unlock for access to all 274 flashcards in this deck.
Unlock Deck
k this deck
21
Real per capita GDP
A) grows at approximately the same rate for all countries.
B) was much more equal across nations in 1820 than it is today.
C) has been about 20 times higher in the richer nations than the poorer nations for about 2,000 years.
D) grows much faster in "leader countries" than in "follower countries."
A) grows at approximately the same rate for all countries.
B) was much more equal across nations in 1820 than it is today.
C) has been about 20 times higher in the richer nations than the poorer nations for about 2,000 years.
D) grows much faster in "leader countries" than in "follower countries."
Unlock Deck
Unlock for access to all 274 flashcards in this deck.
Unlock Deck
k this deck
22
Countries that have experienced modern economic growth have also tended to
A) adopt feudalistic institutions.
B) restrict women and minorities from holding certain economic and political positions.
C) move toward more democratic forms of government.
D) have less leisure time for sport and artistic activities.
A) adopt feudalistic institutions.
B) restrict women and minorities from holding certain economic and political positions.
C) move toward more democratic forms of government.
D) have less leisure time for sport and artistic activities.
Unlock Deck
Unlock for access to all 274 flashcards in this deck.
Unlock Deck
k this deck
23
1. Improvements in technology. 2. Increases in the supply (stock) of capital goods.
3) Purchases of expanding output.
4) Obtaining the optimal combination of goods, each at least-cost production.
5) Increases in the quantity and quality of natural resources.
6) Increases in the quantity and quality of human resources.
Use the accompanying list to answer the following question. As distinct from the supply factors and
Demand factor of economic growth, the efficiency factor(s) of economic growth is (are)
A) 1 only.
B) 4 only.
C) 1 and 3 only.
D) 3 only.
Unlock Deck
Unlock for access to all 274 flashcards in this deck.
Unlock Deck
k this deck
24
Strong property rights are important for modern economic growth because
A) they allow governments to extract the gains from private citizens' investments.
B) people are more likely to invest if they don't fear that others can take their returns on investment without compensation.
C) they ensure an equitable distribution of income.
D) business cycle fluctuations will be smaller and less likely to disrupt investment patterns.
Unlock Deck
Unlock for access to all 274 flashcards in this deck.
Unlock Deck
k this deck
25
Which of the following economic regions has experienced the least growth in real GDP per capita since 1820?
A) Africa
B) Asia excluding Japan
C) Latin America
D) Western Europe
A) Africa
B) Asia excluding Japan
C) Latin America
D) Western Europe
Unlock Deck
Unlock for access to all 274 flashcards in this deck.
Unlock Deck
k this deck
26
Which of the following institutional structures is most likely to promote growth?
A) a well-enforced system of patents and copyrights
B) a tightly regulated market system
C) a system of tariffs and other trade barriers to protect domestic companies
D) all of these
A) a well-enforced system of patents and copyrights
B) a tightly regulated market system
C) a system of tariffs and other trade barriers to protect domestic companies
D) all of these
Unlock Deck
Unlock for access to all 274 flashcards in this deck.
Unlock Deck
k this deck
27
Which of the following statements is most accurate about the prospects for poorer ("follower") countries catching up with richer ("leader") countries?
A) Catching up is unlikely to occur because their growth rates are the same on average.
B) Catching up is unlikely to occur because richer countries tend to grow at a faster rate.
C) Catching up is possible, but only if growth rates in leader countries fall to zero or become negative.
D) Catching up is possible, as "follower countries" tend to grow faster than "leader countries."
Unlock Deck
Unlock for access to all 274 flashcards in this deck.
Unlock Deck
k this deck
28
Free trade
A) discourages growth by increasing competitive pressures on domestic firms.
B) encourages growth by effectively eliminating all patent and copyright barriers to growth.
C) discourages growth compared to situations where the government strongly controls foreign trade.
D) encourages growth by promoting the rapid spread of new inventions and innovations.
Unlock Deck
Unlock for access to all 274 flashcards in this deck.
Unlock Deck
k this deck
29
Under what circumstances do rates of economic growth understate the growth of economic well- being?
A) Economic growth has occurred because of the increased length of the workweek.
B) Product quality has improved.
C) Air quality has declined as real GDP has increased.
D) Population has grown faster than real output.
A) Economic growth has occurred because of the increased length of the workweek.
B) Product quality has improved.
C) Air quality has declined as real GDP has increased.
D) Population has grown faster than real output.
Unlock Deck
Unlock for access to all 274 flashcards in this deck.
Unlock Deck
k this deck
30
Which of the following economic regions has experienced the most growth in real GDP per capita since 1820?
A) Japan
B) United States
C) Latin America
D) Western Europe
A) Japan
B) United States
C) Latin America
D) Western Europe
Unlock Deck
Unlock for access to all 274 flashcards in this deck.
Unlock Deck
k this deck
31
A competitive market system
A) encourages growth by allowing producers to make profitable investment decisions based on market signals.
B) encourages growth by ensuring that everyone in society will receive a decent standard of living.
C) discourages growth because firms busy competing have no time to innovate or invest.
D) discourages growth unless government protects domestic firms from foreign competition.
Unlock Deck
Unlock for access to all 274 flashcards in this deck.
Unlock Deck
k this deck
32
1. Improvements in technology. 2. Increases in the supply (stock) of capital goods.
3) Purchases of expanding output.
4) Obtaining the optimal combination of goods, each at least-cost production.
5) Increases in the quantity and quality of natural resources.
6) Increases in the quantity and quality of human resources.
Which set of items in the accompanying list would shift an economy's production possibilities curve
Outward?
A) 2, 5, and 6 only
B) 2, 4, 5, and 6 only
C) 1, 2, 5, and 6 only
D) 1, 3, and 4 only
Unlock Deck
Unlock for access to all 274 flashcards in this deck.
Unlock Deck
k this deck
33
Economic growth rates in follower countries
A) tend to be lower than in leader countries because labor forces in follower countries are too small.
B) tend to exceed those in leader countries because followers can cheaply adopt the new technologies that leaders developed at relatively high costs.
C) will never bring real GDP per capita up to the same levels as in leader countries, even if follower growth rates are greater than those in leader countries.
D) typically average about 2 percent per year.
Unlock Deck
Unlock for access to all 274 flashcards in this deck.
Unlock Deck
k this deck
34
1. Improvements in technology. 2. Increases in the supply (stock) of capital goods.
3) Purchases of expanding output.
4) Obtaining the optimal combination of goods, each at least-cost production.
5) Increases in the quantity and quality of natural resources.
6) Increases in the quantity and quality of human resources.
Use the accompanying list to answer the following question. As distinct from the supply factors and
Efficiency factor of economic growth, the demand factor(s) of economic growth is (are)
A) 1 only.
B) 4 only.
C) 1 and 3 only.
D) 3 only.
Unlock Deck
Unlock for access to all 274 flashcards in this deck.
Unlock Deck
k this deck
35
Which of the following statements is most accurate about modern economic growth?
A) Economic historians mark modern economic growth as beginning around A.D. 1500.
B) Modern economic growth is characterized by sustained and ongoing increases in living standards.
C) Modern economic growth has virtually eliminated business cycle fluctuations.
D) Modern economic growth has been distributed more or less equally across nations.
Unlock Deck
Unlock for access to all 274 flashcards in this deck.
Unlock Deck
k this deck
36
Economic historians date the start of the Industrial Revolution around the year 1776, when James Watt
A) built the first factory for mass production.
B) invented the steam locomotive.
C) successfully lobbied British Parliament for the enactment of patent legislation to protect new inventions.
D) invented and built a more powerful and efficient steam engine.
A) built the first factory for mass production.
B) invented the steam locomotive.
C) successfully lobbied British Parliament for the enactment of patent legislation to protect new inventions.
D) invented and built a more powerful and efficient steam engine.
Unlock Deck
Unlock for access to all 274 flashcards in this deck.
Unlock Deck
k this deck
37
The Industrial Revolution and modern economic growth resulted in
A) the average human lifespan more than doubling.
B) a major population shift from urban to rural areas.
C) increased production by local craftspeople.
D) all of these.
A) the average human lifespan more than doubling.
B) a major population shift from urban to rural areas.
C) increased production by local craftspeople.
D) all of these.
Unlock Deck
Unlock for access to all 274 flashcards in this deck.
Unlock Deck
k this deck
38
Which of the following institutional arrangements is most likely to promote growth?
A) patents and copyrights that expire quickly and are loosely enforced
B) strong government control over resource allocation decisions
C) unrestricted trade between nations
D) all of these
A) patents and copyrights that expire quickly and are loosely enforced
B) strong government control over resource allocation decisions
C) unrestricted trade between nations
D) all of these
Unlock Deck
Unlock for access to all 274 flashcards in this deck.
Unlock Deck
k this deck
39
1. Improvements in technology. 2. Increases in the supply (stock) of capital goods.
3) Purchases of expanding output.
4) Obtaining the optimal combination of goods, each at least-cost production.
5) Increases in the quantity and quality of natural resources.
6) Increases in the quantity and quality of human resources.
Use the accompanying list to answer the following question. As distinct from the demand and
Efficiency factors of economic growth, the supply factors of economic growth are
A) 2, 5, and 6 only.
B) 2, 4, 5, and 6 only.
C) 1, 2, 5, and 6 only.
D) 1, 3, and 4 only.
Unlock Deck
Unlock for access to all 274 flashcards in this deck.
Unlock Deck
k this deck
40
In 2008, living standards in the United States were nearly ______ times higher than those in Africa.
A) 3
B) 8
C) 10
D) 19
A) 3
B) 8
C) 10
D) 19
Unlock Deck
Unlock for access to all 274 flashcards in this deck.
Unlock Deck
k this deck
41
1. Improvements in technology. 2. Increases in the supply (stock) of capital goods.
3) Purchases of expanding output.
4) Obtaining the optimal combination of goods, each at least-cost production.
5) Increases in the quantity and quality of natural resources.
6) Increases in the quantity and quality of human resources.
Which set of items in the accompanying list would move an economy from a point inside its
Production possibilities curve to a point on its production possibilities curve?
A) 1, 2, 5, and 6 only
B) 3 and 4 only
C) 3 only
D) 1, 3, and 4 only
Unlock Deck
Unlock for access to all 274 flashcards in this deck.
Unlock Deck
k this deck
42
Refer to the graph. An increase in the economy's human capital wouldA) move the economy away from point A and toward point B.
B) shift curve CD to AB.
C) move the economy away from point B and toward point A.
D) shift curve AB to CD.
Unlock Deck
Unlock for access to all 274 flashcards in this deck.
Unlock Deck
k this deck
43
Refer to the graph. An increase in an economy's labor productivity wouldA) move the economy away from point A and toward point B.
B) move the economy away from point B and toward point A.
C) shift curve AB to CD.
D) shift curve CD to AB.
Unlock Deck
Unlock for access to all 274 flashcards in this deck.
Unlock Deck
k this deck
44
Which of the following is not a supply factor in economic growth?
A) the stock of capital
B) technological advance
C) the size and quality of the labor force
D) aggregate expenditures of households, businesses, and government
A) the stock of capital
B) technological advance
C) the size and quality of the labor force
D) aggregate expenditures of households, businesses, and government
Unlock Deck
Unlock for access to all 274 flashcards in this deck.
Unlock Deck
k this deck
45
Refer to the graph. Growth of production capacity is shown by theA) shift from AB to CD.
B) shift from CD to AB.
C) movement away from point A and toward point B.
D) movement away from point B and toward point A.
Unlock Deck
Unlock for access to all 274 flashcards in this deck.
Unlock Deck
k this deck
46
Suppose total output (real GDP) is $4,000 and labor productivity is $8. We can conclude that
A) real GDP per capita must be $500.
B) the price-level index must be greater than 100.
C) nominal GDP must be $500.
D) the number of worker-hours must be 500.
A) real GDP per capita must be $500.
B) the price-level index must be greater than 100.
C) nominal GDP must be $500.
D) the number of worker-hours must be 500.
Unlock Deck
Unlock for access to all 274 flashcards in this deck.
Unlock Deck
k this deck
47
Suppose total output (real GDP) is $10,000 and worker-hours are 20,000. We can conclude that
A) real GDP per capita must be $200,000.
B) the price-level index must be less than 100.
C) labor productivity must be $0.50.
D) nominal GDP must be between $10,000 and $20,000.
A) real GDP per capita must be $200,000.
B) the price-level index must be less than 100.
C) labor productivity must be $0.50.
D) nominal GDP must be between $10,000 and $20,000.
Unlock Deck
Unlock for access to all 274 flashcards in this deck.
Unlock Deck
k this deck
48
Economic growth can be portrayed as
A) an outward shift of the production possibilities curve.
B) an inward shift of the production possibilities curve.
C) a movement from a point on to a point inside a production possibilities curve.
D) a movement from one point to another point on a fixed production possibilities curve.
A) an outward shift of the production possibilities curve.
B) an inward shift of the production possibilities curve.
C) a movement from a point on to a point inside a production possibilities curve.
D) a movement from one point to another point on a fixed production possibilities curve.
Unlock Deck
Unlock for access to all 274 flashcards in this deck.
Unlock Deck
k this deck
49
If the number of worker-hours in an economy is 100 and its labor productivity is $5 of output per worker-hour, the economy's real GDP
A) is $20.
B) is $500.
C) is $5,000.
D) cannot be calculated.
A) is $20.
B) is $500.
C) is $5,000.
D) cannot be calculated.
Unlock Deck
Unlock for access to all 274 flashcards in this deck.
Unlock Deck
k this deck
50
The achievement of full employment through time will
A) diminish labor productivity.
B) reduce the level of investment as a percentage of GDP.
C) increase the realized rate of economic growth.
D) have no impact on the rate of economic growth.
A) diminish labor productivity.
B) reduce the level of investment as a percentage of GDP.
C) increase the realized rate of economic growth.
D) have no impact on the rate of economic growth.
Unlock Deck
Unlock for access to all 274 flashcards in this deck.
Unlock Deck
k this deck
51
Labor productivity is defined as
A) total output/worker-hours.
B) nominal GDP minus real GDP.
C) the ratio of real capital to worker-hours.
D) the annual increase in nominal GDP per worker.
A) total output/worker-hours.
B) nominal GDP minus real GDP.
C) the ratio of real capital to worker-hours.
D) the annual increase in nominal GDP per worker.
Unlock Deck
Unlock for access to all 274 flashcards in this deck.
Unlock Deck
k this deck
52
Suppose that an economy's labor productivity and total worker-hours each grew by 3 percent between year 1 and year 2. We could conclude that this economy's
A) real GDP remained constant.
B) capital stock increased by 3 percent.
C) production possibilities curve shifted inward.
D) production possibilities curve shifted outward.
A) real GDP remained constant.
B) capital stock increased by 3 percent.
C) production possibilities curve shifted inward.
D) production possibilities curve shifted outward.
Unlock Deck
Unlock for access to all 274 flashcards in this deck.
Unlock Deck
k this deck
53
The percentage of the working-age population in the labor force (= employed + officially unemployed) is called the
A) labor force participation rate.
B) employment-population ratio.
C) work-activity rate.
D) work-nonwork ratio.
A) labor force participation rate.
B) employment-population ratio.
C) work-activity rate.
D) work-nonwork ratio.
Unlock Deck
Unlock for access to all 274 flashcards in this deck.
Unlock Deck
k this deck
54
Refer to the diagram. Increases in the quantity and quality of human resources and capital are best represented by aA) shift in the production possibilities curve from AB to CD.
B) move from Y on CD to X on AB.
C) shift in the production possibilities curve from CD to AB.
D) move from X to Z along AB.
Unlock Deck
Unlock for access to all 274 flashcards in this deck.
Unlock Deck
k this deck
55
Refer to the diagram. Realized economic growth is best represented by aA) move from Z to X along AB.
B) move from X on AB to Y on CD.
C) shift in the production possibilities curve from CD to AB.
D) move from X to Z along AB.
Unlock Deck
Unlock for access to all 274 flashcards in this deck.
Unlock Deck
k this deck
56
Refer to the diagram. The most likely cause of a shift from AB to CD would be a(n)A) increase in productivity.
B) increase in the price level.
C) decrease in the size of the labor force.
D) increase in government spending.
Unlock Deck
Unlock for access to all 274 flashcards in this deck.
Unlock Deck
k this deck
57
Suppose that an economy's labor productivity fell by 3 percent and its total worker-hours remained constant between year 1 and year 2. We could conclude that this economy's
A) real GDP declined.
B) capital stock increased.
C) production possibilities curve shifted outward.
D) actual production moved from one point to another on a fixed production possibilities curve.
A) real GDP declined.
B) capital stock increased.
C) production possibilities curve shifted outward.
D) actual production moved from one point to another on a fixed production possibilities curve.
Unlock Deck
Unlock for access to all 274 flashcards in this deck.
Unlock Deck
k this deck
58
Which of the following is correct?
A) Total output = labor productivity/worker-hours.
B) Labor productivity = worker-hours/total output.
C) Total output = worker-hours × labor productivity.
D) Worker-hours = labor productivity × total output.
A) Total output = labor productivity/worker-hours.
B) Labor productivity = worker-hours/total output.
C) Total output = worker-hours × labor productivity.
D) Worker-hours = labor productivity × total output.
Unlock Deck
Unlock for access to all 274 flashcards in this deck.
Unlock Deck
k this deck
59
Labor productivity is measured by
A) the ratio of capital to labor.
B) real output per worker-hour.
C) real output per capita.
D) the ratio of worker-hours to real GDP.
A) the ratio of capital to labor.
B) real output per worker-hour.
C) real output per capita.
D) the ratio of worker-hours to real GDP.
Unlock Deck
Unlock for access to all 274 flashcards in this deck.
Unlock Deck
k this deck
60
Suppose that an economy's labor productivity and total worker-hours each grew by 4 percent between year 1 and year 2. We could conclude that this economy's
A) real GDP also increased by 4 percent.
B) real GDP remained constant.
C) production possibilities curve shifted outward.
D) capital stock increased by 4 percent.
A) real GDP also increased by 4 percent.
B) real GDP remained constant.
C) production possibilities curve shifted outward.
D) capital stock increased by 4 percent.
Unlock Deck
Unlock for access to all 274 flashcards in this deck.
Unlock Deck
k this deck
61
More than half the growth of real GDP in the United States is caused by
A) a falling price level.
B) the reallocation of labor from manufacturing to agriculture.
C) increases in the productivity of labor.
D) the use of fewer inputs of labor.
A) a falling price level.
B) the reallocation of labor from manufacturing to agriculture.
C) increases in the productivity of labor.
D) the use of fewer inputs of labor.
Unlock Deck
Unlock for access to all 274 flashcards in this deck.
Unlock Deck
k this deck
62
Which of the following statements is correct?
A) The U.S. population has increased more rapidly than real GDP in recent decades.
B) Improved education and training of labor is the most important source of U.S. productivity growth.
C) The average American factory worker has about 16 years of formal education.
D) The amount of real capital used per worker has increased historically in the United States.
Unlock Deck
Unlock for access to all 274 flashcards in this deck.
Unlock Deck
k this deck
63
Other things equal, which of the following would decrease the rate of economic growth, as measured by changes in real GDP?
A) an increase in the educational attainment of the labor force
B) a permanent decrease in frictional unemployment
C) an increase in the amount of capital per worker
D) a decrease in the labor force participation rate
A) an increase in the educational attainment of the labor force
B) a permanent decrease in frictional unemployment
C) an increase in the amount of capital per worker
D) a decrease in the labor force participation rate
Unlock Deck
Unlock for access to all 274 flashcards in this deck.
Unlock Deck
k this deck
64
Between 2018 and 2029, productivity growth is expected to account for about ________ percent of the growth of real GDP in the United States.
A) 62
B) 40
C) 92
D) 87
A) 62
B) 40
C) 92
D) 87
Unlock Deck
Unlock for access to all 274 flashcards in this deck.
Unlock Deck
k this deck
65
Which of the following is the largest contributor to the growth of labor productivity in the United States?
A) technological advance
B) education and training of labor
C) economies of scale
D) improved resource allocation
A) technological advance
B) education and training of labor
C) economies of scale
D) improved resource allocation
Unlock Deck
Unlock for access to all 274 flashcards in this deck.
Unlock Deck
k this deck
66
Other things equal, if a full-employment economy reallocated a substantial quantity of its resources to capital goods, we would expect
A) present consumption to rise.
B) future consumption to fall.
C) a lower rate of growth of real GDP.
D) labor productivity to rise.
A) present consumption to rise.
B) future consumption to fall.
C) a lower rate of growth of real GDP.
D) labor productivity to rise.
Unlock Deck
Unlock for access to all 274 flashcards in this deck.
Unlock Deck
k this deck
67
Economies of scale refers to
A) the idea that proprietorships are less bureaucratic and therefore more efficient than corporations.
B) public investments in highways, schools, utilities, and such.
C) the fact that large producers may be able to use more efficient technologies than smaller producers.
D) the reallocation of labor from less-productive to more-productive uses.
Unlock Deck
Unlock for access to all 274 flashcards in this deck.
Unlock Deck
k this deck
68
The historical reallocation of labor from agriculture to manufacturing in the United States has
A) been inflationary.
B) had no effect on the average productivity of labor.
C) increased the average productivity of labor.
D) reduced the average productivity of labor.
A) been inflationary.
B) had no effect on the average productivity of labor.
C) increased the average productivity of labor.
D) reduced the average productivity of labor.
Unlock Deck
Unlock for access to all 274 flashcards in this deck.
Unlock Deck
k this deck
69
Which of the following would not be expected to increase labor productivity?
A) technological advance
B) the acquisition of more education and training by the labor force
C) an increase in the size of the labor force
D) the realization of economies of scale
A) technological advance
B) the acquisition of more education and training by the labor force
C) an increase in the size of the labor force
D) the realization of economies of scale
Unlock Deck
Unlock for access to all 274 flashcards in this deck.
Unlock Deck
k this deck
70
Other things equal, which of the following would increase the rate of economic growth, as measured by changes in real GDP?
A) a decline in the average length of the workweek
B) a decrease in the labor force participation rate
C) an increase in the size of the working-age population
D) a decline in the amount of capital per worker
A) a decline in the average length of the workweek
B) a decrease in the labor force participation rate
C) an increase in the size of the working-age population
D) a decline in the amount of capital per worker
Unlock Deck
Unlock for access to all 274 flashcards in this deck.
Unlock Deck
k this deck
71
What percentage of the U.S. adult population has at least a high school education (as of 2018)?
A) 31 percent
B) 41 percent
C) 90 percent
D) 99 percent
A) 31 percent
B) 41 percent
C) 90 percent
D) 99 percent
Unlock Deck
Unlock for access to all 274 flashcards in this deck.
Unlock Deck
k this deck
72
Empirical studies suggest that
A) labor productivity has declined throughout U.S. history.
B) technological advances account for about 40 percent of U.S. productivity growth.
C) achieving economies of scale is the most important factor in U.S. economic growth.
D) all U.S. economic growth from between 2001 and 2007 can be attributed to increases in the quantity of labor.
Unlock Deck
Unlock for access to all 274 flashcards in this deck.
Unlock Deck
k this deck
73
Human capital refers to
A) the skills and knowledge that enable a worker to be productive.
B) machinery used by labor in production.
C) the accumulated financial wealth of households.
D) physical capital owned by households rather than businesses.
A) the skills and knowledge that enable a worker to be productive.
B) machinery used by labor in production.
C) the accumulated financial wealth of households.
D) physical capital owned by households rather than businesses.
Unlock Deck
Unlock for access to all 274 flashcards in this deck.
Unlock Deck
k this deck
74
The percentage of U.S. adults with a high school education has
A) remained constant since the 1960s.
B) risen from 8 percent in 1960 to 35 percent in 2018.
C) risen to 100 percent in the 21st century.
D) risen from 44 percent in 1960 to 90 percent in 2018.
A) remained constant since the 1960s.
B) risen from 8 percent in 1960 to 35 percent in 2018.
C) risen to 100 percent in the 21st century.
D) risen from 44 percent in 1960 to 90 percent in 2018.
Unlock Deck
Unlock for access to all 274 flashcards in this deck.
Unlock Deck
k this deck
75
Which of the following statements is correct?
A) Between 1953 and 2018, all growth in U.S. real GDP can be attributed to increases in labor productivity.
B) Between 1953 and 2018, increases in labor productivity account for more of the growth in U.S. real GDP than do increases in the quantity of labor.
C) Between 1953 and 2018, increases in the quantity of labor account for more of the growth in U.S. real GDP than do increases in labor productivity.
D) Between 1953 and 2018, increases in labor productivity and increases in the quantity of labor contributed equally to the growth in U.S. real GDP.
Unlock Deck
Unlock for access to all 274 flashcards in this deck.
Unlock Deck
k this deck
76
Other things equal, which of the following would increase labor productivity the most?
A) The stock of real capital and inputs of labor increase proportionately.
B) The increase in the stock of real capital exceeds the increase in inputs of labor.
C) The increase in inputs of labor exceeds the increase in the stock of real capital.
D) Inputs of labor increase and the stock of real capital remains constant.
Unlock Deck
Unlock for access to all 274 flashcards in this deck.
Unlock Deck
k this deck
77
Globally, on average test scores of eighth-grade math and science students, the U.S. ranks (as of 2015)
A) 5th and 7th, respectively.
B) 1st and 1st, respectively.
C) 10th and 10th, respectively.
D) 8th and 6th, respectively.
A) 5th and 7th, respectively.
B) 1st and 1st, respectively.
C) 10th and 10th, respectively.
D) 8th and 6th, respectively.
Unlock Deck
Unlock for access to all 274 flashcards in this deck.
Unlock Deck
k this deck
78
A nation's infrastructure refers to
A) its ability to realize economies of scale.
B) its stock of technological knowledge.
C) public capital goods such as highways and sanitation systems.
D) the productivity of its labor force.
A) its ability to realize economies of scale.
B) its stock of technological knowledge.
C) public capital goods such as highways and sanitation systems.
D) the productivity of its labor force.
Unlock Deck
Unlock for access to all 274 flashcards in this deck.
Unlock Deck
k this deck
79
The largest contributor to increases in the productivity of American labor is
A) the reallocation of labor from agriculture to manufacturing.
B) improvements in labor quality.
C) increases in the quantity of capital.
D) technological advance.
A) the reallocation of labor from agriculture to manufacturing.
B) improvements in labor quality.
C) increases in the quantity of capital.
D) technological advance.
Unlock Deck
Unlock for access to all 274 flashcards in this deck.
Unlock Deck
k this deck
80
What percentage of the U.S. adult population has a college or post-college education (as of 2018)?
A) 8 percent
B) 35 percent
C) 41 percent
D) 88 percent
A) 8 percent
B) 35 percent
C) 41 percent
D) 88 percent
Unlock Deck
Unlock for access to all 274 flashcards in this deck.
Unlock Deck
k this deck
Unlock Deck
Unlock for access to all 274 flashcards in this deck.


