Deck 17: The Management and Control of Quality
Full screen (f)
Question
Question
Taguchi Loss Function Analysis (Appendix) Flextronchip, an OEM manufacturer, has a fifth-generation chip for cell phones, with chip specification of 0.2 ± 0.0002 mm for the distance between two adjacent pins. The loss due to a defective chip has been estimated as $20.
Required
1. Compute the value of k in the Taguchi loss function.
2. Assume that the quality control manager takes a sample of 100 chips from the production process. The results are as follows:
 a. Calculate the estimated quality loss for each of the observed measurements.
b. Calculate the expected (i.e., average) loss for the production process as a whole.
3. Using the data from (2) above:
a. Determine the variance in the measured distance between two pins.
b. Calculate the expected loss of the process using the calculated variance, per the method presented by Albrecht and Roth, "The Measurement of Quality Costs: An Alternative Paradigm," Accounting Horizons (June 1992), pp. 1527.
Required
1. Compute the value of k in the Taguchi loss function.
2. Assume that the quality control manager takes a sample of 100 chips from the production process. The results are as follows:
a. Calculate the estimated quality loss for each of the observed measurements.b. Calculate the expected (i.e., average) loss for the production process as a whole.
3. Using the data from (2) above:
a. Determine the variance in the measured distance between two pins.
b. Calculate the expected loss of the process using the calculated variance, per the method presented by Albrecht and Roth, "The Measurement of Quality Costs: An Alternative Paradigm," Accounting Horizons (June 1992), pp. 1527.
Question
Control Charts Refer to the background information in Exercise 17-60 for the Destin Company. One of the quality improvements management instituted recently was the use of statistical control charts. Over the most recent 12-week period, you have obtained the following average cycle-time data regarding the valve-production process:
 Required
1. Use Excel to prepare a control chart from the weekly, sequential observations given above. Management has determined that the target performance level for cycle time is 14.0 minutes, and that the upper and lower control limits should be set, respectively, at 16.0 and 12.0 minutes.
2. What is the mean and what is the standard deviation of the 12 manufacturing cycle-time observations
3. What conclusions can you draw about the process, based on the cycle-time data contained in your spreadsheet
4. What is the primary difference between the control chart you produced and what is called a statistical control chart
Required 1. Use Excel to prepare a control chart from the weekly, sequential observations given above. Management has determined that the target performance level for cycle time is 14.0 minutes, and that the upper and lower control limits should be set, respectively, at 16.0 and 12.0 minutes.
2. What is the mean and what is the standard deviation of the 12 manufacturing cycle-time observations
3. What conclusions can you draw about the process, based on the cycle-time data contained in your spreadsheet
4. What is the primary difference between the control chart you produced and what is called a statistical control chart
Question
Benefits of Switching to JIT You have recently been hired as the management accountant for ABC Manufacturing Technologies, Inc. The company produces a broad line of subassemblies that are used in the production of flat-screen TVs and other electronic equipment. Competitive pressures, principally from abroad, have caused the company to reexamine its competitive strategy and associated management accounting and control systems. More to the point, the company feels a pressing need to adopt JIT manufacturing, to improve the quality of its outputs (in response to ever-increasing demands by consumers of electronic products), and to better manage its cost structure.
A year ago ABC acquired, via a five-year lease, new manufacturing equipment, the annual cost of which is $500,000. To support the move to JIT, however, ABC would have to acquire new, computer-controlled manufacturing equipment, the leasing cost of which is estimated at $2 million per year for four years. If the company were to break its existing lease it would incur a one-time penalty of $240,000.
The replacement equipment is expected to provide significant decreases in variable manufacturing cost per unit, from $50 to $35. This reduction is attributed to faster set-up times with the new machine, faster processing speed, a reduction in material waste, and a reduction in direct labor expenses (because of increased automation). In addition, improvements in manufacturing cycle time and improvements in product quality are expected to increase annual sales (in units) by approximately 30 percent (based on a current volume of 40,000 units).
Additional financial information regarding each decision alternative (existing equipment versus replacement equipment) is as follows:
 The increased automation, including computer-based manufacturing controls, associated with the replacement equipment will greatly reduce the need for inventory holdings. The annual inventory-holding cost, based on the company's weighted-average cost of capital, is 15 percent. Based on engineering estimates provided to ABC by the lessor company, all inventory holdings (raw materials, WIP, and finished goods) can safely be cut in half from current levels. Currently, ABC holds, on average, four months of raw materials inventory, three months of WIP inventory, and two months of finished goods inventory-all of which are based on production requirements.
Required
1. Essentially, how is a JIT manufacturing system different from a conventional system
2. What is an appropriate role for management accounting regarding the adoption by a company of a JIT manufacturing system
3. Based on the information presented above, determine the annual financial benefit (including reduction in inventory carrying costs) associated with the proposed move by the company to JIT.
4. Based on an analysis of financial considerations alone, should the company in this situation make the switch to JIT Why or why not
5. What qualitative factors might bear on the decision at hand
A year ago ABC acquired, via a five-year lease, new manufacturing equipment, the annual cost of which is $500,000. To support the move to JIT, however, ABC would have to acquire new, computer-controlled manufacturing equipment, the leasing cost of which is estimated at $2 million per year for four years. If the company were to break its existing lease it would incur a one-time penalty of $240,000.
The replacement equipment is expected to provide significant decreases in variable manufacturing cost per unit, from $50 to $35. This reduction is attributed to faster set-up times with the new machine, faster processing speed, a reduction in material waste, and a reduction in direct labor expenses (because of increased automation). In addition, improvements in manufacturing cycle time and improvements in product quality are expected to increase annual sales (in units) by approximately 30 percent (based on a current volume of 40,000 units).
Additional financial information regarding each decision alternative (existing equipment versus replacement equipment) is as follows:
The increased automation, including computer-based manufacturing controls, associated with the replacement equipment will greatly reduce the need for inventory holdings. The annual inventory-holding cost, based on the company's weighted-average cost of capital, is 15 percent. Based on engineering estimates provided to ABC by the lessor company, all inventory holdings (raw materials, WIP, and finished goods) can safely be cut in half from current levels. Currently, ABC holds, on average, four months of raw materials inventory, three months of WIP inventory, and two months of finished goods inventory-all of which are based on production requirements.Required
1. Essentially, how is a JIT manufacturing system different from a conventional system
2. What is an appropriate role for management accounting regarding the adoption by a company of a JIT manufacturing system
3. Based on the information presented above, determine the annual financial benefit (including reduction in inventory carrying costs) associated with the proposed move by the company to JIT.
4. Based on an analysis of financial considerations alone, should the company in this situation make the switch to JIT Why or why not
5. What qualitative factors might bear on the decision at hand
Question
Question
Question
Question
Question
Question
Question
Question
Net Promoter Score Upon graduation, you and a friend established a computer-consultancy business. Your business has generally been successful, but you and your colleague wish to expand the business significantly over the next three years. You have always assumed that the service your firm rendered to clients was of sterling quality. However, up to this point you have not attempted to measure customer satisfaction. Recently, you prepared and sent to your clients a customer-satisfaction survey that, among other items, asked the following question: "How likely is it that you would recommend our services to a friend or business associate" Customers responded to this question using a 10-point scale, with 10 = "Extremely Likely," 5 = "Neutral/Uncertain," and 1 = "Extremely Unlikely." You received 290 responses to this question, which were as follows:
Required
1. What is meant by the term net promoter score
2. Given the above data (customer responses), calculate the net promoter score for your consulting firm.
3. Of what strategic importance are nonfinancial customer performance measures in general and the net promoter score in particular
Required
1. What is meant by the term net promoter score
2. Given the above data (customer responses), calculate the net promoter score for your consulting firm.
3. Of what strategic importance are nonfinancial customer performance measures in general and the net promoter score in particular
Question
Question
Question
Question
Expected Quality Cost, Confidence Interval, and Sample Size (Requires Chapter 8) Paragon Manufacturing produces small motors for assembly in handheld tools such as chain saws and circular saws. The company recently began manufacturing a new motor, model EZ3, and forecasts an annual demand of 200,000 units for this model.
Each model EZ3 requires a housing manufactured to precise engineering specifications. Paragon purchases these housings, which are not subject to quality control inspection before entering the production process; however, Paragon performance-tests the entire motor after final assembly. During pilot production runs of the new motor, several of the housings had wrong sizes and were rejected. If the housings were too shallow, they could not be assembled correctly; if they were too deep, the motor would not operate properly.
Ross Webster, Paragon's production manager, gathered the following information during the pilot production runs:
• The units that were rejected during performance testing because the housings were too deep had to be torn down and reassembled with new housings. This operation required 1 hour and 15 minutes of additional direct labor for each affected unit.
• The supplier of the housings is willing to take back the defective housings but will refund only one-half of the price. In the future, if Paragon inspects the housings before they enter the assembly process, the supplier will refund the full price of all rejected housings.
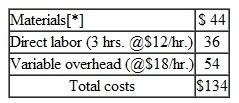
• The costs of model EZ3 follow:
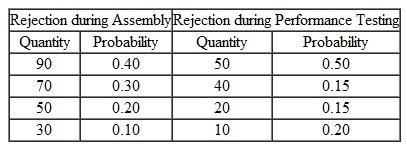
 • The majority of the rejections experienced during the pilot runs were related to the housings. Ross's estimate of the probability of rejections for a lot of 800 housings follows:
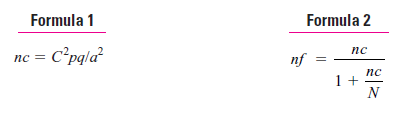
 If Paragon decides to inspect the housings prior to assembly, Ross must select the appropriate sample size by using the following two formulas. The estimated sample size (formula 1) must be modified by the second formula (final sample size) because Ross will be sampling without replacement.
where:
nc = first estimate of sample size
nf = final sample size
C = confidence coefficient
p = maximum rejection rate
q = 1 p
a = precision level
N = number of items in the population
Required
1. Determine the maximum amount that Paragon Manufacturing would be willing to spend annually to implement quality control inspection of the housings before assembly begins. (Check figure: $509,000.)
2. For the purpose of quality control inspection, determine the sample size that Ross should select from a lot of 800 housings if the desired level is 95.5 percent (confidence coefficient 2.00) with a precision of 1 percent and rejections not to exceed 1 percent. (Check figure: 265 Units.)
3. Without prejudice to your answer in requirement 2, for quality control inspection purposes, assume that the sample size is 240 housings and the desired level is 95.5 percent (confidence coefficient 2.00) with a precision of 1 percent and rejections not to exceed 1 percent. Determine whether Ross should accept or reject a lot if there are:
a. Two defective housings in the sample.
b. Three defective housings in the sample. Explain your answer in each situation.
Each model EZ3 requires a housing manufactured to precise engineering specifications. Paragon purchases these housings, which are not subject to quality control inspection before entering the production process; however, Paragon performance-tests the entire motor after final assembly. During pilot production runs of the new motor, several of the housings had wrong sizes and were rejected. If the housings were too shallow, they could not be assembled correctly; if they were too deep, the motor would not operate properly.
Ross Webster, Paragon's production manager, gathered the following information during the pilot production runs:
• The units that were rejected during performance testing because the housings were too deep had to be torn down and reassembled with new housings. This operation required 1 hour and 15 minutes of additional direct labor for each affected unit.
• The supplier of the housings is willing to take back the defective housings but will refund only one-half of the price. In the future, if Paragon inspects the housings before they enter the assembly process, the supplier will refund the full price of all rejected housings.
• The costs of model EZ3 follow:
• The majority of the rejections experienced during the pilot runs were related to the housings. Ross's estimate of the probability of rejections for a lot of 800 housings follows: If Paragon decides to inspect the housings prior to assembly, Ross must select the appropriate sample size by using the following two formulas. The estimated sample size (formula 1) must be modified by the second formula (final sample size) because Ross will be sampling without replacement. where:
nc = first estimate of sample size
nf = final sample size
C = confidence coefficient
p = maximum rejection rate
q = 1 p
a = precision level
N = number of items in the population
Required
1. Determine the maximum amount that Paragon Manufacturing would be willing to spend annually to implement quality control inspection of the housings before assembly begins. (Check figure: $509,000.)
2. For the purpose of quality control inspection, determine the sample size that Ross should select from a lot of 800 housings if the desired level is 95.5 percent (confidence coefficient 2.00) with a precision of 1 percent and rejections not to exceed 1 percent. (Check figure: 265 Units.)
3. Without prejudice to your answer in requirement 2, for quality control inspection purposes, assume that the sample size is 240 housings and the desired level is 95.5 percent (confidence coefficient 2.00) with a precision of 1 percent and rejections not to exceed 1 percent. Determine whether Ross should accept or reject a lot if there are:
a. Two defective housings in the sample.
b. Three defective housings in the sample. Explain your answer in each situation.
Question
Question
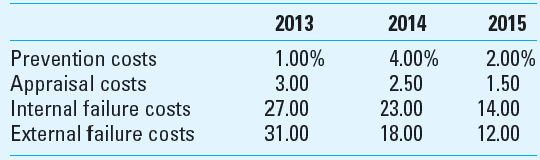
COQ Histogram; Spreadsheet Application Genova Company classifies its costs of quality into four categories. The costs of quality (COQ) as a percentage of cost of goods sold for the last three years are as follows:
Required
1. Use a spreadsheet to prepare a histogram that shows the costs of quality (COQ) trends as a percentage of costs of goods sold.
2. Comment on the trends in cost of quality (COQ) over the three-year period from 2013 to 2015.
3. What cost of quality can the company expect as a percentage of its cost of goods sold in 2016 Explain.
Question
Question
Question
Question
Question
Value-Stream Income Statement The Marshall Company is a large manufacturer of office furniture. The company has recently adopted lean accounting and has identified two value streams- office chairs and office tables. Total sales in the most recent period for the two streams are $245 and $310 million, respectively.
In the most recent accounting period, Marshall had the following operating costs, which were traced to the two value streams as follows (in thousands).
![Value-Stream Income Statement The Marshall Company is a large manufacturer of office furniture. The company has recently adopted lean accounting and has identified two value streams- office chairs and office tables. Total sales in the most recent period for the two streams are $245 and $310 million, respectively. In the most recent accounting period, Marshall had the following operating costs, which were traced to the two value streams as follows (in thousands). In addition to the traceable operating costs, the company had manufacturing costs of $116,750,0( and selling and administrative costs of $25 million that could not be traced to either value stream Due to the implementation of lean methods, the firm has been able to reduce inventory in both val streams significantly and has calculated the fixed cost of prior period inventory that is included the current income statement to be $5.5 million for the office chair stream and $22.5 million for t] office table stream. Required Prepare the value stream income statement for Marshall Company.<div style=padding-top: 35px>](https://d2lvgg3v3hfg70.cloudfront.net/SM1604/11eb7c27_d5a0_40a6_9ab5_597e2000440e_SM1604_00.jpg) In addition to the traceable operating costs, the company had manufacturing costs of $116,750,0( and selling and administrative costs of $25 million that could not be traced to either value stream Due to the implementation of lean methods, the firm has been able to reduce inventory in both val streams significantly and has calculated the fixed cost of prior period inventory that is included the current income statement to be $5.5 million for the office chair stream and $22.5 million for t] office table stream.
In addition to the traceable operating costs, the company had manufacturing costs of $116,750,0( and selling and administrative costs of $25 million that could not be traced to either value stream Due to the implementation of lean methods, the firm has been able to reduce inventory in both val streams significantly and has calculated the fixed cost of prior period inventory that is included the current income statement to be $5.5 million for the office chair stream and $22.5 million for t] office table stream.
Required Prepare the value stream income statement for Marshall Company.
In the most recent accounting period, Marshall had the following operating costs, which were traced to the two value streams as follows (in thousands).
In addition to the traceable operating costs, the company had manufacturing costs of $116,750,0( and selling and administrative costs of $25 million that could not be traced to either value stream Due to the implementation of lean methods, the firm has been able to reduce inventory in both val streams significantly and has calculated the fixed cost of prior period inventory that is included the current income statement to be $5.5 million for the office chair stream and $22.5 million for t] office table stream.Required Prepare the value stream income statement for Marshall Company.
Question
Question
Question
Question
Question
Question
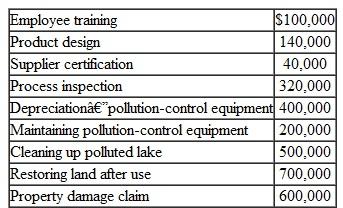
Cost of Environmental Quality Repor t You are given the following environmental quality-related costs:
 Required
1. Prepare a cost of environmental quality report for the year. Determine subtotals for each of the four reporting categories and express each subtotal as a percentage of total operating expenses ($10,000,000) for the year.
2. Based on the report you prepare, what conclusions can you draw regarding the company's environmental quality performance for the year
3. Can you offer management suggestions for the design of an effective cost of environmental quality reporting system (That is, what would make for a good reporting system)
Required 1. Prepare a cost of environmental quality report for the year. Determine subtotals for each of the four reporting categories and express each subtotal as a percentage of total operating expenses ($10,000,000) for the year.
2. Based on the report you prepare, what conclusions can you draw regarding the company's environmental quality performance for the year
3. Can you offer management suggestions for the design of an effective cost of environmental quality reporting system (That is, what would make for a good reporting system)
Question
Taguchi Loss Function Analysis (Appendix) North Platt Machinery Company manufactures a shaft that must fit inside a sleeve. The firm has just received an order of 50,000 units from South-ernstar Exploration Company for $80 per unit. North Platt can manufacture the shaft at $50 per unit. Southernstar desires the diameter of the shaft to be 1.275 cm. The diameter of the shaft must not be less than 1.25 cm, in order to fit properly inside the sleeve. To be able to insert the shaft into a sleeve without the use of force, the diameter cannot be larger than 1.30 cm. A defective shaft is discarded and a replacement has to be shipped via express freight to locations around the world. North Platt estimates that the average cost of handling and shipping a replacement shaft will be approximately $70. Shown below are the diameters from a sample of 80 shafts manufactured during a trial run.
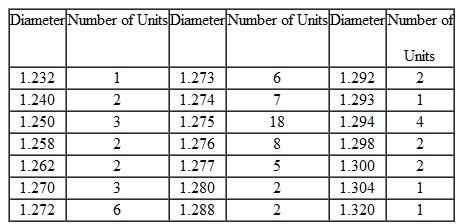 Required Set up an Excel spreadsheet that uses a Taguchi loss function to determine:
1. The expected loss from this process.
2. The diameter tolerance that should be set for the manufacture of the shaft.
Required Set up an Excel spreadsheet that uses a Taguchi loss function to determine:1. The expected loss from this process.
2. The diameter tolerance that should be set for the manufacture of the shaft.
Question
Question
Question
Question
Question
Question
Listed below are selected items from the cost-of-quality (COQ) report for Watson Products for last month.
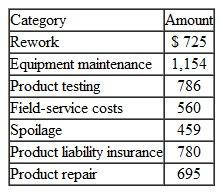 What is Watson's total prevention and appraisal cost for the month
What is Watson's total prevention and appraisal cost for the month Question
Relevant Cost Analysis-Conversion to JIT As part of its commitment to quality, the J. J. Borden manufacturing company is proposing to introduce just-in-time (JIT) production methods. Managers of the company have an intuitive feel regarding the financial benefits associated with a change to JIT, but they would like to have some data to inform their decision making in this regard. You are provided with the following data:
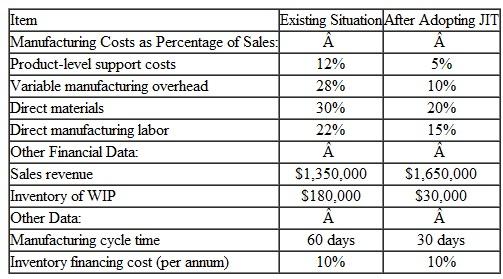 Required You have been asked, in conjunction with your position as the management accountant for the company, to construct an Excel spreadsheet that can be used to estimate the financial benefits associated with the adoption of JIT.
Required You have been asked, in conjunction with your position as the management accountant for the company, to construct an Excel spreadsheet that can be used to estimate the financial benefits associated with the adoption of JIT. Question
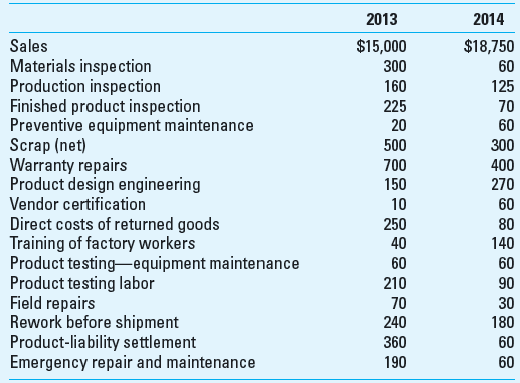
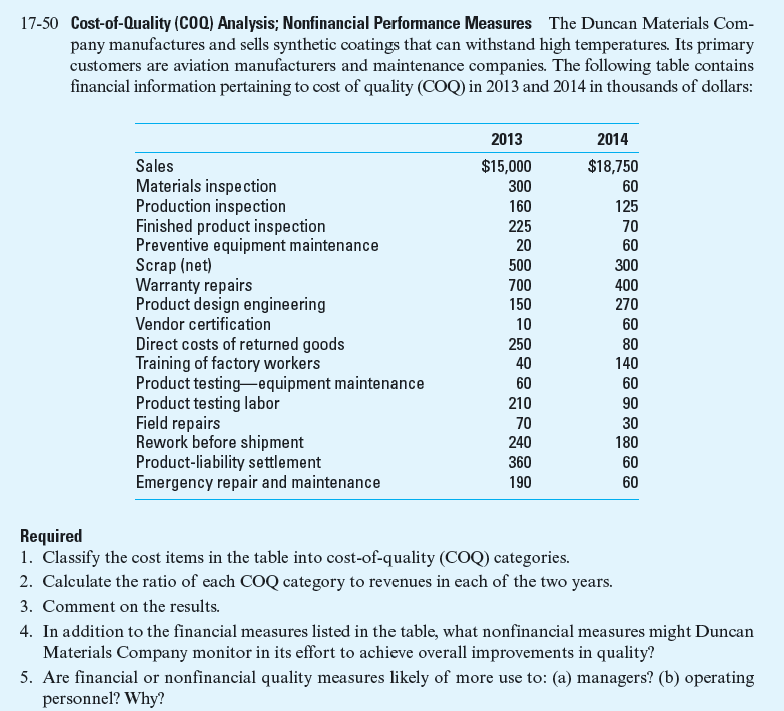
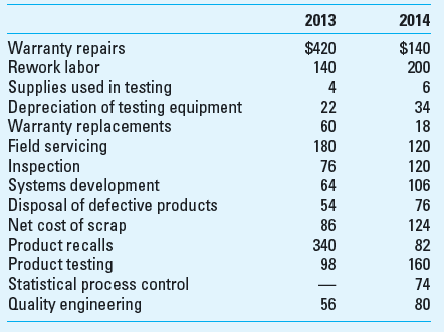
Cost-of-Quality (COQ) Analysis; Nonfinancial Performance Measures The Duncan Materials Company manufactures and sells synthetic coatings that can withstand high temperatures. Its primary customers are aviation manufacturers and maintenance companies. The following table contains financial information pertaining to cost of quality (COQ) in 2013 and 2014 in thousands of dollars:
Required
1. Classify the cost items in the table into cost-of-quality (COQ) categories.
2. Calculate the ratio of each COQ category to revenues in each of the two years.
3. Comment on the results.
4. In addition to the financial measures listed in the table, what nonfinancial measures might Duncan Materials Company monitor in its effort to achieve overall improvements in quality
5. Are financial or nonfinancial quality measures likely of more use to: (a) managers (b) operating personnel Why
Question
Question
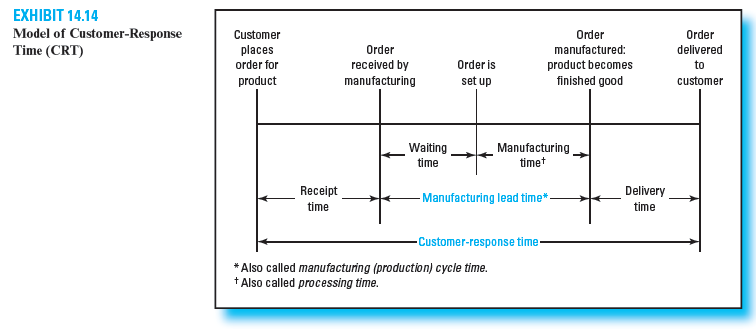
A customer's order is delivered (received by the customer) on December 1, 2013. This order was placed with the company on September 1, 2013, and received by the manufacturing department on September 15, 2013. Actual production on the order began on October 15, 2013, and was completed November 15, 2013. Based on this information, calculate the following for this order: total customer-response time (CRT); order receipt time; manufacturing lead time (processing time); manufacturing wait time; manufacturing time; and delivery time. ( Hint: Refer to Exhibit 14.14.) Prepare your answers in days.
Reference:
Reference:
Question
Question
Cost-of-Quality (COQ) Analysis; Spreadsheet Application Use the data in Problem 17-50 and a spreadsheet to complete this problem. Use the spreadsheet functions to carry out all calculations. Do not hard-code or carry out calculations elsewhere and type in the calculated amounts.
1. Determine the information you'll need to generate a cost-of-quality (COQ) report and set up a spreadsheet for this information. Among the items to be included in the COQ report are proper headings of the report, revenue and cost items (cost items should be in the cost-of-quality category), and cost as a percentage of revenues for each of the two years.
2. Input the data provided in 17-50 into the spreadsheet by COQ category.
3. Enter functions or steps to calculate the total amount for each COQ category and the total COQ. Do not hard-code or type in the amounts.
4. Enter functions or steps to calculate the total cost of each COQ category as a percentage of revenues for each of the years. Use two digits after the decimal point for the percentages. Do the same for the total COQ. Do not hard-code or type in the amounts.
5. Move to another area of the spreadsheet or use a fresh sheet and title the area "Cost of Quality Trend Analysis." Enter functions or steps for the percentages; do not hard-code or type in the amounts.
6. Create a bar chart to compare the percentages of each of the COQ categories and the total COQ in 2013 and 2014.
7. Do a sensitivity analysis by making the following changes to the 2014 amounts:
• Increase the total sales by 5%.
• Increase total prevention cost by 6%.
• Decrease total internal failure cost by 60%.
• Decrease total external failure cost by 50%.
Required What is the total COQ as a percentage of total sales
Reference:
Question
Question
In 2014 a manufacturing company instituted a total quality management (TQM) program producing the comparative report shown below:
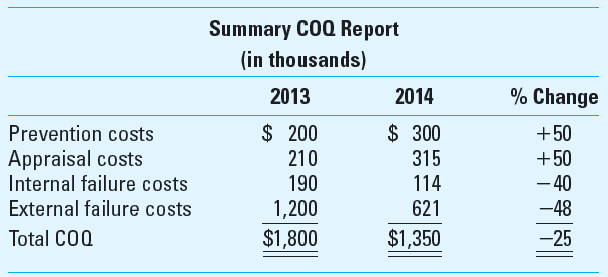
On the basis of this report, which one of the following statements is most likely correct
a. An increase in conformance costs resulted in a higher-quality product and, therefore, a decrease in nonconformance costs.
b. An increase in inspection costs was solely responsible for the decrease in quality costs.
c. Quality costs such as scrap and rework decreased by 48%.
Question
Question
Question
Question
Question
Question
Cost-of-Quality (COQ) Reporting; Spreadsheet Application Carrie Lee, the president of Lee Enterprises, was concerned about the results of her company's new quality control efforts. "Maybe the emphasis we've placed on upgrading our quality control system will pay off in the long run, but it doesn't seem to be helping us much right now. I thought improved quality would give a real boost to sales, but sales have remained flat at about $10,000,000 for the last two years." Lee Enterprises has seen its market share decline in recent years because of increased foreign competition. An intensive effort to strengthen the quality control system was initiated a year ago (on January 1, 2014) in the hope that better quality would strengthen the company's competitive position and reduce warranty and servicing costs. The following costs (in thousands) relate to quality and quality control over the last two years:
Required
1. Prepare a spreadsheet that produces a cost-of-quality (COQ) report for both 2013 and 2014. Carry percentage computations to two decimal places.
2. Use your spreadsheet to prepare a histogram showing the distribution of the various quality costs by category. ( Note: Your histogram should include results for both 2013 and 2014.)
3. Prepare a written evaluation to accompany the reports you have prepared in requirements 1 and 2. This evaluation should discuss the distribution of quality costs in the company, changes in this distribution that you detect have taken place over the last year, and any other information you believe would be useful to management.
4. A member of the management team believes that employees will be more conscientious in their work if they are held responsible for mistakes. He suggests that workers should do rework on their own time and that they also should pay for disposal of defective units and the cost of scraps. The proposal estimates that the firm can save another $400,000 in quality costs and the employees are less likely to make as many errors. Should the firm implement the proposal Why or why not
Question
Question
Question
Question
Question
Question
Question
Pareto Diagram (Chart) The following causes of absenteeism for a fellow student are for the year just completed:
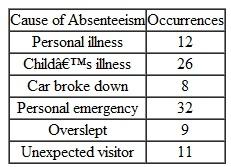 Required Construct a Pareto diagram (chart). In conjunction with the framework presented in Exhibit 17.2 what role is played by the use of these diagrams
Required Construct a Pareto diagram (chart). In conjunction with the framework presented in Exhibit 17.2 what role is played by the use of these diagrams Question
Question
Question
Question
Relevant Cost Analysis-Quality Improvements Destin Company produces water control valves, made of brass, which they sell primarily to builders for use in commercial real estate construction. These valves must meet rigid specifications (i.e., the quality tolerance is small). Valves that, upon inspection, get rejected are returned to the Casting Department, i.e., to stage one of the four-stage manufacturing process. Rejected items are melted and then recast. As such, no new materials in Casting are required to rework these items. However, new materials must be added in the Finishing Department for all reworked valves. As the cost accountant for the company, you have prepared the following cost data regarding the production of a typical valve:
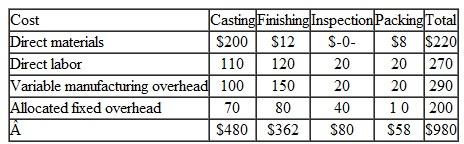 The company, spurred by intense price pressures from foreign manufacturers, recently initiated a number of quality programs. As a result, the rejection rate for valves has decreased from 5.0 percent to 3.5 percent of annual output (equal in total to 15,000 units). The reduction in reject rates has enabled the company to reduce its inventory holdings from $400,000 to $250,000. Destin estimates that the annual financing cost associated with inventory holdings is 12 percent.
Required Provide a dollar estimate of the annual cost savings associated with the recently enacted quality improvements. Show calculations.
The company, spurred by intense price pressures from foreign manufacturers, recently initiated a number of quality programs. As a result, the rejection rate for valves has decreased from 5.0 percent to 3.5 percent of annual output (equal in total to 15,000 units). The reduction in reject rates has enabled the company to reduce its inventory holdings from $400,000 to $250,000. Destin estimates that the annual financing cost associated with inventory holdings is 12 percent.Required Provide a dollar estimate of the annual cost savings associated with the recently enacted quality improvements. Show calculations.
Question
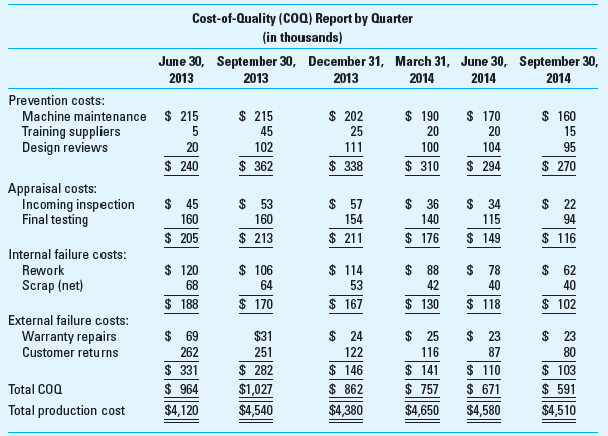
Analyzing Cost-of-Quality (COQ) Reports Bergen Inc. produces telephone equipment at its Georgia plant. In recent years, the company's market share has been eroded by stiff competition from Asian and European competitors. Price and product quality are the two key areas in which companies compete in this market.
Jerry Holman, Bergen's president, decided to devote more resources to the improvement of product quality after learning that, in a 2011 survey of telephone equipment users, his company's products had been ranked fourth in product quality. He believed that Bergen could no longer afford to ignore the importance of product quality. Jerry set up a task force (that he headed) to implement a formal quality-improvement program. Included on the task force were representatives from engineering, sales, customer service, production, and accounting because Jerry believed that this is a companywide program and that all employees should share the responsibility for its success.
After the first task-force meeting, Sheila Haynes, manager of sales, asked Tony Reese, production manager, what he thought of the proposed program. Tony replied, "I have reservations. Quality is too abstract to be attaching costs to it and then to be holding you and me responsible for cost improvements. I like to work with goals that I can see and count! I don't like my annual bonus to be based on a decrease in quality costs; there are too many variables that we have no control over!"
Bergen's quality-improvement program has been in operation for 18 months, and the following cost report was recently issued.
As they were reviewing the report, Sheila asked Tony what he thought of the quality program now. "The work is really moving through the production department," replied Reese. "We used to spend time helping the customer service department solve its problems, but they are leaving us alone these days. I have no complaints so far. I'll be anxious to see how much the program increases our bonuses."
Required
1. Identify at least three factors that should be present for an organization to successfully implement a quality improvement program.
2. By analyzing the cost-of-quality (COQ) report presented, determine whether Bergen's quality improvement program has been successful. ( Hint: You might want to focus on the oldest quarter and on the most recent quarter.) List specific evidence to support your answer.
3. Discuss why Tony Reese's current reaction to the quality-improvement program is more favorable than his initial reaction.
4. Jerry Holman believed that the quality-improvement program was essential and that Bergen could no longer afford to ignore the importance of product quality. Discuss how Bergen could measure the opportunity cost of not implementing the quality-improvement program.
5. Comment on the following statement: "COQ reports allow an organization to focus on the reduction or elimination of non-value-added costs of quality."

Unlock Deck
Sign up to unlock the cards in this deck!
Unlock Deck
Unlock Deck
1/62
Play
Full screen (f)
Deck 17: The Management and Control of Quality
1
Of the four categories in a COQ report, which category of quality cost is the most damaging to the organization Why is this the case
Management and Control of Quality
Quality is explained as a term associated with customer satisfaction. It is the total level of satisfaction any customer gets from any organization's products or service. There are two components of quality- Design Quality and Performance Quality. There are various approaches to setting quality related expectations and among those alternatives one is the Cost of Quality (COQ) Reporting. It provides relevant cost and revenue data used for decision-making purposes.
Discussion and analysis
Among the four categories of quality costs, External failure costs are the costs which are the most damaging to the organization. There are some costs in this category like for example product liability lawsuits which can be huge in relation to out-of-pocket terms. Other costs in this category are also related to loss of reputation or loss of market share associated with the customer dissatisfaction. These costs are referred to as opportunity costs which are also significant in dollar terms.
2
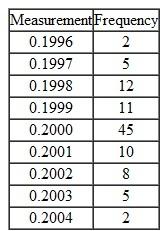
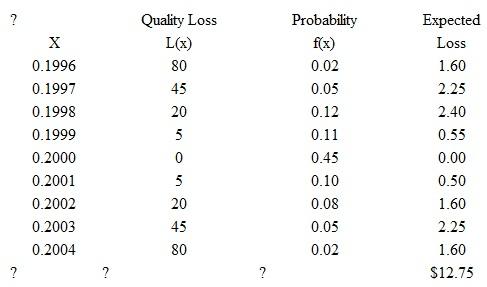
Taguchi Loss Function Analysis (Appendix) Flextronchip, an OEM manufacturer, has a fifth-generation chip for cell phones, with chip specification of 0.2 ± 0.0002 mm for the distance between two adjacent pins. The loss due to a defective chip has been estimated as $20.
Required
1. Compute the value of k in the Taguchi loss function.
2. Assume that the quality control manager takes a sample of 100 chips from the production process. The results are as follows:
a. Calculate the estimated quality loss for each of the observed measurements.
b. Calculate the expected (i.e., average) loss for the production process as a whole.
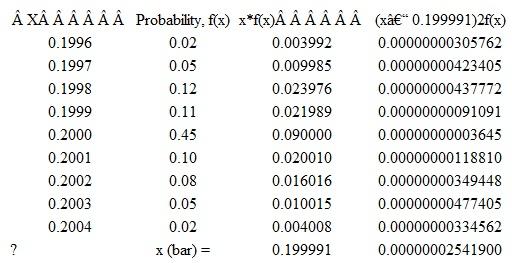
3. Using the data from (2) above:
a. Determine the variance in the measured distance between two pins.
b. Calculate the expected loss of the process using the calculated variance, per the method presented by Albrecht and Roth, "The Measurement of Quality Costs: An Alternative Paradigm," Accounting Horizons (June 1992), pp. 1527.
Required
1. Compute the value of k in the Taguchi loss function.
2. Assume that the quality control manager takes a sample of 100 chips from the production process. The results are as follows:
a. Calculate the estimated quality loss for each of the observed measurements.b. Calculate the expected (i.e., average) loss for the production process as a whole.
3. Using the data from (2) above:
a. Determine the variance in the measured distance between two pins.
b. Calculate the expected loss of the process using the calculated variance, per the method presented by Albrecht and Roth, "The Measurement of Quality Costs: An Alternative Paradigm," Accounting Horizons (June 1992), pp. 1527.
1.Value of k , the cost coefficient, in the Taguchi Loss Function, L( x ):
L(x) = k ( x - T) 2
k = $20/0.0002 2
= $20/0.00000004 = $500,000,000
2.Expected Loss Using Taguchi Function:
 3.Expected Loss Using Variance Data (see table below), per Albrecht and Roth, "The Measurement of Quality Costs: An Alternative Paradigm," Accounting Horizons (June 1992), pp. 15-27:
a. D 2 = (0.199991 - 0.2) 2 , where 0.20 = target value and 0.199991 = x (bar)
= mean value of the quality characteristic
= 0.000000000081
b. = $500,000,000 x (0.000000025419 + 0.000000000081)
= $12.75
L(x) = k ( x - T) 2
k = $20/0.0002 2
= $20/0.00000004 = $500,000,000
2.Expected Loss Using Taguchi Function:
3.Expected Loss Using Variance Data (see table below), per Albrecht and Roth, "The Measurement of Quality Costs: An Alternative Paradigm," Accounting Horizons (June 1992), pp. 15-27:a. D 2 = (0.199991 - 0.2) 2 , where 0.20 = target value and 0.199991 = x (bar)
= mean value of the quality characteristic
= 0.000000000081
b. = $500,000,000 x (0.000000025419 + 0.000000000081)
= $12.75
3
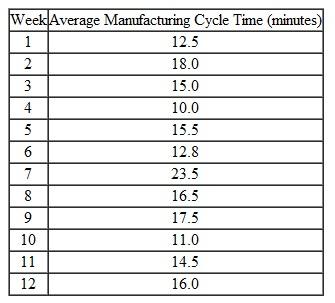
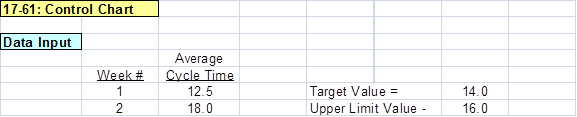
Control Charts Refer to the background information in Exercise 17-60 for the Destin Company. One of the quality improvements management instituted recently was the use of statistical control charts. Over the most recent 12-week period, you have obtained the following average cycle-time data regarding the valve-production process:
Required
1. Use Excel to prepare a control chart from the weekly, sequential observations given above. Management has determined that the target performance level for cycle time is 14.0 minutes, and that the upper and lower control limits should be set, respectively, at 16.0 and 12.0 minutes.
2. What is the mean and what is the standard deviation of the 12 manufacturing cycle-time observations
3. What conclusions can you draw about the process, based on the cycle-time data contained in your spreadsheet
4. What is the primary difference between the control chart you produced and what is called a statistical control chart
Required 1. Use Excel to prepare a control chart from the weekly, sequential observations given above. Management has determined that the target performance level for cycle time is 14.0 minutes, and that the upper and lower control limits should be set, respectively, at 16.0 and 12.0 minutes.
2. What is the mean and what is the standard deviation of the 12 manufacturing cycle-time observations
3. What conclusions can you draw about the process, based on the cycle-time data contained in your spreadsheet
4. What is the primary difference between the control chart you produced and what is called a statistical control chart
1.Control Chart-Manufacturing Cycle Times (Weekly Data)
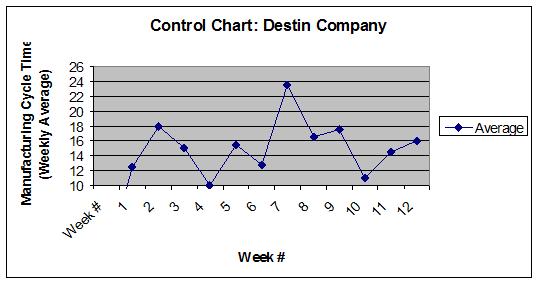 2.The target cycle time is 14.0 minutes; the lower control limit is 12.0 minutes and the upper control limit is 16.0 minutes. As indicated in the accompanying Excel file, the mean of the 12 weekly observations is 15.2, while the sample standard deviation is 3.6 minutes (which seems high).
Note : An Excel spreadsheet solution file for this exercise is embedded in this document. You can open the spreadsheet "object" that follows by doing the following:
1.Right click anywhere in the worksheet area below.
2.Select "worksheet object" and then select "Open."
3.To return to the Word document, select "File" and then "Close and return to..." while you are in the spreadsheet mode. The screen should then return you to the Word document.
 3.As indicated in part (2), the mean of the sample observations (15.2) is not that far from the target value (14.0). However, inspection of the control chart suggests wide variability in the process, which is confirmed by the sample standard deviation of the 12 observations around the mean value of the dataset. As well, we note that five of the 12 observations lie outside of the control limits (3 exceed the upper control limit, while 2 are below the lower control limit); also, one observation is (16) is one the control limit. The control of process variability is one of the key goals of quality improvement. It may be the case that the underlying process in this case needs to be investigated in order to determine why there seems to be so much variability in weekly cycle times. Perhaps some type of intervention/correction is warranted.
4.Management can determine the upper and lower control limits on their control charts through experience (e.g., trial and error) or through the use of statistical procedures. When these control limits are determined statistically (based on process variability, measured either by standard deviations or on the range of observations over time), the control chart is referred to as a statistical control chart. Thus, the principal difference between the two types of charts is the method used to construct the control limits.
2.The target cycle time is 14.0 minutes; the lower control limit is 12.0 minutes and the upper control limit is 16.0 minutes. As indicated in the accompanying Excel file, the mean of the 12 weekly observations is 15.2, while the sample standard deviation is 3.6 minutes (which seems high).Note : An Excel spreadsheet solution file for this exercise is embedded in this document. You can open the spreadsheet "object" that follows by doing the following:
1.Right click anywhere in the worksheet area below.
2.Select "worksheet object" and then select "Open."
3.To return to the Word document, select "File" and then "Close and return to..." while you are in the spreadsheet mode. The screen should then return you to the Word document.
3.As indicated in part (2), the mean of the sample observations (15.2) is not that far from the target value (14.0). However, inspection of the control chart suggests wide variability in the process, which is confirmed by the sample standard deviation of the 12 observations around the mean value of the dataset. As well, we note that five of the 12 observations lie outside of the control limits (3 exceed the upper control limit, while 2 are below the lower control limit); also, one observation is (16) is one the control limit. The control of process variability is one of the key goals of quality improvement. It may be the case that the underlying process in this case needs to be investigated in order to determine why there seems to be so much variability in weekly cycle times. Perhaps some type of intervention/correction is warranted.4.Management can determine the upper and lower control limits on their control charts through experience (e.g., trial and error) or through the use of statistical procedures. When these control limits are determined statistically (based on process variability, measured either by standard deviations or on the range of observations over time), the control chart is referred to as a statistical control chart. Thus, the principal difference between the two types of charts is the method used to construct the control limits.
4
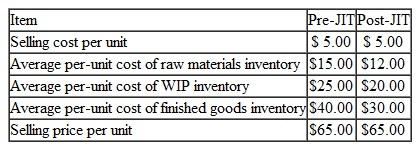
Benefits of Switching to JIT You have recently been hired as the management accountant for ABC Manufacturing Technologies, Inc. The company produces a broad line of subassemblies that are used in the production of flat-screen TVs and other electronic equipment. Competitive pressures, principally from abroad, have caused the company to reexamine its competitive strategy and associated management accounting and control systems. More to the point, the company feels a pressing need to adopt JIT manufacturing, to improve the quality of its outputs (in response to ever-increasing demands by consumers of electronic products), and to better manage its cost structure.
A year ago ABC acquired, via a five-year lease, new manufacturing equipment, the annual cost of which is $500,000. To support the move to JIT, however, ABC would have to acquire new, computer-controlled manufacturing equipment, the leasing cost of which is estimated at $2 million per year for four years. If the company were to break its existing lease it would incur a one-time penalty of $240,000.
The replacement equipment is expected to provide significant decreases in variable manufacturing cost per unit, from $50 to $35. This reduction is attributed to faster set-up times with the new machine, faster processing speed, a reduction in material waste, and a reduction in direct labor expenses (because of increased automation). In addition, improvements in manufacturing cycle time and improvements in product quality are expected to increase annual sales (in units) by approximately 30 percent (based on a current volume of 40,000 units).
Additional financial information regarding each decision alternative (existing equipment versus replacement equipment) is as follows:
The increased automation, including computer-based manufacturing controls, associated with the replacement equipment will greatly reduce the need for inventory holdings. The annual inventory-holding cost, based on the company's weighted-average cost of capital, is 15 percent. Based on engineering estimates provided to ABC by the lessor company, all inventory holdings (raw materials, WIP, and finished goods) can safely be cut in half from current levels. Currently, ABC holds, on average, four months of raw materials inventory, three months of WIP inventory, and two months of finished goods inventory-all of which are based on production requirements.
Required
1. Essentially, how is a JIT manufacturing system different from a conventional system
2. What is an appropriate role for management accounting regarding the adoption by a company of a JIT manufacturing system
3. Based on the information presented above, determine the annual financial benefit (including reduction in inventory carrying costs) associated with the proposed move by the company to JIT.
4. Based on an analysis of financial considerations alone, should the company in this situation make the switch to JIT Why or why not
5. What qualitative factors might bear on the decision at hand
A year ago ABC acquired, via a five-year lease, new manufacturing equipment, the annual cost of which is $500,000. To support the move to JIT, however, ABC would have to acquire new, computer-controlled manufacturing equipment, the leasing cost of which is estimated at $2 million per year for four years. If the company were to break its existing lease it would incur a one-time penalty of $240,000.
The replacement equipment is expected to provide significant decreases in variable manufacturing cost per unit, from $50 to $35. This reduction is attributed to faster set-up times with the new machine, faster processing speed, a reduction in material waste, and a reduction in direct labor expenses (because of increased automation). In addition, improvements in manufacturing cycle time and improvements in product quality are expected to increase annual sales (in units) by approximately 30 percent (based on a current volume of 40,000 units).
Additional financial information regarding each decision alternative (existing equipment versus replacement equipment) is as follows:
The increased automation, including computer-based manufacturing controls, associated with the replacement equipment will greatly reduce the need for inventory holdings. The annual inventory-holding cost, based on the company's weighted-average cost of capital, is 15 percent. Based on engineering estimates provided to ABC by the lessor company, all inventory holdings (raw materials, WIP, and finished goods) can safely be cut in half from current levels. Currently, ABC holds, on average, four months of raw materials inventory, three months of WIP inventory, and two months of finished goods inventory-all of which are based on production requirements.Required
1. Essentially, how is a JIT manufacturing system different from a conventional system
2. What is an appropriate role for management accounting regarding the adoption by a company of a JIT manufacturing system
3. Based on the information presented above, determine the annual financial benefit (including reduction in inventory carrying costs) associated with the proposed move by the company to JIT.
4. Based on an analysis of financial considerations alone, should the company in this situation make the switch to JIT Why or why not
5. What qualitative factors might bear on the decision at hand
Unlock Deck
Unlock for access to all 62 flashcards in this deck.
Unlock Deck
k this deck
5
From a design standpoint, what are some desirable characteristics of a cost of quality (COQ) reporting system That is, if you were to design such a system from scratch, what would the key attributes of the system be
Unlock Deck
Unlock for access to all 62 flashcards in this deck.
Unlock Deck
k this deck
6
Using Taguchi Loss Function to Determine Tolerance (Appendix) The desired distance for Flextronchip customers is 0.2 mm between two adjacent pins. Any deviation from this value causes interference. The process of handling complaints costs the firm at least $40 per chip. The engineers of the firm expect the average customer will be likely to complain when the distance is off target by at least 0.0001. At the factory, the adjustment can be made at a cost of $1.60, which includes the labor to make the adjustment and additional testing.
Required What should the tolerance be before an adjustment is made at the factory
Required What should the tolerance be before an adjustment is made at the factory
Unlock Deck
Unlock for access to all 62 flashcards in this deck.
Unlock Deck
k this deck
7
Using Run Charts to Examine Process Stability All processes illustrate some variation (in quality, conformance to specification, etc.). One hallmark of a quality process is stability. As noted in the text, both control charts and run charts (as well as histograms) can be used to examine process stability. In this exercise you are provided with some information regarding loan processing times at a bank (for an individual loan officer) over a 20-day period. In sequential order, these data are as follows: 90, 73, 62, 88, 47, 68, 87, 68, 50, 69, 26, 78, 80, 30, 32, 73, 60, 50, 36, and 89.
Required
1. Use Excel to plot the above data, in time-series fashion.
2. What is meant by the term process stability
3. What techniques might you use to support a conclusion as to whether or not this process is stable
Required
1. Use Excel to plot the above data, in time-series fashion.
2. What is meant by the term process stability
3. What techniques might you use to support a conclusion as to whether or not this process is stable
Unlock Deck
Unlock for access to all 62 flashcards in this deck.
Unlock Deck
k this deck
8
Environmental Performance: Meeting Stakeholder Expectations How important to stakeholders is environmental performance (e.g., management of greenhouse gas emissions) of publicly listed companies This issue is addressed in the following short piece: D. C. Esty, "What Stakeholders Demand," Harvard Business Review (October 2007), pp. 30, 34, which can be accessed as background reading for the following set of questions.
1. What are the primary stakeholders that would be interested in corporate disclosures regarding environmental performance
2. Go to the following Web site (www.climatecounts.org/scorecard_overview.php) and obtain information regarding the "scorecard" that this organization has developed to rate environmental performance. What are the 22 criteria used by Climate Counts to rate corporate environmental performance
3. In the electronics industry group, what distinguishes the environmental performance of IBM versus Apple Computer according to the scorecard used by Climate Counts
4. Provide arguments as to likely consequences of companies that fail to meet stakeholder expectations regarding environmental performance.
5. What strategic role can the management accountant assume as regards corporate environmental performance
Unlock Deck
Unlock for access to all 62 flashcards in this deck.
Unlock Deck
k this deck
9
Name and briefly describe three methods that companies can use to either identify or correct quality problems.
Unlock Deck
Unlock for access to all 62 flashcards in this deck.
Unlock Deck
k this deck
10
Taguchi Loss Function Analysis (Appendix) Duramold specializes in manufacturing molded pla tic panels to be fitted on car doors. The blueprint specification for the thickness of a high-demai model calls for 0.1875 ± 0.0025 inch. It costs $120 to manufacture and $150 to scrap a part that do not meet these specifications. The thickness measure for the unit just completed is 0.1893 inch.
Required
1. Use the Taguchi Loss Function, L( x ), to determine:
a. The value of the cost coefficient, k
b. The amount of loss for the unit, L ( x = 0.1893)
2. Assume that Duramold can eliminate the uneven thickness by adding a production worker, at the critic
production point, for $6 per unit. Under this assumption:
a. At what tolerance should the panels be manufactured Show calculations.
b. What should be the production specification for these panels
Unlock Deck
Unlock for access to all 62 flashcards in this deck.
Unlock Deck
k this deck
11
Benefits and Challenges of Lean Much discussion at your organization recently has centered on the notion of lean. In preparation for an upcoming meeting of senior managers, across business functions, you have been asked to prepare an explanatory memo. Your memo should address, at a minimum, the following issues: (1) the definition of lean, (2) strategic value of adopting lean principles for your organization, (3) anticipated costs of moving to lean, (4) implications for cost-system design, and (5) sources for additional information regarding these issues.
Required Prepare, in good form, a memo for management that addresses the preceding issues. In responding to this assignment, please access and read the following Statement of Management Accounting: Accounting for the Lean Enterprise: Major Changes to the Accounting Paradigm. Montvale, NJ: Institute of Management Accountants, 2006. (Accessible on the Web at the following address: www.imanet.org/pub-lications_statements. asp#C.)
Required Prepare, in good form, a memo for management that addresses the preceding issues. In responding to this assignment, please access and read the following Statement of Management Accounting: Accounting for the Lean Enterprise: Major Changes to the Accounting Paradigm. Montvale, NJ: Institute of Management Accountants, 2006. (Accessible on the Web at the following address: www.imanet.org/pub-lications_statements. asp#C.)
Unlock Deck
Unlock for access to all 62 flashcards in this deck.
Unlock Deck
k this deck
12
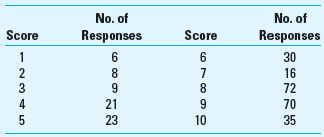
Net Promoter Score Upon graduation, you and a friend established a computer-consultancy business. Your business has generally been successful, but you and your colleague wish to expand the business significantly over the next three years. You have always assumed that the service your firm rendered to clients was of sterling quality. However, up to this point you have not attempted to measure customer satisfaction. Recently, you prepared and sent to your clients a customer-satisfaction survey that, among other items, asked the following question: "How likely is it that you would recommend our services to a friend or business associate" Customers responded to this question using a 10-point scale, with 10 = "Extremely Likely," 5 = "Neutral/Uncertain," and 1 = "Extremely Unlikely." You received 290 responses to this question, which were as follows:
Required
1. What is meant by the term net promoter score
2. Given the above data (customer responses), calculate the net promoter score for your consulting firm.
3. Of what strategic importance are nonfinancial customer performance measures in general and the net promoter score in particular
Required
1. What is meant by the term net promoter score
2. Given the above data (customer responses), calculate the net promoter score for your consulting firm.
3. Of what strategic importance are nonfinancial customer performance measures in general and the net promoter score in particular
Unlock Deck
Unlock for access to all 62 flashcards in this deck.
Unlock Deck
k this deck
13
A customer places an order on January 1, 2013. Ten days later that order is received by the manufacturing department. Fifteen days later, the order is put into production. Processing (manufacturing) time is 20 days for this order. The completed order is then shipped 10 days later. For this order, what was the total customer-response time (CRT)
Unlock Deck
Unlock for access to all 62 flashcards in this deck.
Unlock Deck
k this deck
14
Graphical Depiction: Is There an Optimal Level of Spending on Quality, or Is Quality "Free" Some proponents of TQM assert that quality is free, that is, that quality is a never-ending quest and that improving product/service quality will reduce a firm's total spending on quality. Others believe that after a point there are diminishing returns to additional expenditures on quality. Provide a graphical representation of each of these arguments. ( Hint: Let the vertical axis of your graph represent $ (e.g., revenues or costs), and let the horizontal axis represent the level of quality-the higher the value, on the x-axis, the greater the indicated quality level.) Supplement your graphs with appropriate explanations/interpretations.
Unlock Deck
Unlock for access to all 62 flashcards in this deck.
Unlock Deck
k this deck
15
Implementation of Lean Accounting Watlow Electric Manufacturing Company introduced lean principles in 2005 and reported a successful implementation in 2008. Watlow began with the implementation of lean principles and then adopted value stream management (VSM) using the value stream income statement. As expected, the use of VSM achieved better decision making (previously the firm had treated direct labor as a pure variable cost that varied with volume; after VSM it was clear that the behavior of labor costs was far more complex), reduced inventory, reduced cycle times, and improved communication and coordination among employees. It was this latter result, better communication, that surprised Watlow management, as employees began to work as teams that focused on the key success factors for the firm. The steps taken by Watlow to implement lean included:
• Identify the main value streams of the company (Watlow selected value streams consisting of 25-150 employees each; more than 90% of the company's employees were assigned to a value stream)
• Determine the key measures for achieving the company's strategic goals (these included measures of quality, safety, on-time delivery, and cost)
• The accounting system was adapted to VSM, including changes in the accounting for materials, labor and overhead
Required Given the implementation of lean as described above, what do you see as the challenges ahead
for Watlow What features of lean accounting have yet to be implemented
Unlock Deck
Unlock for access to all 62 flashcards in this deck.
Unlock Deck
k this deck
16
Expected Quality Cost, Confidence Interval, and Sample Size (Requires Chapter 8) Paragon Manufacturing produces small motors for assembly in handheld tools such as chain saws and circular saws. The company recently began manufacturing a new motor, model EZ3, and forecasts an annual demand of 200,000 units for this model.
Each model EZ3 requires a housing manufactured to precise engineering specifications. Paragon purchases these housings, which are not subject to quality control inspection before entering the production process; however, Paragon performance-tests the entire motor after final assembly. During pilot production runs of the new motor, several of the housings had wrong sizes and were rejected. If the housings were too shallow, they could not be assembled correctly; if they were too deep, the motor would not operate properly.
Ross Webster, Paragon's production manager, gathered the following information during the pilot production runs:
• The units that were rejected during performance testing because the housings were too deep had to be torn down and reassembled with new housings. This operation required 1 hour and 15 minutes of additional direct labor for each affected unit.
• The supplier of the housings is willing to take back the defective housings but will refund only one-half of the price. In the future, if Paragon inspects the housings before they enter the assembly process, the supplier will refund the full price of all rejected housings.
• The costs of model EZ3 follow:
• The majority of the rejections experienced during the pilot runs were related to the housings. Ross's estimate of the probability of rejections for a lot of 800 housings follows:
If Paragon decides to inspect the housings prior to assembly, Ross must select the appropriate sample size by using the following two formulas. The estimated sample size (formula 1) must be modified by the second formula (final sample size) because Ross will be sampling without replacement.
where:
nc = first estimate of sample size
nf = final sample size
C = confidence coefficient
p = maximum rejection rate
q = 1 p
a = precision level
N = number of items in the population
Required
1. Determine the maximum amount that Paragon Manufacturing would be willing to spend annually to implement quality control inspection of the housings before assembly begins. (Check figure: $509,000.)
2. For the purpose of quality control inspection, determine the sample size that Ross should select from a lot of 800 housings if the desired level is 95.5 percent (confidence coefficient 2.00) with a precision of 1 percent and rejections not to exceed 1 percent. (Check figure: 265 Units.)
3. Without prejudice to your answer in requirement 2, for quality control inspection purposes, assume that the sample size is 240 housings and the desired level is 95.5 percent (confidence coefficient 2.00) with a precision of 1 percent and rejections not to exceed 1 percent. Determine whether Ross should accept or reject a lot if there are:
a. Two defective housings in the sample.
b. Three defective housings in the sample. Explain your answer in each situation.
Each model EZ3 requires a housing manufactured to precise engineering specifications. Paragon purchases these housings, which are not subject to quality control inspection before entering the production process; however, Paragon performance-tests the entire motor after final assembly. During pilot production runs of the new motor, several of the housings had wrong sizes and were rejected. If the housings were too shallow, they could not be assembled correctly; if they were too deep, the motor would not operate properly.
Ross Webster, Paragon's production manager, gathered the following information during the pilot production runs:
• The units that were rejected during performance testing because the housings were too deep had to be torn down and reassembled with new housings. This operation required 1 hour and 15 minutes of additional direct labor for each affected unit.
• The supplier of the housings is willing to take back the defective housings but will refund only one-half of the price. In the future, if Paragon inspects the housings before they enter the assembly process, the supplier will refund the full price of all rejected housings.
• The costs of model EZ3 follow:
• The majority of the rejections experienced during the pilot runs were related to the housings. Ross's estimate of the probability of rejections for a lot of 800 housings follows: If Paragon decides to inspect the housings prior to assembly, Ross must select the appropriate sample size by using the following two formulas. The estimated sample size (formula 1) must be modified by the second formula (final sample size) because Ross will be sampling without replacement. where:
nc = first estimate of sample size
nf = final sample size
C = confidence coefficient
p = maximum rejection rate
q = 1 p
a = precision level
N = number of items in the population
Required
1. Determine the maximum amount that Paragon Manufacturing would be willing to spend annually to implement quality control inspection of the housings before assembly begins. (Check figure: $509,000.)
2. For the purpose of quality control inspection, determine the sample size that Ross should select from a lot of 800 housings if the desired level is 95.5 percent (confidence coefficient 2.00) with a precision of 1 percent and rejections not to exceed 1 percent. (Check figure: 265 Units.)
3. Without prejudice to your answer in requirement 2, for quality control inspection purposes, assume that the sample size is 240 housings and the desired level is 95.5 percent (confidence coefficient 2.00) with a precision of 1 percent and rejections not to exceed 1 percent. Determine whether Ross should accept or reject a lot if there are:
a. Two defective housings in the sample.
b. Three defective housings in the sample. Explain your answer in each situation.
Unlock Deck
Unlock for access to all 62 flashcards in this deck.
Unlock Deck
k this deck
17
On average, the manufacturing (processing) time spent per order is approximately four days. In addition, a typical order spends four days moving from process to process, three days in storage, and two days in inspection. For an average order, what is the manufacturing cycle efficiency
Unlock Deck
Unlock for access to all 62 flashcards in this deck.
Unlock Deck
k this deck
18
COQ Histogram; Spreadsheet Application Genova Company classifies its costs of quality into four categories. The costs of quality (COQ) as a percentage of cost of goods sold for the last three years are as follows:
Required
1. Use a spreadsheet to prepare a histogram that shows the costs of quality (COQ) trends as a percentage of costs of goods sold.
2. Comment on the trends in cost of quality (COQ) over the three-year period from 2013 to 2015.
3. What cost of quality can the company expect as a percentage of its cost of goods sold in 2016 Explain.
Required
1. Use a spreadsheet to prepare a histogram that shows the costs of quality (COQ) trends as a percentage of costs of goods sold.
2. Comment on the trends in cost of quality (COQ) over the three-year period from 2013 to 2015.
3. What cost of quality can the company expect as a percentage of its cost of goods sold in 2016 Explain.
Unlock Deck
Unlock for access to all 62 flashcards in this deck.
Unlock Deck
k this deck
19
Toyota: Keeping It Lean Toyota has grown to become the largest auto manufacturer in the world, with plants located around the world. In 2005-2007 the company hired 40,000 new employees to keep up with this growth. A challenge for Toyota during times of growth is to make sure that the new hires effectively become part of the company's culture, including the Toyota Production System which guides the flow of product through Toyota's plants. The new hires must also learn the Toyota Way, an eight-step method for decision making. Toyota's new managers go through extensive training at the Toyota Institute in Japan. Even veteran Toyota managers are required to go back to the Institute for training when they get a promotion. Concerned about the decline in quality in recent years, Toyota has redoubled its efforts in training and has begun to hire back some retired workers in Japan. New entry-level employees are trained at Toyota Technical Institutes located around the world.
Required Why is training so important for Toyota
Required Why is training so important for Toyota
Unlock Deck
Unlock for access to all 62 flashcards in this deck.
Unlock Deck
k this deck
20
Constructing and Interpreting a Control Chart As indicated in the text, various tools from operations management and statistics are used to help support Six Sigma goals and process improvements in a lean environment. One such tool is a control chart-a key element used to assess statistical process control (SPC). You are given the following error rates for a loan-processing activity at a bank: 2.8, 2.4, 2.4, 4.2, 1.8, 2.8, 3.8, 3.4, 3.2, 3.2, 2.2, 1.6, 1.4, 1.4, 2.4, 1.8, 2.6, 2.0, 2.4, 2.4, 2.2, 2.8, and 2.4.
Required
1. Define the term control chart. What is the difference between a control chart and a run chart What do these charts have in common
2. Use the data on error rates to construct a control chart for the loan-processing operation. Although there are various ways to construct the chart (see any text on Operations Management or Quality Control for details), define the upper-control limit (UCL) of your chart as the mean plus 2 standard deviations; define the lower-control limit (LCL) of your chart as the mean less 2 standard deviations. (In each case, use the sample standard deviation for the data set at hand.)
3. Supply an interpretation of the control limits you established above in (2).
4. What techniques can be used to judge, using a control chart, whether a process is in statistical control
5. Control charts were developed many years ago for application in the manufacturing sector. However, these charts can be used in other contexts as well. What quality measure might you collect, for use in a control chart, for each of the following nonmanufacturing settings: hospital, insurance company, hotel, and local police department
Unlock Deck
Unlock for access to all 62 flashcards in this deck.
Unlock Deck
k this deck
21
For a typical order, assume the following times (in hours): storage time (in between processes), 5.0; inspection time, 1.0; move time (from process to process), 2.0; and manufacturing (processing) time, 8.0. Given this information, what is the manufacturing cycle efficiency
Unlock Deck
Unlock for access to all 62 flashcards in this deck.
Unlock Deck
k this deck
22
Quality Cost Classification
Required Classify each of the following costs into one of the four quality cost (i.e., COQ) categories:
1. Materials, labor, and overhead costs of scrapped units.
2. Engineering time spent to determine the causes of failures to meet product specification.
3. Wages and salaries for the time spent by workers to gather quality measurements.
4. Information systems costs expended to develop data requirements.
5. Clerical staff expenses to coordinate training programs.
6. Salaries for members of problem-solving teams.
7. Payment to settle a product-liability lawsuit.
Unlock Deck
Unlock for access to all 62 flashcards in this deck.
Unlock Deck
k this deck
23
Value-Stream Income Statement The Marshall Company is a large manufacturer of office furniture. The company has recently adopted lean accounting and has identified two value streams- office chairs and office tables. Total sales in the most recent period for the two streams are $245 and $310 million, respectively.
In the most recent accounting period, Marshall had the following operating costs, which were traced to the two value streams as follows (in thousands).
In addition to the traceable operating costs, the company had manufacturing costs of $116,750,0( and selling and administrative costs of $25 million that could not be traced to either value stream Due to the implementation of lean methods, the firm has been able to reduce inventory in both val streams significantly and has calculated the fixed cost of prior period inventory that is included the current income statement to be $5.5 million for the office chair stream and $22.5 million for t] office table stream.
Required Prepare the value stream income statement for Marshall Company.
In the most recent accounting period, Marshall had the following operating costs, which were traced to the two value streams as follows (in thousands).
In addition to the traceable operating costs, the company had manufacturing costs of $116,750,0( and selling and administrative costs of $25 million that could not be traced to either value stream Due to the implementation of lean methods, the firm has been able to reduce inventory in both val streams significantly and has calculated the fixed cost of prior period inventory that is included the current income statement to be $5.5 million for the office chair stream and $22.5 million for t] office table stream.Required Prepare the value stream income statement for Marshall Company.
Unlock Deck
Unlock for access to all 62 flashcards in this deck.
Unlock Deck
k this deck
24
Research Activity: Applying Lean Principles to Knowledge Work Can lean principles be applied to so-called knowledge work This issue is addressed in the following article: B. R. Stats and D. M. Upton, "Lean Knowledge Work," Harvard Business Review (October 2011), pp. 101-10. After accessing and reading this article, respond to the following set of questions.
Required
1. Define what is meant by the term lean (or lean management ). To date, what types of organizations have successfully applied lean Why have these contexts proven fruitful for the application of lean
2. According to the authors, what is meant by the term knowledge work Why is it more difficult/ challenging to apply lean principles to this work context
3. Based on their own research, what do the authors claim to be the primary benefits of applying lean principles to knowledge work
4. Based on their experience with over 1,800 projects, the authors developed six principles that they say could be used to guide the implementation of lean to knowledge work (such as software an IT-development projects). Provide an overview of each of these principles.
Unlock Deck
Unlock for access to all 62 flashcards in this deck.
Unlock Deck
k this deck
25
(Appendix): Solidtronic, Inc., an OEM manufacturer, has a product specification of 75 +/ 5. The cost for warranty services is estimated as $500 per unit. What is the value of k, the cost coefficient, in the Taguchi loss function
Unlock Deck
Unlock for access to all 62 flashcards in this deck.
Unlock Deck
k this deck
26
Cost of Environmental Quality Reporting This chapter includes an overview of a cost-of-quality (COQ) reporting system. Such a system has, in fact, been applied in practice by a number of companies. This exercise pertains to the application of a COQ reporting framework to environmental management.
1. What motivation is there to implement an environmental accounting and control system
2. Construct a sample environmental cost-of-quality report using the four categories that comprise a traditional COQ report (i.e., prevention costs, appraisal/detection costs, internal failure costs, and external failure costs).
3. Do you think firms would be motivated to provide to shareholders information contained in the environmental COQ report you propose above in (2) Why or why not
Unlock Deck
Unlock for access to all 62 flashcards in this deck.
Unlock Deck
k this deck
27
Ethics Keystone Electronics Corporation (KEC) is an eight-year-old company that has developed a process to produce highly reliable electronic components at a cost well below the established competition. In seeking to expand its overall components business KEC decided to enter the facsimile equipment business as there was a niche for lower-priced facsimile machines in a vigorously growing marketplace. The market KEC pursued consisted of small regional businesses not yet approached by the larger vendors. KEC sells its machines with a one-year warranty and has established a maintenance force to handle machine breakdowns.
As KEC customers learned of the benefits of fax transmissions, some increased their usage significantly. After six months, large-volume users began experiencing breakdowns, and the field technicians' portable test equipment was not sophisticated enough to detect hairline breaks in the electronic circuitry caused by the heavier-than-expected usage. Consequently, field technicians were required to replace the damaged components and return the defective ones to the company for further testing.
This situation caused an increase in maintenance costs, which added to the cost of the product. Unfortunately, there was no way to determine how many of the businesses would become heavy users and be subject to breakdowns. Some of the heavier-volume users began switching to the more expensive machines available from the larger competitors. Although new sales orders masked the loss of heavier-volume customers, the increased maintenance costs had an unfavorable impact on earnings. In her recent report prepared for the quarterly meeting of the board of directors, Mary Stein, KEC's assistant controller, summarized this situation and its anticipated affect on earnings.
Jim March, vice president of manufacturing, is concerned that the report does not provide any solutions to the problem. He asked Maria Sanchez, the controller, to have the matter deferred so that his engineering staff could work on the problem. He believes that the electronic components can be redesigned. This redesigned model, while more costly, could be an appropriate solution for the heavier-volume users, who should not expect a low-cost model to serve their anticipated needs. March expects that the board could decide to discontinue the product line if no immediate solution is available, and the company could miss a potentially profitable opportunity. March further believes that the tone of the report places his organization in an unfavorable light.
The controller called Stein into her office and asked her to suppress the part of the formal report related to the component failures. Sanchez asked Stein to just cover it orally at the meeting, noting that "engineering is working with marketing on the situation to reach a satisfactory solution." Stein feels strongly that the board will be misinformed about a potentially serious impact on earnings if she follows the advice of Sanchez.
Required
1. Refer to the IMA's Statement of Ethical Professional Practice (www.imanet.org). Explain why the request from Maria Sanchez to Mary Stein is unethical. Cite both actions and nonactions on the part of Sanchez that result in an unethical situation.
2. Identify steps that Mary Stein should follow to resolve the situation.
Unlock Deck
Unlock for access to all 62 flashcards in this deck.
Unlock Deck
k this deck
28
Refer to the information in 17-15. Calculate the estimated total cost when the measured quality characteristic, x (e.g., circumference, measured in inches), is 78.
Reference:
Solidtronic, Inc., an OEM manufacturer, has a product specification of 75 + /- 5. The cost for warranty services is estimated as $500 per unit. What is the value of k, the cost coefficient, in the Taguchi loss function for this situation
Reference:
Solidtronic, Inc., an OEM manufacturer, has a product specification of 75 + /- 5. The cost for warranty services is estimated as $500 per unit. What is the value of k, the cost coefficient, in the Taguchi loss function for this situation
Unlock Deck
Unlock for access to all 62 flashcards in this deck.
Unlock Deck
k this deck
29
Cost of Environmental Quality Repor t You are given the following environmental quality-related costs:
Required
1. Prepare a cost of environmental quality report for the year. Determine subtotals for each of the four reporting categories and express each subtotal as a percentage of total operating expenses ($10,000,000) for the year.
2. Based on the report you prepare, what conclusions can you draw regarding the company's environmental quality performance for the year
3. Can you offer management suggestions for the design of an effective cost of environmental quality reporting system (That is, what would make for a good reporting system)
Required 1. Prepare a cost of environmental quality report for the year. Determine subtotals for each of the four reporting categories and express each subtotal as a percentage of total operating expenses ($10,000,000) for the year.
2. Based on the report you prepare, what conclusions can you draw regarding the company's environmental quality performance for the year
3. Can you offer management suggestions for the design of an effective cost of environmental quality reporting system (That is, what would make for a good reporting system)
Unlock Deck
Unlock for access to all 62 flashcards in this deck.
Unlock Deck
k this deck
30
Taguchi Loss Function Analysis (Appendix) North Platt Machinery Company manufactures a shaft that must fit inside a sleeve. The firm has just received an order of 50,000 units from South-ernstar Exploration Company for $80 per unit. North Platt can manufacture the shaft at $50 per unit. Southernstar desires the diameter of the shaft to be 1.275 cm. The diameter of the shaft must not be less than 1.25 cm, in order to fit properly inside the sleeve. To be able to insert the shaft into a sleeve without the use of force, the diameter cannot be larger than 1.30 cm. A defective shaft is discarded and a replacement has to be shipped via express freight to locations around the world. North Platt estimates that the average cost of handling and shipping a replacement shaft will be approximately $70. Shown below are the diameters from a sample of 80 shafts manufactured during a trial run.
Required Set up an Excel spreadsheet that uses a Taguchi loss function to determine:
1. The expected loss from this process.
2. The diameter tolerance that should be set for the manufacture of the shaft.
Required Set up an Excel spreadsheet that uses a Taguchi loss function to determine:1. The expected loss from this process.
2. The diameter tolerance that should be set for the manufacture of the shaft.
Unlock Deck
Unlock for access to all 62 flashcards in this deck.
Unlock Deck
k this deck
31
Provide a brief explanation of the conceptual relationship between improvements in quality and improvements in financial performance.
Unlock Deck
Unlock for access to all 62 flashcards in this deck.
Unlock Deck
k this deck
32
(Appendix): Refer to the information in 17-34. What is the expected loss (cost) per unit if the manufacturing process is centered on the target specification with a standard deviation of 2
Unlock Deck
Unlock for access to all 62 flashcards in this deck.
Unlock Deck
k this deck
33
Cost-of-Quality Improvement-Relevant Cost Analysis PIM Industries, Inc., manufactures electronics components. Each unit costs $30 before the final test. The final test rejects, on average, 5 percent of the 50,000 units manufactured per year. The average rejection rate of the industry is 3 percent. A consultant has determined that poor lighting is the most likely cause of this high rejection rate. It would cost $100,000 to install adequate lighting in the assembly department, which would be useful for 5 years. With adequate lighting that will cost an additional $5,000 in operating cost each year, the firm expects to reduce its rejection rate to no higher than the industry average.
Required
1. Should the firm install the lighting (show calculations)
2. What other considerations might affect this decision
3. What is the primary role of the management accountant in this decision context
Required
1. Should the firm install the lighting (show calculations)
2. What other considerations might affect this decision
3. What is the primary role of the management accountant in this decision context
Unlock Deck
Unlock for access to all 62 flashcards in this deck.
Unlock Deck
k this deck
34
Research Assignment, Strategy Obtain from your library a copy of following article: John H. Flemming, Curt Coffman, and James K. Harter, "Manage Your Human Sigma," Harvard Business Review (July-August, 2005), pp. 107-114. The authors of this article state (p. 114): "Ask any CEO to list his or her most pressing business challenges, and you will no doubt hear concerns about customer and employee retention, authentic and sustainable growth, eroding margins, and cost efficiencies.... We are confident that measuring and managing two simple factors- employee and customer engagement-can lead to breakthrough improvements in all aspects of your business."
Required After reading the above-referenced article, answer the following questions:
1. What is the general issue addressed by the authors of this article That is, what managerial problem are they discussing
2. How, conceptually, is the Human Sigma approach developed by the authors of this article similar to or distinct from Six Sigma
3. How do the authors propose to measure the effectiveness of the employee-customer encounter What evidence do they offer regarding the predictive value of the performance metric they are proposing
4. According to the authors, what strategies can an organization use to improve the quality of the employee-customer encounter
Unlock Deck
Unlock for access to all 62 flashcards in this deck.
Unlock Deck
k this deck
35
Define quality. For management and control purposes, define the two primary components of quality.
Unlock Deck
Unlock for access to all 62 flashcards in this deck.
Unlock Deck
k this deck
36
Listed below are selected items from the cost-of-quality (COQ) report for Watson Products for last month.
What is Watson's total prevention and appraisal cost for the month
What is Watson's total prevention and appraisal cost for the month Unlock Deck
Unlock for access to all 62 flashcards in this deck.
Unlock Deck
k this deck
37
Relevant Cost Analysis-Conversion to JIT As part of its commitment to quality, the J. J. Borden manufacturing company is proposing to introduce just-in-time (JIT) production methods. Managers of the company have an intuitive feel regarding the financial benefits associated with a change to JIT, but they would like to have some data to inform their decision making in this regard. You are provided with the following data:
Required You have been asked, in conjunction with your position as the management accountant for the company, to construct an Excel spreadsheet that can be used to estimate the financial benefits associated with the adoption of JIT.
Required You have been asked, in conjunction with your position as the management accountant for the company, to construct an Excel spreadsheet that can be used to estimate the financial benefits associated with the adoption of JIT. Unlock Deck
Unlock for access to all 62 flashcards in this deck.
Unlock Deck
k this deck
38
Cost-of-Quality (COQ) Analysis; Nonfinancial Performance Measures The Duncan Materials Company manufactures and sells synthetic coatings that can withstand high temperatures. Its primary customers are aviation manufacturers and maintenance companies. The following table contains financial information pertaining to cost of quality (COQ) in 2013 and 2014 in thousands of dollars:
Required
1. Classify the cost items in the table into cost-of-quality (COQ) categories.
2. Calculate the ratio of each COQ category to revenues in each of the two years.
3. Comment on the results.
4. In addition to the financial measures listed in the table, what nonfinancial measures might Duncan Materials Company monitor in its effort to achieve overall improvements in quality
5. Are financial or nonfinancial quality measures likely of more use to: (a) managers (b) operating personnel Why
Required
1. Classify the cost items in the table into cost-of-quality (COQ) categories.
2. Calculate the ratio of each COQ category to revenues in each of the two years.
3. Comment on the results.
4. In addition to the financial measures listed in the table, what nonfinancial measures might Duncan Materials Company monitor in its effort to achieve overall improvements in quality
5. Are financial or nonfinancial quality measures likely of more use to: (a) managers (b) operating personnel Why
Unlock Deck
Unlock for access to all 62 flashcards in this deck.
Unlock Deck
k this deck
39
In what respect are traditional accounting systems deficient in terms of the goal of managing and controlling quality
Unlock Deck
Unlock for access to all 62 flashcards in this deck.
Unlock Deck
k this deck
40
A customer's order is delivered (received by the customer) on December 1, 2013. This order was placed with the company on September 1, 2013, and received by the manufacturing department on September 15, 2013. Actual production on the order began on October 15, 2013, and was completed November 15, 2013. Based on this information, calculate the following for this order: total customer-response time (CRT); order receipt time; manufacturing lead time (processing time); manufacturing wait time; manufacturing time; and delivery time. ( Hint: Refer to Exhibit 14.14.) Prepare your answers in days.
Reference:
Reference:
Unlock Deck
Unlock for access to all 62 flashcards in this deck.
Unlock Deck
k this deck
41
Quality Ratings-Graduate Business Programs You can see from the discussion in the text that quality-ratings, and quality-award programs, exist for various types of businesses and organizations. Some of you may be contemplating enrolling in an MBA program upon completion of your undergraduate studies. It might interest you, therefore, that graduate business programs in this country and abroad are ranked by a number of publications, including The Wall Street Journal, Business Week, the Financial Times, the Economist, and U.S. News World Report. To some extent, these sources use different measures to determine their quality rankings. Develop a list of criteria that could be used to generate quality rankings of graduate business programs.
Unlock Deck
Unlock for access to all 62 flashcards in this deck.
Unlock Deck
k this deck
42
Cost-of-Quality (COQ) Analysis; Spreadsheet Application Use the data in Problem 17-50 and a spreadsheet to complete this problem. Use the spreadsheet functions to carry out all calculations. Do not hard-code or carry out calculations elsewhere and type in the calculated amounts.
1. Determine the information you'll need to generate a cost-of-quality (COQ) report and set up a spreadsheet for this information. Among the items to be included in the COQ report are proper headings of the report, revenue and cost items (cost items should be in the cost-of-quality category), and cost as a percentage of revenues for each of the two years.
2. Input the data provided in 17-50 into the spreadsheet by COQ category.
3. Enter functions or steps to calculate the total amount for each COQ category and the total COQ. Do not hard-code or type in the amounts.
4. Enter functions or steps to calculate the total cost of each COQ category as a percentage of revenues for each of the years. Use two digits after the decimal point for the percentages. Do the same for the total COQ. Do not hard-code or type in the amounts.
5. Move to another area of the spreadsheet or use a fresh sheet and title the area "Cost of Quality Trend Analysis." Enter functions or steps for the percentages; do not hard-code or type in the amounts.
6. Create a bar chart to compare the percentages of each of the COQ categories and the total COQ in 2013 and 2014.
7. Do a sensitivity analysis by making the following changes to the 2014 amounts:
• Increase the total sales by 5%.
• Increase total prevention cost by 6%.
• Decrease total internal failure cost by 60%.
• Decrease total external failure cost by 50%.
Required What is the total COQ as a percentage of total sales
Reference:
1. Determine the information you'll need to generate a cost-of-quality (COQ) report and set up a spreadsheet for this information. Among the items to be included in the COQ report are proper headings of the report, revenue and cost items (cost items should be in the cost-of-quality category), and cost as a percentage of revenues for each of the two years.
2. Input the data provided in 17-50 into the spreadsheet by COQ category.
3. Enter functions or steps to calculate the total amount for each COQ category and the total COQ. Do not hard-code or type in the amounts.
4. Enter functions or steps to calculate the total cost of each COQ category as a percentage of revenues for each of the years. Use two digits after the decimal point for the percentages. Do the same for the total COQ. Do not hard-code or type in the amounts.
5. Move to another area of the spreadsheet or use a fresh sheet and title the area "Cost of Quality Trend Analysis." Enter functions or steps for the percentages; do not hard-code or type in the amounts.
6. Create a bar chart to compare the percentages of each of the COQ categories and the total COQ in 2013 and 2014.
7. Do a sensitivity analysis by making the following changes to the 2014 amounts:
• Increase the total sales by 5%.
• Increase total prevention cost by 6%.
• Decrease total internal failure cost by 60%.
• Decrease total external failure cost by 50%.
Required What is the total COQ as a percentage of total sales
Reference:
Unlock Deck
Unlock for access to all 62 flashcards in this deck.
Unlock Deck
k this deck
43
Describe the major elements of a comprehensive framework for managing and controlling quality, such as the framework presented in Exhibit 17.2.
Unlock Deck
Unlock for access to all 62 flashcards in this deck.
Unlock Deck
k this deck
44
In 2014 a manufacturing company instituted a total quality management (TQM) program producing the comparative report shown below:
On the basis of this report, which one of the following statements is most likely correct
a. An increase in conformance costs resulted in a higher-quality product and, therefore, a decrease in nonconformance costs.
b. An increase in inspection costs was solely responsible for the decrease in quality costs.
c. Quality costs such as scrap and rework decreased by 48%.
Unlock Deck
Unlock for access to all 62 flashcards in this deck.
Unlock Deck
k this deck
45
Spotting Quality in Business Programs Through its accreditation function, AACSB International (www.aacsb.edu) seeks continuous quality improvement in the content, delivery, and administration of management education. The AACSB in fact accredits business programs, at both the undergraduate and graduate levels, based on an overall assessment of the quality of these programs. As a student, you may have formed some thoughts regarding how to spot quality in a business-degree program. If you were in charge of developing accreditation standards for business-degree programs, what specific measures of quality would you include That is, how would you spot quality in terms of a business-degree program
Unlock Deck
Unlock for access to all 62 flashcards in this deck.
Unlock Deck
k this deck
46
Ethics Jan Williams was recently hired as assistant controller of GroChem, Inc., which processes chemicals for use in fertilizers. Williams was selected for this position because of her past experience in the chemical processing field. During her first month on the job, Williams made a point of getting to know the people responsible for the plant operations and learning how things are done at GroChem.
During a conversation with the plant supervisor, Williams asked about the company procedures for handling toxic waste materials. The plant supervisor replied that he was not involved with the disposal of wastes and suggested that Williams might be wise to simply ignore the issue. This response strengthened the resolve of Williams to probe the area further, to be sure that the company was not vulnerable to litigation.
Upon further investigation, Williams discovered evidence that GroChem was suing a nearby residential landfill to dump toxic wastes. It appeared that some members of GroChem's management team were aware of this situation and, in fact, may have been involved in arranging for this dumping; however, Williams was unable to determine whether her superior, the controller, was involved.
Uncertain as to how she should proceed, Williams began to consider her options by outlining the following three alternative courses of action:
1. Seek the advice of her superior, the controller.
2. Anonymously release the information to the local newspaper.
3. Discuss the situation with an outside member of the board of directors, with whom Williams is acquainted.
Required
1. Explain how the use of a cost-of-quality (COQ) reporting framework can facilitate better managerial control and decision making regarding environmental costs and potential liabilities.
2. Discuss why Jan Williams has an ethical responsibility to take some action in the matter of GroChem, Inc., and the dumping of toxic wastes. Refer to the specific ethical standards contained in the IMA's Statement of Ethical Professional Practice (www.imanet.org) to support your answer.
3. For each of the three alternative courses of action that Jan Williams has outlined, explain whether or not the action is consistent with the ethical standards referred to above.
4. Without prejudice to your answer to (3), assume that Jan Williams sought the advice of her superior, the controller, and discovered that the controller was involved in the decision to dump the toxic waste produced by the company. Refer to the IMA's Statement of Ethical Professional Practice and describe steps that Williams should take to resolve the situation.
Unlock Deck
Unlock for access to all 62 flashcards in this deck.
Unlock Deck
k this deck
47
What is meant by Six Sigma What five steps are usually associated with Six Sigma applications
Unlock Deck
Unlock for access to all 62 flashcards in this deck.
Unlock Deck
k this deck
48
Assume that a plasma TV company is working at a three-sigma level of quality in terms of each of 100 component parts in each TV it manufactures. Because of the high price associated with these TV sets, the company defines a product defect as any unit with one or more defective components. (That is, a good-quality output is defined as a TV set with zero defective parts.) On average, what is the probability of producing a unit with zero defects (Show calculations.)
Unlock Deck
Unlock for access to all 62 flashcards in this deck.
Unlock Deck
k this deck
49
Nonfinancial (Operational) Control Measures: Environmental Performance Assume that the company for which you are working is interested in implementing a comprehensive monitoring and control system regarding environmental performance. The company is convinced that improved performance in this area will lead to reduced costs, an improved corporate image, greater market share, and ultimately to greater financial returns. To supplement a number of financial-performance indicators in the area of environmental quality, the company is interested in developing a set of nonfinancial performance indicators, which (it is hoped) will motivate better environmental quality. In this regard, the company has embraced five strategic objectives: minimize hazardous materials; minimize raw/virgin materials usage; minimize energy requirements; minimize release of residues into the environment; and maximize opportunities to recycle. For each of these five strategic objectives, provide at least two relevant nonfinancial performance indicators that could lead to improved environmental performance.
Unlock Deck
Unlock for access to all 62 flashcards in this deck.
Unlock Deck
k this deck
50
Cost-of-Quality (COQ) Reporting; Spreadsheet Application Carrie Lee, the president of Lee Enterprises, was concerned about the results of her company's new quality control efforts. "Maybe the emphasis we've placed on upgrading our quality control system will pay off in the long run, but it doesn't seem to be helping us much right now. I thought improved quality would give a real boost to sales, but sales have remained flat at about $10,000,000 for the last two years." Lee Enterprises has seen its market share decline in recent years because of increased foreign competition. An intensive effort to strengthen the quality control system was initiated a year ago (on January 1, 2014) in the hope that better quality would strengthen the company's competitive position and reduce warranty and servicing costs. The following costs (in thousands) relate to quality and quality control over the last two years:
Required
1. Prepare a spreadsheet that produces a cost-of-quality (COQ) report for both 2013 and 2014. Carry percentage computations to two decimal places.
2. Use your spreadsheet to prepare a histogram showing the distribution of the various quality costs by category. ( Note: Your histogram should include results for both 2013 and 2014.)
3. Prepare a written evaluation to accompany the reports you have prepared in requirements 1 and 2. This evaluation should discuss the distribution of quality costs in the company, changes in this distribution that you detect have taken place over the last year, and any other information you believe would be useful to management.
4. A member of the management team believes that employees will be more conscientious in their work if they are held responsible for mistakes. He suggests that workers should do rework on their own time and that they also should pay for disposal of defective units and the cost of scraps. The proposal estimates that the firm can save another $400,000 in quality costs and the employees are less likely to make as many errors. Should the firm implement the proposal Why or why not
Required
1. Prepare a spreadsheet that produces a cost-of-quality (COQ) report for both 2013 and 2014. Carry percentage computations to two decimal places.
2. Use your spreadsheet to prepare a histogram showing the distribution of the various quality costs by category. ( Note: Your histogram should include results for both 2013 and 2014.)
3. Prepare a written evaluation to accompany the reports you have prepared in requirements 1 and 2. This evaluation should discuss the distribution of quality costs in the company, changes in this distribution that you detect have taken place over the last year, and any other information you believe would be useful to management.
4. A member of the management team believes that employees will be more conscientious in their work if they are held responsible for mistakes. He suggests that workers should do rework on their own time and that they also should pay for disposal of defective units and the cost of scraps. The proposal estimates that the firm can save another $400,000 in quality costs and the employees are less likely to make as many errors. Should the firm implement the proposal Why or why not
Unlock Deck
Unlock for access to all 62 flashcards in this deck.
Unlock Deck
k this deck
51
Discuss the difference between goalpost conformance and absolute quality conformance.
Unlock Deck
Unlock for access to all 62 flashcards in this deck.
Unlock Deck
k this deck
52
Six Sigma Interpretation To what probabilities do each of the following sigma levels correspond, based on a standard normal curve: 3 sigma, 4 sigma, 5 sigma, and 6 sigma ( Hint: Use the NORMSDIST function in Excel. Note that this function returns the standard normal cumulative distribution function. The distribution has a mean of 0 (zero) and a standard deviation of one.) Check figures: for three sigma, the two-tailed probability equals 0.27%; for six sigma, the two-tailed probability level is 0.0000002%. To what level of defects per million do each of the two-tailed probabilities correspond to What is the point of these calculations
Unlock Deck
Unlock for access to all 62 flashcards in this deck.
Unlock Deck
k this deck
53
Assessing the Use and Role of Nonfinancial Performance Indicators This question pertains to the use of nonfinancial performance indicators as part of a comprehensive management accounting and control system. You are asked to think critically about the value and challenges of using such data for performance-evaluation purposes. The following source should be accessed and read prior to answering the questions that appear below: Christopher D. Ittner and David F. Larker, "Coming Up Short on Nonfinancial Performance Measurement," Harvard Business Review (November 2003), pp. 88-95.
Required
1. What are the primary benefits of incorporating nonfinancial performance indicators as part of an overall management accounting and control system
2. Why do the authors of this above-referenced article believe that many companies fail to realize the kinds of benefits listed above in (1)
3. The Institute of Management Accountants (IMA) recently revised its definition of "management accounting" (see www.imanet.org/pdf/definition.pdf). After accessing this statement, comment on an appropriate role of the management accountant as regards the development and use of nonfinancial performance indicators.
Unlock Deck
Unlock for access to all 62 flashcards in this deck.
Unlock Deck
k this deck
54
Relevant Costs and Quality Improvement Lightening Bulk Company is a moving company specializing in transporting large items worldwide. The firm has an 85 percent on-time delivery rate. Twelve percent of the items are misplaced and the remaining 3 percent are lost in shipping. On average, the firm incurs an additional $60 per item to track down and deliver misplaced items. Lost items cost the firm about $300 per item. Last year the firm shipped 5,000 items with an average freight bill of $200 per item shipped.
The firm's manager is considering investing in a new scheduling and tracking system costing $150,000 per year. The new system is expected to reduce misplaced items to 1 percent and lost items to 0.5 percent. Furthermore, the firm expects total sales to increase by 10 percent with the improved service. The average contribution margin on any increased sales volume is expected to be 40%.
Required
1. Based on a relevant-cost analysis, should the firm install the new tracking system Show calculations.
2. What other factors does the firm's manager need to consider in making the decision
3. Upon further investigation, the manager discovered that 80 percent of the misplaced or lost items either originated in or were delivered to the same country. What is the maximum amount the firm should spend to reduce the problems in that country by 90 percent
Unlock Deck
Unlock for access to all 62 flashcards in this deck.
Unlock Deck
k this deck
55
Taguchi argues that being within specification limits is not enough to be competitive in today's global economy. Do you agree Why
Unlock Deck
Unlock for access to all 62 flashcards in this deck.
Unlock Deck
k this deck
56
Management Accounting's Role in Six Sigma This chapter contains an overview of the Six Sigma process that many organizations are using today to improve services and products. One could get the impression from the discussion that this topic is more properly a management or an operations management issue. Respond to this position by speculating as to the appropriate role of the management accountant in the Six Sigma process. ( Hint: Use as the basis of structuring your response the DMAIC implementation approach that is commonly associated with Six Sigma.)
Unlock Deck
Unlock for access to all 62 flashcards in this deck.
Unlock Deck
k this deck
57
Pareto Diagram (Chart) The following causes of absenteeism for a fellow student are for the year just completed:
Required Construct a Pareto diagram (chart). In conjunction with the framework presented in Exhibit 17.2 what role is played by the use of these diagrams
Required Construct a Pareto diagram (chart). In conjunction with the framework presented in Exhibit 17.2 what role is played by the use of these diagrams Unlock Deck
Unlock for access to all 62 flashcards in this deck.
Unlock Deck
k this deck
58
Quality Improvement, Relevant Cost Analysis Worrix Corporation manufactures and sells each year 3,000 premium-quality multimedia projectors at $12,000 per unit. At the current production level, the firm's manufacturing costs include variable costs of $2,500 per unit and annual fixed costs of $6,000,000. Additional selling, administrative, and other expenses, not including 15 percent sales commissions, are $10,000,000 per year.
The new model, introduced a year ago, has experienced a flickering problem. On average the firm reworks 40 percent of the completed units and still has to repair under warranty 15 percent of the units shipped. The additional work required for rework and repair causes the firm to add additional capacity with annual fixed costs of $1,800,000. The variable costs per unit are $2,000 for rework and $2,500, including transportation cost, for repair.
The chief engineer, Patti Mehandra, has proposed a modified manufacturing process that will almost entirely eliminate the flickering problem. The new process will require $12,000,000 for new equipment and installation and $3,000,000 for training. Patti believes that current appraisal costs of $600,000 per year and $50 per unit can be eliminated within one year after the installation of the new process. The firm currently inspects all units before shipment. Furthermore, warranty repair cost per unit will be only $1,000, for no more than 5 percent of the units shipped.
Worrix believes that none of the fixed costs of rework or repair can be saved and that a new model will be introduced in three years. The new technology will most likely render the current equipment obsolete.
The accountant estimates that repairs cost the firm 20 percent of its business.
Required
1. What is the net investment cost associated with the new process
2. What is the net financial benefit (over the next three years) from using the new process
3. Based on financial information, should Worrix use the new process
4. What additional factors should be considered before making the final decision
5. A member of the board is very concerned about the substantial amount of additional funds needed for the new process. Because the current model will be replaced in about three years, the board member suggests that the firm should take no action and the problem will go away in three years. Do you agree
Unlock Deck
Unlock for access to all 62 flashcards in this deck.
Unlock Deck
k this deck
59
What functions does a cost-of-quality (COQ) report play in a quality-improvement program
Unlock Deck
Unlock for access to all 62 flashcards in this deck.
Unlock Deck
k this deck
60
Applying Six Sigma Principles to the Accounting Function Brewer and Eighme (2005) report the results of an actual case study of applying Six Sigma principles to improve the accounting function, specifically, to improve the speed with which a subsidiary communicated quarterly financial results to its parent company (to allow preparation of consolidated financial statements). Assume you are in charge of a Six-Sigma project designed to address this problem. Discuss steps you would take as project manager to address the problem, including the five steps in the DMAIC (design, measure, analyze, improve, and control) framework discussed in the text. (P. C. Brewer and J. E. Eighme, "Using Six Sigma to Improve the Finance Function," Strategic Finance (May 2005), pp. 27-33.)
Unlock Deck
Unlock for access to all 62 flashcards in this deck.
Unlock Deck
k this deck
61
Relevant Cost Analysis-Quality Improvements Destin Company produces water control valves, made of brass, which they sell primarily to builders for use in commercial real estate construction. These valves must meet rigid specifications (i.e., the quality tolerance is small). Valves that, upon inspection, get rejected are returned to the Casting Department, i.e., to stage one of the four-stage manufacturing process. Rejected items are melted and then recast. As such, no new materials in Casting are required to rework these items. However, new materials must be added in the Finishing Department for all reworked valves. As the cost accountant for the company, you have prepared the following cost data regarding the production of a typical valve:
The company, spurred by intense price pressures from foreign manufacturers, recently initiated a number of quality programs. As a result, the rejection rate for valves has decreased from 5.0 percent to 3.5 percent of annual output (equal in total to 15,000 units). The reduction in reject rates has enabled the company to reduce its inventory holdings from $400,000 to $250,000. Destin estimates that the annual financing cost associated with inventory holdings is 12 percent.
Required Provide a dollar estimate of the annual cost savings associated with the recently enacted quality improvements. Show calculations.
The company, spurred by intense price pressures from foreign manufacturers, recently initiated a number of quality programs. As a result, the rejection rate for valves has decreased from 5.0 percent to 3.5 percent of annual output (equal in total to 15,000 units). The reduction in reject rates has enabled the company to reduce its inventory holdings from $400,000 to $250,000. Destin estimates that the annual financing cost associated with inventory holdings is 12 percent.Required Provide a dollar estimate of the annual cost savings associated with the recently enacted quality improvements. Show calculations.
Unlock Deck
Unlock for access to all 62 flashcards in this deck.
Unlock Deck
k this deck
62
Analyzing Cost-of-Quality (COQ) Reports Bergen Inc. produces telephone equipment at its Georgia plant. In recent years, the company's market share has been eroded by stiff competition from Asian and European competitors. Price and product quality are the two key areas in which companies compete in this market.
Jerry Holman, Bergen's president, decided to devote more resources to the improvement of product quality after learning that, in a 2011 survey of telephone equipment users, his company's products had been ranked fourth in product quality. He believed that Bergen could no longer afford to ignore the importance of product quality. Jerry set up a task force (that he headed) to implement a formal quality-improvement program. Included on the task force were representatives from engineering, sales, customer service, production, and accounting because Jerry believed that this is a companywide program and that all employees should share the responsibility for its success.
After the first task-force meeting, Sheila Haynes, manager of sales, asked Tony Reese, production manager, what he thought of the proposed program. Tony replied, "I have reservations. Quality is too abstract to be attaching costs to it and then to be holding you and me responsible for cost improvements. I like to work with goals that I can see and count! I don't like my annual bonus to be based on a decrease in quality costs; there are too many variables that we have no control over!"
Bergen's quality-improvement program has been in operation for 18 months, and the following cost report was recently issued.
As they were reviewing the report, Sheila asked Tony what he thought of the quality program now. "The work is really moving through the production department," replied Reese. "We used to spend time helping the customer service department solve its problems, but they are leaving us alone these days. I have no complaints so far. I'll be anxious to see how much the program increases our bonuses."
Required
1. Identify at least three factors that should be present for an organization to successfully implement a quality improvement program.
2. By analyzing the cost-of-quality (COQ) report presented, determine whether Bergen's quality improvement program has been successful. ( Hint: You might want to focus on the oldest quarter and on the most recent quarter.) List specific evidence to support your answer.
3. Discuss why Tony Reese's current reaction to the quality-improvement program is more favorable than his initial reaction.
4. Jerry Holman believed that the quality-improvement program was essential and that Bergen could no longer afford to ignore the importance of product quality. Discuss how Bergen could measure the opportunity cost of not implementing the quality-improvement program.
5. Comment on the following statement: "COQ reports allow an organization to focus on the reduction or elimination of non-value-added costs of quality."
Jerry Holman, Bergen's president, decided to devote more resources to the improvement of product quality after learning that, in a 2011 survey of telephone equipment users, his company's products had been ranked fourth in product quality. He believed that Bergen could no longer afford to ignore the importance of product quality. Jerry set up a task force (that he headed) to implement a formal quality-improvement program. Included on the task force were representatives from engineering, sales, customer service, production, and accounting because Jerry believed that this is a companywide program and that all employees should share the responsibility for its success.
After the first task-force meeting, Sheila Haynes, manager of sales, asked Tony Reese, production manager, what he thought of the proposed program. Tony replied, "I have reservations. Quality is too abstract to be attaching costs to it and then to be holding you and me responsible for cost improvements. I like to work with goals that I can see and count! I don't like my annual bonus to be based on a decrease in quality costs; there are too many variables that we have no control over!"
Bergen's quality-improvement program has been in operation for 18 months, and the following cost report was recently issued.
As they were reviewing the report, Sheila asked Tony what he thought of the quality program now. "The work is really moving through the production department," replied Reese. "We used to spend time helping the customer service department solve its problems, but they are leaving us alone these days. I have no complaints so far. I'll be anxious to see how much the program increases our bonuses."
Required
1. Identify at least three factors that should be present for an organization to successfully implement a quality improvement program.
2. By analyzing the cost-of-quality (COQ) report presented, determine whether Bergen's quality improvement program has been successful. ( Hint: You might want to focus on the oldest quarter and on the most recent quarter.) List specific evidence to support your answer.
3. Discuss why Tony Reese's current reaction to the quality-improvement program is more favorable than his initial reaction.
4. Jerry Holman believed that the quality-improvement program was essential and that Bergen could no longer afford to ignore the importance of product quality. Discuss how Bergen could measure the opportunity cost of not implementing the quality-improvement program.
5. Comment on the following statement: "COQ reports allow an organization to focus on the reduction or elimination of non-value-added costs of quality."
Unlock Deck
Unlock for access to all 62 flashcards in this deck.
Unlock Deck
k this deck
Unlock Deck
Unlock for access to all 62 flashcards in this deck.


