Deck 11: Summarizing Your Data
Full screen (f)
Question
Question
In a survey, Valentine's Day rose buyers are asked to indicate what color of roses they purchased for their special friends. The following table summarizes the findings.
What color roses did you purchase last Valentine's Day?
Describe the central tendency and variability apparent in this analysis.
What color roses did you purchase last Valentine's Day?
Describe the central tendency and variability apparent in this analysis.
Question
Question
An entrepreneur is thinking about opening an upscale restaurant. To help assess the market size, a researcher conducts a survey of individuals in the geographic target market who patronize upscale restaurants. The findings of the summarization analysis for two questions on the survey follow.

Describe the central tendency and variability apparent in this analysis.
Describe the central tendency and variability apparent in this analysis.
Question
Question
Question
Question
Question
Question
Question
Question
Question
Question
Question
Question
Question
Question
Question
Question
Question
Question
Question
Question
Question
Question
Question
Question

Unlock Deck
Sign up to unlock the cards in this deck!
Unlock Deck
Unlock Deck
1/28
Play
Full screen (f)
Deck 11: Summarizing Your Data
1
Describe differences analysis and provide an example.
A researcher identifies meaningful differences between variable with the help of percentage difference tests and average difference tests. This kind of analysis is known as difference analysis.
Categorical data and metric data are used in the analysis.
Example:
80% of college boys have bikes in a college and 60% of total students own a bike. An analyzer can identify how much percentage of girls own a bike.
Categorical data and metric data are used in the analysis.
Example:
80% of college boys have bikes in a college and 60% of total students own a bike. An analyzer can identify how much percentage of girls own a bike.
2
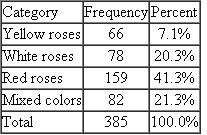
In a survey, Valentine's Day rose buyers are asked to indicate what color of roses they purchased for their special friends. The following table summarizes the findings.
What color roses did you purchase last Valentine's Day?
Describe the central tendency and variability apparent in this analysis.
What color roses did you purchase last Valentine's Day?
Describe the central tendency and variability apparent in this analysis.
The different color roses that have been purchased on last Valentine's Day are as mentioned in the Table.
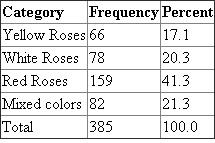 From the above table it is clear that variables are categorical and hence central tendency will be defined by Mode , and Variability will be defined by Percentage distribution.
It is evident form the table that Red roses are most demanded with variability of 41.3 %. The next demanded color of roses is mixed, white, and then yellow.
Considering central tendency, frequency of purchasing of red roses is 159, which show it is most demanded followed by mixed color, white and yellow.
From the above table it is clear that variables are categorical and hence central tendency will be defined by Mode , and Variability will be defined by Percentage distribution. It is evident form the table that Red roses are most demanded with variability of 41.3 %. The next demanded color of roses is mixed, white, and then yellow.
Considering central tendency, frequency of purchasing of red roses is 159, which show it is most demanded followed by mixed color, white and yellow.
3
Describe relationship analysis and provide an example.
Relationship analysis determines the relation between two or more variables. This analysis gives a better way of recognizing and understanding a topic.
This analysis makes use of cross-tabulation, regression or correlation analysis to determine the relationship. Cross-tabulation analysis is used with categorical data. However, correlations analysis is used for metric data.
Example:
Relationship analysis is used to study the relation between student's gender and ownership, age and total credit card debt, or demographics and lifestyle variables related to expenditure.
4
An entrepreneur is thinking about opening an upscale restaurant. To help assess the market size, a researcher conducts a survey of individuals in the geographic target market who patronize upscale restaurants. The findings of the summarization analysis for two questions on the survey follow.
Describe the central tendency and variability apparent in this analysis.
Describe the central tendency and variability apparent in this analysis.
Unlock Deck
Unlock for access to all 28 flashcards in this deck.
Unlock Deck
k this deck
5
With regard to complexity, how do the four types of data analysis compare?
Unlock Deck
Unlock for access to all 28 flashcards in this deck.
Unlock Deck
k this deck
6
The Prospective New Restaurant Survey
Following is a questionnaire used in a survey to determine reactions to a proposed new restaurant.
Survey Questionnaire
1. Do you eat at an upscale restaurant at least once every two weeks?
____Yes (Continue) ____ No (Terminate)
2. How many total dollars do you spend per month in restaurants (for your meals only)?
$___________
3. Now please read the following description of a restaurant and answer the following questions.
A restaurant with a very elegant decor, offering very personal service in a spacious, semiprivate atmosphere, featuring menu items, traditional and unusual, prepared by chefs with international reputations. The atmosphere, food, and service at this restaurant meet a standard equal to that of the finest restaurants in the world. Menu items are priced separately, known as "a la carte," and the prices are what one would expect for a restaurant meeting or surpassing the highest restaurant standards in the world.
How likely would it be for you to patronize this restaurant?
____ Very likely (1)
____ Somewhat likely (2)
____ Neither likely nor unlikely (3)
____ Somewhat unlikely (4)
____ Very unlikely (5)
4. Thinking again of the restaurant just described and remembering that drinks, appetizers, entrées, and desserts are priced separately (a la carte), what would you expect an average evening meal entree item alone to be priced?
$ ___________
5. Would you describe yourself as one who listens to the radio?
1. Yes (1)
2. No (2) (Go to Question 7)
6. To which type of radio programming do you most often listen? Select only one.
____ Country Western (1)
____ Easy Listening (2)
____ Rock (3)
____ Talk/News (4)
____ No Preference (5)
7. Would you describe yourself as a viewer of television local news?
1. Yes (1)
2. No (2) (Go to Question 9)
8. Which newscast do you watch most frequently? Select only one.
____ 7:00 am (1)
____ Noon (2)
____ 6:00 pm (3)
____ 10:00 pm (4)
9. Do you read the newspaper?
1. Yes (1)
2. No (2) (Go to Question 11)
10. Which section of the local newspaper would you say you read most frequently? Select only one.
____ Editorial (1)
____ Business (2)
____ Local (3)
____ Classifieds (4)
____ Life, Health Entertainment (5)
____ No Preference (6)
11. Do you subscribe to City Magazine ?
1. Yes (1)
2. No (2)
We are going to describe some characteristics of restaurants and we want you to tell us how strongly you would prefer each characteristic in a restaurant of your choice.
12. Waterfront view
Response scale for Questions 12 through 21
13. Located less than a 30-minute drive from your home
____Very strongly not prefer (1)
14. A formal waitstaff wearing tuxedos
____ Somewhat not prefer (2)
15. Unusual desserts such as "Baked Alaska" and "Flaming Bananas Foster"
16. Alarge variety of entrées
17. Unusual entrées such as moose, bison, venison, and pheasant
18. Simple decor: tables, chairs, and a few wall decorations
19. Elegant decor: curtains, original paintings, fine furniture
20. A string quartet for background music
21. A jazz combo for background music
The following questions are asked for classification purposes only.
22. In which year were you born? __________
23. What is your highest level of education?
____ Less than high school (1)
____ Some high school (2)
____ High school graduate (3)
____ Some college (no degree) (4)
____ Associate degree (5)
____ Bachelor's degree (6)
____ Master's degree (7)
____ Doctorate degree (8)
24. What is your marital status?
____ Single (1)
____ Married (2)
____ Other (3)
25. Including children under 18 years of age living with you, what is your family size? ___________
26. Please provide the zip code in which you live. ___________
27. Which of the following categories best describes your before-tax household income?
____ $15,000 (1)
____ $15,000-$24,999 (2)
____ $25,000-$49,999 (3)
____ $50,000-$74,999 (4)
____ $75,000-$99,999 (5)
____ $100,000-$149,999 (6)
____ $150,000+ (7)
28. What is your gender?
__________ Male (1)
__________ Female (2)
1. Assuming that the data set is comprised of only respondents who answered "Yes" to question 1, indicate those variables where missing data would be found even if every respondent answered every question he or she is supposed to answer.
2. Determine what variables are categorical and indicate the appropriate summarization analysis.
3. Determine what variables are metric scales and indicate appropriate summarization analysis.
Unlock Deck
Unlock for access to all 28 flashcards in this deck.
Unlock Deck
k this deck
7
With regard to value of the findings, how do the four types of data analysis compare?
Unlock Deck
Unlock for access to all 28 flashcards in this deck.
Unlock Deck
k this deck
8
Your Integrated Case
Advanced Automobile Concepts Summarization Analysis
Cory Rogers was happy to call Nick Thomas to inform him that Advanced Automobile Concepts survey data were collected and ready for analysis. Of course, Rogers had other marketing research projects and meetings scheduled with present and prospective clients, so he called in his data analyst, Celeste Brown. Brown was a recently graduated marketing major who had worked as a marketing intern at CMG Research last year. She had worked on a few small CMG survey data sets, but she had not yet tackled any large projects. Rogers called Brown into his office and said, "Celeste, it is time to do some analysis on the survey we did for Nick Thomas of Advanced Automobile Concepts. I am going to assign you primary responsibility for all data analysis on this important project. For now, let's just get a feel for what the data look like. I'll leave it up to your judgment as to what analyses to run, but for now, do some summarizations in order to reveal the basic patterns and to gain an understanding of the nature of the variability in the data. Let's meet on Thursday at 2:30 pm to see what you have found."
Your task in Case is to take the role of Celeste Brown, marketing analyst. The data set for the Advanced Automobile Concepts survey is now ready for summarization analysis. The file name is AAConcepts.xlsm, and it is in XL Data Analyst data file format. The instructor of your marketing research course will tell you how to access this data set. The data set sample represents American households, and it includes owners as well as nonowners of vehicles, because the hybrid vehicles being developed and marketed by the Advanced Automobile Concepts division of ZEN Motors will not "hit" the market for three to five more years.
The AAConcepts Define Variables worksheet defines the variables, but for easy reference, here is a list of the major variables in the survey. For any variables where the data coding is not clear in this case description, refer to the Define Variables worksheet.
All of the attitude variables are measured with a 7-point Likert scale, where 1 = "very strongly disagree" and 7 = "very strongly agree." The likelihoods of buying new automobile types are measured on a 100-point probability scale. The lifestyle types are measured on a 10-point scale, where 1 = "does not describe me at all" and 10 = "describes me almost perfectly." The preferences scale is a 7-point scale, with 1 = "very undesirable" and 7 = "very desirable."
Demographics
? Hometown size
? Gender
? Marital status
? Number of people in family
? Age category
? Education category
? Job type category
? Income category
? Dwelling type
Attitudes: Global Warming (Measure: 1-7)
? I am worried about global warming.
? Global warming is a real threat.
? We need to do something to slow global warming.
Attitudes: Gasoline Prices (Measure: 1-7)
? Gasoline prices will remain high in the future.
? Gasoline prices are too high now.
? High gasoline prices will impact what type of autos are purchased.
Automobile Ownership
? Primary vehicle price category
? Primary vehicle type
? Type of commuting
Attitudes: Gasoline Usage (Measure: 1-7)
? Gasoline emissions contribute to global warming.
? Americans use too much gasoline.
? We should be looking for gasoline substitutes.
Attitudes: Effects of New Automobile Types (Measure: 1-7)
? Very small autos with very high mpg will reduce fuel emissions.
? Very small autos with very high mpg will keep gas prices stable.
? Very small autos with very high mpg will slow global warming.
? Small autos with high mpg will reduce fuel emissions.
? Small autos with high mpg will keep gas prices stable.
? Small autos with high mpg will slow global warming.
? Hybrid autos that use alternative fuels will reduce fuel emissions.
Probabilities of Buying Hybrid Automobile Types (Measure: 0%-100%)
? Probability of buying a very small (one-seat) hybrid auto within three years?
? Probability of buying a small (two-seat) hybrid auto within three years?
? Probability of buying an economy-size hybrid auto within three years?
? Probability of buying a standard-size hybrid auto within three years?
? Probability of buying a large-size hybrid auto within three years?
Lifestyle Type (Measure: 1-10)
? Novelist -very early adopter, risk taker, "way out," "show off," want to be unique and special
? Innovator -Early adopter, less a risk taker than novelist, but into new technology; likes new products, but not a "show off"
? Trendsetter -Opinion leaders, well off financially and educationally, often the first adopters of new trends that are adopted by most of society
Favorite Television Show Type
? Comedy
? Drama
? Movies/Mini-series
? News/Documentary
? Reality, Science Fiction
? Sports
Favorite Magazine Type
? Business Money
? Music Entertainment
? Family Parenting
? Sports Outdoors
? Home Garden
? Cooking-Food Wine
? Trucks-Cars Motorcycles
? News-Politics Current Events
? Hybrid autos that use alternative fuels will keep gas prices down.
? Hybrid autos that use alternative fuels will slow global warming.
Preferences for Various Types of Hybrid Automobile Models (Measure: 1-7)
? Super cycle one-seat; 120+ mpg city
? Runabout sport two-seat; 90 mpg city, 120 mpg highway
? Runabout with luggage two-seat; 80 mpg city, 110 mpg highway
? Economy four-seat; 70 mpg city, 100 mpg highway
? Standard four-seat; 50 mpg city, 80 mpg highway
? Forerunner -Early majority of population, respected and fairly well off; not opinion leaders, but adopt new products before the "average" person
? Mainstreamer -Late majority of population, "average people" who are reserved and deliberate
? Classic -Laggards who cling to "old" ways
For each of the following questions, it is your task to determine the type of scale for each variable, so that you can conduct the proper summarization analysis with XL Data Analyst, and to interpret it.
What is the demographic composition of the sample?
Unlock Deck
Unlock for access to all 28 flashcards in this deck.
Unlock Deck
k this deck
9
What is meant by the term central tendency ? Why is the central tendency an incomplete summarization of a variable?
Unlock Deck
Unlock for access to all 28 flashcards in this deck.
Unlock Deck
k this deck
10
Your Integrated Case
Advanced Automobile Concepts Summarization Analysis
Cory Rogers was happy to call Nick Thomas to inform him that Advanced Automobile Concepts survey data were collected and ready for analysis. Of course, Rogers had other marketing research projects and meetings scheduled with present and prospective clients, so he called in his data analyst, Celeste Brown. Brown was a recently graduated marketing major who had worked as a marketing intern at CMG Research last year. She had worked on a few small CMG survey data sets, but she had not yet tackled any large projects. Rogers called Brown into his office and said, "Celeste, it is time to do some analysis on the survey we did for Nick Thomas of Advanced Automobile Concepts. I am going to assign you primary responsibility for all data analysis on this important project. For now, let's just get a feel for what the data look like. I'll leave it up to your judgment as to what analyses to run, but for now, do some summarizations in order to reveal the basic patterns and to gain an understanding of the nature of the variability in the data. Let's meet on Thursday at 2:30 pm to see what you have found."
Your task in Case is to take the role of Celeste Brown, marketing analyst. The data set for the Advanced Automobile Concepts survey is now ready for summarization analysis. The file name is AAConcepts.xlsm, and it is in XL Data Analyst data file format. The instructor of your marketing research course will tell you how to access this data set. The data set sample represents American households, and it includes owners as well as nonowners of vehicles, because the hybrid vehicles being developed and marketed by the Advanced Automobile Concepts division of ZEN Motors will not "hit" the market for three to five more years.
The AAConcepts Define Variables worksheet defines the variables, but for easy reference, here is a list of the major variables in the survey. For any variables where the data coding is not clear in this case description, refer to the Define Variables worksheet.
All of the attitude variables are measured with a 7-point Likert scale, where 1 = "very strongly disagree" and 7 = "very strongly agree." The likelihoods of buying new automobile types are measured on a 100-point probability scale. The lifestyle types are measured on a 10-point scale, where 1 = "does not describe me at all" and 10 = "describes me almost perfectly." The preferences scale is a 7-point scale, with 1 = "very undesirable" and 7 = "very desirable."
Demographics
? Hometown size
? Gender
? Marital status
? Number of people in family
? Age category
? Education category
? Job type category
? Income category
? Dwelling type
Attitudes: Global Warming (Measure: 1-7)
? I am worried about global warming.
? Global warming is a real threat.
? We need to do something to slow global warming.
Attitudes: Gasoline Prices (Measure: 1-7)
? Gasoline prices will remain high in the future.
? Gasoline prices are too high now.
? High gasoline prices will impact what type of autos are purchased.
Automobile Ownership
? Primary vehicle price category
? Primary vehicle type
? Type of commuting
Attitudes: Gasoline Usage (Measure: 1-7)
? Gasoline emissions contribute to global warming.
? Americans use too much gasoline.
? We should be looking for gasoline substitutes.
Attitudes: Effects of New Automobile Types (Measure: 1-7)
? Very small autos with very high mpg will reduce fuel emissions.
? Very small autos with very high mpg will keep gas prices stable.
? Very small autos with very high mpg will slow global warming.
? Small autos with high mpg will reduce fuel emissions.
? Small autos with high mpg will keep gas prices stable.
? Small autos with high mpg will slow global warming.
? Hybrid autos that use alternative fuels will reduce fuel emissions.
Probabilities of Buying Hybrid Automobile Types (Measure: 0%-100%)
? Probability of buying a very small (one-seat) hybrid auto within three years?
? Probability of buying a small (two-seat) hybrid auto within three years?
? Probability of buying an economy-size hybrid auto within three years?
? Probability of buying a standard-size hybrid auto within three years?
? Probability of buying a large-size hybrid auto within three years?
Lifestyle Type (Measure: 1-10)
? Novelist -very early adopter, risk taker, "way out," "show off," want to be unique and special
? Innovator -Early adopter, less a risk taker than novelist, but into new technology; likes new products, but not a "show off"
? Trendsetter -Opinion leaders, well off financially and educationally, often the first adopters of new trends that are adopted by most of society
Favorite Television Show Type
? Comedy
? Drama
? Movies/Mini-series
? News/Documentary
? Reality, Science Fiction
? Sports
Favorite Magazine Type
? Business Money
? Music Entertainment
? Family Parenting
? Sports Outdoors
? Home Garden
? Cooking-Food Wine
? Trucks-Cars Motorcycles
? News-Politics Current Events
? Hybrid autos that use alternative fuels will keep gas prices down.
? Hybrid autos that use alternative fuels will slow global warming.
Preferences for Various Types of Hybrid Automobile Models (Measure: 1-7)
? Super cycle one-seat; 120+ mpg city
? Runabout sport two-seat; 90 mpg city, 120 mpg highway
? Runabout with luggage two-seat; 80 mpg city, 110 mpg highway
? Economy four-seat; 70 mpg city, 100 mpg highway
? Standard four-seat; 50 mpg city, 80 mpg highway
? Forerunner -Early majority of population, respected and fairly well off; not opinion leaders, but adopt new products before the "average" person
? Mainstreamer -Late majority of population, "average people" who are reserved and deliberate
? Classic -Laggards who cling to "old" ways
For each of the following questions, it is your task to determine the type of scale for each variable, so that you can conduct the proper summarization analysis with XL Data Analyst, and to interpret it.
What is the automobile ownership profile of respondents in the survey?
Unlock Deck
Unlock for access to all 28 flashcards in this deck.
Unlock Deck
k this deck
11
When summarizing a categorical variable, what is the proper measure of central tendency, and why is it the proper measure? What is the proper measure of variability and why?
Unlock Deck
Unlock for access to all 28 flashcards in this deck.
Unlock Deck
k this deck
12
Your Integrated Case
Advanced Automobile Concepts Summarization Analysis
Cory Rogers was happy to call Nick Thomas to inform him that Advanced Automobile Concepts survey data were collected and ready for analysis. Of course, Rogers had other marketing research projects and meetings scheduled with present and prospective clients, so he called in his data analyst, Celeste Brown. Brown was a recently graduated marketing major who had worked as a marketing intern at CMG Research last year. She had worked on a few small CMG survey data sets, but she had not yet tackled any large projects. Rogers called Brown into his office and said, "Celeste, it is time to do some analysis on the survey we did for Nick Thomas of Advanced Automobile Concepts. I am going to assign you primary responsibility for all data analysis on this important project. For now, let's just get a feel for what the data look like. I'll leave it up to your judgment as to what analyses to run, but for now, do some summarizations in order to reveal the basic patterns and to gain an understanding of the nature of the variability in the data. Let's meet on Thursday at 2:30 pm to see what you have found."
Your task in Case is to take the role of Celeste Brown, marketing analyst. The data set for the Advanced Automobile Concepts survey is now ready for summarization analysis. The file name is AAConcepts.xlsm, and it is in XL Data Analyst data file format. The instructor of your marketing research course will tell you how to access this data set. The data set sample represents American households, and it includes owners as well as nonowners of vehicles, because the hybrid vehicles being developed and marketed by the Advanced Automobile Concepts division of ZEN Motors will not "hit" the market for three to five more years.
The AAConcepts Define Variables worksheet defines the variables, but for easy reference, here is a list of the major variables in the survey. For any variables where the data coding is not clear in this case description, refer to the Define Variables worksheet.
All of the attitude variables are measured with a 7-point Likert scale, where 1 = "very strongly disagree" and 7 = "very strongly agree." The likelihoods of buying new automobile types are measured on a 100-point probability scale. The lifestyle types are measured on a 10-point scale, where 1 = "does not describe me at all" and 10 = "describes me almost perfectly." The preferences scale is a 7-point scale, with 1 = "very undesirable" and 7 = "very desirable."
Demographics
? Hometown size
? Gender
? Marital status
? Number of people in family
? Age category
? Education category
? Job type category
? Income category
? Dwelling type
Attitudes: Global Warming (Measure: 1-7)
? I am worried about global warming.
? Global warming is a real threat.
? We need to do something to slow global warming.
Attitudes: Gasoline Prices (Measure: 1-7)
? Gasoline prices will remain high in the future.
? Gasoline prices are too high now.
? High gasoline prices will impact what type of autos are purchased.
Automobile Ownership
? Primary vehicle price category
? Primary vehicle type
? Type of commuting
Attitudes: Gasoline Usage (Measure: 1-7)
? Gasoline emissions contribute to global warming.
? Americans use too much gasoline.
? We should be looking for gasoline substitutes.
Attitudes: Effects of New Automobile Types (Measure: 1-7)
? Very small autos with very high mpg will reduce fuel emissions.
? Very small autos with very high mpg will keep gas prices stable.
? Very small autos with very high mpg will slow global warming.
? Small autos with high mpg will reduce fuel emissions.
? Small autos with high mpg will keep gas prices stable.
? Small autos with high mpg will slow global warming.
? Hybrid autos that use alternative fuels will reduce fuel emissions.
Probabilities of Buying Hybrid Automobile Types (Measure: 0%-100%)
? Probability of buying a very small (one-seat) hybrid auto within three years?
? Probability of buying a small (two-seat) hybrid auto within three years?
? Probability of buying an economy-size hybrid auto within three years?
? Probability of buying a standard-size hybrid auto within three years?
? Probability of buying a large-size hybrid auto within three years?
Lifestyle Type (Measure: 1-10)
? Novelist -very early adopter, risk taker, "way out," "show off," want to be unique and special
? Innovator -Early adopter, less a risk taker than novelist, but into new technology; likes new products, but not a "show off"
? Trendsetter -Opinion leaders, well off financially and educationally, often the first adopters of new trends that are adopted by most of society
Favorite Television Show Type
? Comedy
? Drama
? Movies/Mini-series
? News/Documentary
? Reality, Science Fiction
? Sports
Favorite Magazine Type
? Business Money
? Music Entertainment
? Family Parenting
? Sports Outdoors
? Home Garden
? Cooking-Food Wine
? Trucks-Cars Motorcycles
? News-Politics Current Events
? Hybrid autos that use alternative fuels will keep gas prices down.
? Hybrid autos that use alternative fuels will slow global warming.
Preferences for Various Types of Hybrid Automobile Models (Measure: 1-7)
? Super cycle one-seat; 120+ mpg city
? Runabout sport two-seat; 90 mpg city, 120 mpg highway
? Runabout with luggage two-seat; 80 mpg city, 110 mpg highway
? Economy four-seat; 70 mpg city, 100 mpg highway
? Standard four-seat; 50 mpg city, 80 mpg highway
? Forerunner -Early majority of population, respected and fairly well off; not opinion leaders, but adopt new products before the "average" person
? Mainstreamer -Late majority of population, "average people" who are reserved and deliberate
? Classic -Laggards who cling to "old" ways
For each of the following questions, it is your task to determine the type of scale for each variable, so that you can conduct the proper summarization analysis with XL Data Analyst, and to interpret it.
How do respondents feel about (1) global warming and (2) the use of gasoline?
Unlock Deck
Unlock for access to all 28 flashcards in this deck.
Unlock Deck
k this deck
13
When summarizing a metric variable, what is the proper measure of central tendency, and why is it the proper measure?
Unlock Deck
Unlock for access to all 28 flashcards in this deck.
Unlock Deck
k this deck
14
Your Integrated Case
Advanced Automobile Concepts Summarization Analysis
Cory Rogers was happy to call Nick Thomas to inform him that Advanced Automobile Concepts survey data were collected and ready for analysis. Of course, Rogers had other marketing research projects and meetings scheduled with present and prospective clients, so he called in his data analyst, Celeste Brown. Brown was a recently graduated marketing major who had worked as a marketing intern at CMG Research last year. She had worked on a few small CMG survey data sets, but she had not yet tackled any large projects. Rogers called Brown into his office and said, "Celeste, it is time to do some analysis on the survey we did for Nick Thomas of Advanced Automobile Concepts. I am going to assign you primary responsibility for all data analysis on this important project. For now, let's just get a feel for what the data look like. I'll leave it up to your judgment as to what analyses to run, but for now, do some summarizations in order to reveal the basic patterns and to gain an understanding of the nature of the variability in the data. Let's meet on Thursday at 2:30 pm to see what you have found."
Your task in Case is to take the role of Celeste Brown, marketing analyst. The data set for the Advanced Automobile Concepts survey is now ready for summarization analysis. The file name is AAConcepts.xlsm, and it is in XL Data Analyst data file format. The instructor of your marketing research course will tell you how to access this data set. The data set sample represents American households, and it includes owners as well as nonowners of vehicles, because the hybrid vehicles being developed and marketed by the Advanced Automobile Concepts division of ZEN Motors will not "hit" the market for three to five more years.
The AAConcepts Define Variables worksheet defines the variables, but for easy reference, here is a list of the major variables in the survey. For any variables where the data coding is not clear in this case description, refer to the Define Variables worksheet.
All of the attitude variables are measured with a 7-point Likert scale, where 1 = "very strongly disagree" and 7 = "very strongly agree." The likelihoods of buying new automobile types are measured on a 100-point probability scale. The lifestyle types are measured on a 10-point scale, where 1 = "does not describe me at all" and 10 = "describes me almost perfectly." The preferences scale is a 7-point scale, with 1 = "very undesirable" and 7 = "very desirable."
Demographics
? Hometown size
? Gender
? Marital status
? Number of people in family
? Age category
? Education category
? Job type category
? Income category
? Dwelling type
Attitudes: Global Warming (Measure: 1-7)
? I am worried about global warming.
? Global warming is a real threat.
? We need to do something to slow global warming.
Attitudes: Gasoline Prices (Measure: 1-7)
? Gasoline prices will remain high in the future.
? Gasoline prices are too high now.
? High gasoline prices will impact what type of autos are purchased.
Automobile Ownership
? Primary vehicle price category
? Primary vehicle type
? Type of commuting
Attitudes: Gasoline Usage (Measure: 1-7)
? Gasoline emissions contribute to global warming.
? Americans use too much gasoline.
? We should be looking for gasoline substitutes.
Attitudes: Effects of New Automobile Types (Measure: 1-7)
? Very small autos with very high mpg will reduce fuel emissions.
? Very small autos with very high mpg will keep gas prices stable.
? Very small autos with very high mpg will slow global warming.
? Small autos with high mpg will reduce fuel emissions.
? Small autos with high mpg will keep gas prices stable.
? Small autos with high mpg will slow global warming.
? Hybrid autos that use alternative fuels will reduce fuel emissions.
Probabilities of Buying Hybrid Automobile Types (Measure: 0%-100%)
? Probability of buying a very small (one-seat) hybrid auto within three years?
? Probability of buying a small (two-seat) hybrid auto within three years?
? Probability of buying an economy-size hybrid auto within three years?
? Probability of buying a standard-size hybrid auto within three years?
? Probability of buying a large-size hybrid auto within three years?
Lifestyle Type (Measure: 1-10)
? Novelist -very early adopter, risk taker, "way out," "show off," want to be unique and special
? Innovator -Early adopter, less a risk taker than novelist, but into new technology; likes new products, but not a "show off"
? Trendsetter -Opinion leaders, well off financially and educationally, often the first adopters of new trends that are adopted by most of society
Favorite Television Show Type
? Comedy
? Drama
? Movies/Mini-series
? News/Documentary
? Reality, Science Fiction
? Sports
Favorite Magazine Type
? Business Money
? Music Entertainment
? Family Parenting
? Sports Outdoors
? Home Garden
? Cooking-Food Wine
? Trucks-Cars Motorcycles
? News-Politics Current Events
? Hybrid autos that use alternative fuels will keep gas prices down.
? Hybrid autos that use alternative fuels will slow global warming.
Preferences for Various Types of Hybrid Automobile Models (Measure: 1-7)
? Super cycle one-seat; 120+ mpg city
? Runabout sport two-seat; 90 mpg city, 120 mpg highway
? Runabout with luggage two-seat; 80 mpg city, 110 mpg highway
? Economy four-seat; 70 mpg city, 100 mpg highway
? Standard four-seat; 50 mpg city, 80 mpg highway
? Forerunner -Early majority of population, respected and fairly well off; not opinion leaders, but adopt new products before the "average" person
? Mainstreamer -Late majority of population, "average people" who are reserved and deliberate
? Classic -Laggards who cling to "old" ways
For each of the following questions, it is your task to determine the type of scale for each variable, so that you can conduct the proper summarization analysis with XL Data Analyst, and to interpret it.
What are the respondents' opinions about the effects of the use of various kinds of hybrid vehicles?
Unlock Deck
Unlock for access to all 28 flashcards in this deck.
Unlock Deck
k this deck
15
Describe how a percentage distribution is computed.
Unlock Deck
Unlock for access to all 28 flashcards in this deck.
Unlock Deck
k this deck
16
Your Integrated Case
Advanced Automobile Concepts Summarization Analysis
Cory Rogers was happy to call Nick Thomas to inform him that Advanced Automobile Concepts survey data were collected and ready for analysis. Of course, Rogers had other marketing research projects and meetings scheduled with present and prospective clients, so he called in his data analyst, Celeste Brown. Brown was a recently graduated marketing major who had worked as a marketing intern at CMG Research last year. She had worked on a few small CMG survey data sets, but she had not yet tackled any large projects. Rogers called Brown into his office and said, "Celeste, it is time to do some analysis on the survey we did for Nick Thomas of Advanced Automobile Concepts. I am going to assign you primary responsibility for all data analysis on this important project. For now, let's just get a feel for what the data look like. I'll leave it up to your judgment as to what analyses to run, but for now, do some summarizations in order to reveal the basic patterns and to gain an understanding of the nature of the variability in the data. Let's meet on Thursday at 2:30 pm to see what you have found."
Your task in Case is to take the role of Celeste Brown, marketing analyst. The data set for the Advanced Automobile Concepts survey is now ready for summarization analysis. The file name is AAConcepts.xlsm, and it is in XL Data Analyst data file format. The instructor of your marketing research course will tell you how to access this data set. The data set sample represents American households, and it includes owners as well as nonowners of vehicles, because the hybrid vehicles being developed and marketed by the Advanced Automobile Concepts division of ZEN Motors will not "hit" the market for three to five more years.
The AAConcepts Define Variables worksheet defines the variables, but for easy reference, here is a list of the major variables in the survey. For any variables where the data coding is not clear in this case description, refer to the Define Variables worksheet.
All of the attitude variables are measured with a 7-point Likert scale, where 1 = "very strongly disagree" and 7 = "very strongly agree." The likelihoods of buying new automobile types are measured on a 100-point probability scale. The lifestyle types are measured on a 10-point scale, where 1 = "does not describe me at all" and 10 = "describes me almost perfectly." The preferences scale is a 7-point scale, with 1 = "very undesirable" and 7 = "very desirable."
Demographics
? Hometown size
? Gender
? Marital status
? Number of people in family
? Age category
? Education category
? Job type category
? Income category
? Dwelling type
Attitudes: Global Warming (Measure: 1-7)
? I am worried about global warming.
? Global warming is a real threat.
? We need to do something to slow global warming.
Attitudes: Gasoline Prices (Measure: 1-7)
? Gasoline prices will remain high in the future.
? Gasoline prices are too high now.
? High gasoline prices will impact what type of autos are purchased.
Automobile Ownership
? Primary vehicle price category
? Primary vehicle type
? Type of commuting
Attitudes: Gasoline Usage (Measure: 1-7)
? Gasoline emissions contribute to global warming.
? Americans use too much gasoline.
? We should be looking for gasoline substitutes.
Attitudes: Effects of New Automobile Types (Measure: 1-7)
? Very small autos with very high mpg will reduce fuel emissions.
? Very small autos with very high mpg will keep gas prices stable.
? Very small autos with very high mpg will slow global warming.
? Small autos with high mpg will reduce fuel emissions.
? Small autos with high mpg will keep gas prices stable.
? Small autos with high mpg will slow global warming.
? Hybrid autos that use alternative fuels will reduce fuel emissions.
Probabilities of Buying Hybrid Automobile Types (Measure: 0%-100%)
? Probability of buying a very small (one-seat) hybrid auto within three years?
? Probability of buying a small (two-seat) hybrid auto within three years?
? Probability of buying an economy-size hybrid auto within three years?
? Probability of buying a standard-size hybrid auto within three years?
? Probability of buying a large-size hybrid auto within three years?
Lifestyle Type (Measure: 1-10)
? Novelist -very early adopter, risk taker, "way out," "show off," want to be unique and special
? Innovator -Early adopter, less a risk taker than novelist, but into new technology; likes new products, but not a "show off"
? Trendsetter -Opinion leaders, well off financially and educationally, often the first adopters of new trends that are adopted by most of society
Favorite Television Show Type
? Comedy
? Drama
? Movies/Mini-series
? News/Documentary
? Reality, Science Fiction
? Sports
Favorite Magazine Type
? Business Money
? Music Entertainment
? Family Parenting
? Sports Outdoors
? Home Garden
? Cooking-Food Wine
? Trucks-Cars Motorcycles
? News-Politics Current Events
? Hybrid autos that use alternative fuels will keep gas prices down.
? Hybrid autos that use alternative fuels will slow global warming.
Preferences for Various Types of Hybrid Automobile Models (Measure: 1-7)
? Super cycle one-seat; 120+ mpg city
? Runabout sport two-seat; 90 mpg city, 120 mpg highway
? Runabout with luggage two-seat; 80 mpg city, 110 mpg highway
? Economy four-seat; 70 mpg city, 100 mpg highway
? Standard four-seat; 50 mpg city, 80 mpg highway
? Forerunner -Early majority of population, respected and fairly well off; not opinion leaders, but adopt new products before the "average" person
? Mainstreamer -Late majority of population, "average people" who are reserved and deliberate
? Classic -Laggards who cling to "old" ways
For each of the following questions, it is your task to determine the type of scale for each variable, so that you can conduct the proper summarization analysis with XL Data Analyst, and to interpret it.
What size of "new" automobile (very small with very high mpg, small with high mpg, and hybrid using alternative fuels) do people in the sample believe are likely to have the most positive effects?
Unlock Deck
Unlock for access to all 28 flashcards in this deck.
Unlock Deck
k this deck
17
When summarizing a metric variable, what is the most informative measure of variability, and why is it the most informative measure?
Unlock Deck
Unlock for access to all 28 flashcards in this deck.
Unlock Deck
k this deck
18
Your Integrated Case
Advanced Automobile Concepts Summarization Analysis
Cory Rogers was happy to call Nick Thomas to inform him that Advanced Automobile Concepts survey data were collected and ready for analysis. Of course, Rogers had other marketing research projects and meetings scheduled with present and prospective clients, so he called in his data analyst, Celeste Brown. Brown was a recently graduated marketing major who had worked as a marketing intern at CMG Research last year. She had worked on a few small CMG survey data sets, but she had not yet tackled any large projects. Rogers called Brown into his office and said, "Celeste, it is time to do some analysis on the survey we did for Nick Thomas of Advanced Automobile Concepts. I am going to assign you primary responsibility for all data analysis on this important project. For now, let's just get a feel for what the data look like. I'll leave it up to your judgment as to what analyses to run, but for now, do some summarizations in order to reveal the basic patterns and to gain an understanding of the nature of the variability in the data. Let's meet on Thursday at 2:30 pm to see what you have found."
Your task in Case is to take the role of Celeste Brown, marketing analyst. The data set for the Advanced Automobile Concepts survey is now ready for summarization analysis. The file name is AAConcepts.xlsm, and it is in XL Data Analyst data file format. The instructor of your marketing research course will tell you how to access this data set. The data set sample represents American households, and it includes owners as well as nonowners of vehicles, because the hybrid vehicles being developed and marketed by the Advanced Automobile Concepts division of ZEN Motors will not "hit" the market for three to five more years.
The AAConcepts Define Variables worksheet defines the variables, but for easy reference, here is a list of the major variables in the survey. For any variables where the data coding is not clear in this case description, refer to the Define Variables worksheet.
All of the attitude variables are measured with a 7-point Likert scale, where 1 = "very strongly disagree" and 7 = "very strongly agree." The likelihoods of buying new automobile types are measured on a 100-point probability scale. The lifestyle types are measured on a 10-point scale, where 1 = "does not describe me at all" and 10 = "describes me almost perfectly." The preferences scale is a 7-point scale, with 1 = "very undesirable" and 7 = "very desirable."
Demographics
? Hometown size
? Gender
? Marital status
? Number of people in family
? Age category
? Education category
? Job type category
? Income category
? Dwelling type
Attitudes: Global Warming (Measure: 1-7)
? I am worried about global warming.
? Global warming is a real threat.
? We need to do something to slow global warming.
Attitudes: Gasoline Prices (Measure: 1-7)
? Gasoline prices will remain high in the future.
? Gasoline prices are too high now.
? High gasoline prices will impact what type of autos are purchased.
Automobile Ownership
? Primary vehicle price category
? Primary vehicle type
? Type of commuting
Attitudes: Gasoline Usage (Measure: 1-7)
? Gasoline emissions contribute to global warming.
? Americans use too much gasoline.
? We should be looking for gasoline substitutes.
Attitudes: Effects of New Automobile Types (Measure: 1-7)
? Very small autos with very high mpg will reduce fuel emissions.
? Very small autos with very high mpg will keep gas prices stable.
? Very small autos with very high mpg will slow global warming.
? Small autos with high mpg will reduce fuel emissions.
? Small autos with high mpg will keep gas prices stable.
? Small autos with high mpg will slow global warming.
? Hybrid autos that use alternative fuels will reduce fuel emissions.
Probabilities of Buying Hybrid Automobile Types (Measure: 0%-100%)
? Probability of buying a very small (one-seat) hybrid auto within three years?
? Probability of buying a small (two-seat) hybrid auto within three years?
? Probability of buying an economy-size hybrid auto within three years?
? Probability of buying a standard-size hybrid auto within three years?
? Probability of buying a large-size hybrid auto within three years?
Lifestyle Type (Measure: 1-10)
? Novelist -very early adopter, risk taker, "way out," "show off," want to be unique and special
? Innovator -Early adopter, less a risk taker than novelist, but into new technology; likes new products, but not a "show off"
? Trendsetter -Opinion leaders, well off financially and educationally, often the first adopters of new trends that are adopted by most of society
Favorite Television Show Type
? Comedy
? Drama
? Movies/Mini-series
? News/Documentary
? Reality, Science Fiction
? Sports
Favorite Magazine Type
? Business Money
? Music Entertainment
? Family Parenting
? Sports Outdoors
? Home Garden
? Cooking-Food Wine
? Trucks-Cars Motorcycles
? News-Politics Current Events
? Hybrid autos that use alternative fuels will keep gas prices down.
? Hybrid autos that use alternative fuels will slow global warming.
Preferences for Various Types of Hybrid Automobile Models (Measure: 1-7)
? Super cycle one-seat; 120+ mpg city
? Runabout sport two-seat; 90 mpg city, 120 mpg highway
? Runabout with luggage two-seat; 80 mpg city, 110 mpg highway
? Economy four-seat; 70 mpg city, 100 mpg highway
? Standard four-seat; 50 mpg city, 80 mpg highway
? Forerunner -Early majority of population, respected and fairly well off; not opinion leaders, but adopt new products before the "average" person
? Mainstreamer -Late majority of population, "average people" who are reserved and deliberate
? Classic -Laggards who cling to "old" ways
For each of the following questions, it is your task to determine the type of scale for each variable, so that you can conduct the proper summarization analysis with XL Data Analyst, and to interpret it.
What type of hybrid automobile is the most attractive to people in the sample in terms of likelihood of purchase in the next three years? What type is the least attractive?
Unlock Deck
Unlock for access to all 28 flashcards in this deck.
Unlock Deck
k this deck
19
Describe how a standard deviation is computed.
Unlock Deck
Unlock for access to all 28 flashcards in this deck.
Unlock Deck
k this deck
20
With reference to the formula, show how the standard deviation takes into account the typicality of every respondent.
Unlock Deck
Unlock for access to all 28 flashcards in this deck.
Unlock Deck
k this deck
21
What is the relationship between a standard deviation and a normal curve?
Unlock Deck
Unlock for access to all 28 flashcards in this deck.
Unlock Deck
k this deck
22
What output is generated by the XL Data Analyst with the following types?
a. Summarize-Average
b. Summarize-Percent
a. Summarize-Average
b. Summarize-Percent
Unlock Deck
Unlock for access to all 28 flashcards in this deck.
Unlock Deck
k this deck
23
What is data analysis?
Unlock Deck
Unlock for access to all 28 flashcards in this deck.
Unlock Deck
k this deck
24
In a survey on magazine subscriptions, respondents write in the names of magazines they subscribe to regularly. What measures of central tendency can be used? Which is the most appropriate and why?
Unlock Deck
Unlock for access to all 28 flashcards in this deck.
Unlock Deck
k this deck
25
Describe summarization analysis and provide an example.
Unlock Deck
Unlock for access to all 28 flashcards in this deck.
Unlock Deck
k this deck
26
Amanager has commissioned research on a special marketing problem. He is scheduled to brief the board of directors on the problem's resolution in video conference tomorrow morning. The research director works late that night in the downtown San Francisco headquarters and completes the summarization data analysis, which will be sufficient for the presentation. However, less than an hour before the meeting, the manager calls him for an earlymorning briefing on the survey's basic findings. The researcher looks around in his office and an idea flashes in his head. He immediately grabs a blank questionnaire. What is he about to do to facilitate the quick communication of the study's basic findings to the manager?
Unlock Deck
Unlock for access to all 28 flashcards in this deck.
Unlock Deck
k this deck
27
Describe generalization analysis and provide an example.
Unlock Deck
Unlock for access to all 28 flashcards in this deck.
Unlock Deck
k this deck
28
A professor asks his students how many hours they studied for the last exam. He finds that the class average is 10.5 hours and the standard deviation is 1.5 hours. The minimum is 2 hours, and the maximum is 20 hours. How would you describe the typical student's study time for this professor's last exam?
Unlock Deck
Unlock for access to all 28 flashcards in this deck.
Unlock Deck
k this deck
Unlock Deck
Unlock for access to all 28 flashcards in this deck.


