Deck 1: Functions and Change
Full screen (f)
Question
A. Which two lines in the following figure have the same slope? Enter your answer as "I and II," etc.
B. Which two lines have the same y-intercept?
C. Which line has the largest slope?
D. Which line has the largest y-intercept?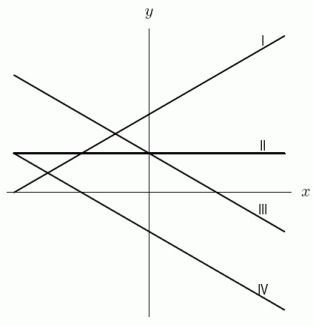
B. Which two lines have the same y-intercept?
C. Which line has the largest slope?
D. Which line has the largest y-intercept?
Question
Question
Question
Question
The empirical function  graphed below represents the population P of a city (in thousands of people) at time t. The _____ of the function is from 1900 to 1980, and the _____ of the function is from approximately 35,000 to 70,000 people.
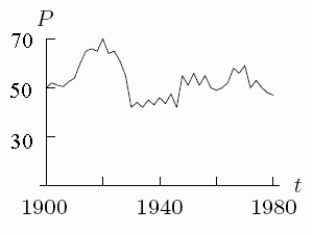
graphed below represents the population P of a city (in thousands of people) at time t. The _____ of the function is from 1900 to 1980, and the _____ of the function is from approximately 35,000 to 70,000 people. Question
The height (in inches) and weight (in pounds) of 8 students is given in the following table. Find a regression line for this data and use it to estimate the weight of a person who is 5 feet 1 inches tall. Round to the nearest pound. 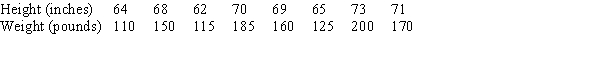
Question
Find the value for b in the following table of values for the linear function f. 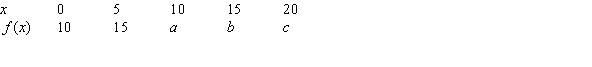
Question
Find a formula for the linear function f. . 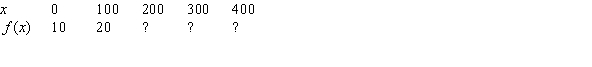
A)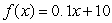
B)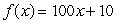
C)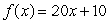
D)
A)
B)
C)
D)
Question
Let 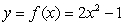 .
.
A. Find the value of y when x is zero.
B. Find f(3).
.A. Find the value of y when x is zero.
B. Find f(3).
Question
A graph of  is given in the following figure.
A. What is (to the nearest whole number)?
B. What is the range of the function?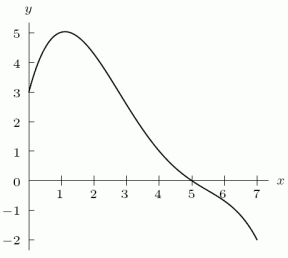
is given in the following figure.A. What is
(to the nearest whole number)?B. What is the range of the function?
Question
Question
Question
Harley Davidson (ticker symbol HOG) stock prices dropped sharply in late 2008. Series 1 in the graph below shows the actual prices at the end of each week. The trend over time is approximately linear; and the graph of a possible linear model is given by Series 2. Based on the data given, find the linear model and use it to approximate the stock's price on November 30, 2008, assuming the current trend continued. 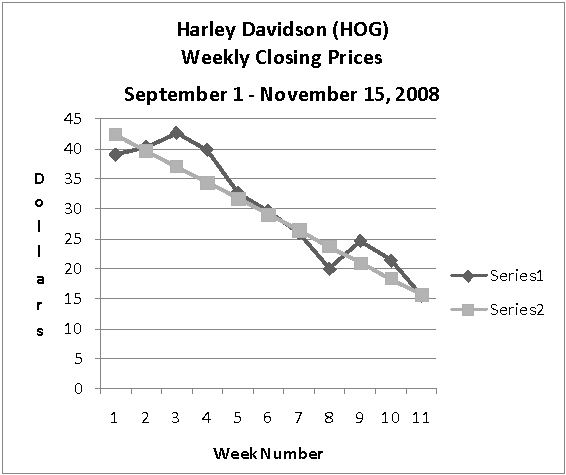
Question
Question
Question
From the following table,
A. Find f(4)
B. Find the value(s) of x for which . If there is more than one, list them in increasing order, separated by commas.
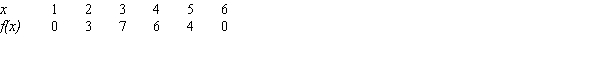
A. Find f(4)
B. Find the value(s) of x for which
. If there is more than one, list them in increasing order, separated by commas. Question
Suppose that  is the distance in miles traveled in t hours by a car moving at 70 miles per hour. Give a formula for the function
  .
.
is the distance in miles traveled in t hours by a car moving at 70 miles per hour. Give a formula for the function . Question
The average weight in pounds of American men in their sixties (in 1979) as a function of their heights in inches is given in the following table. The formula that expresses the weight w in terms of the height h is given by w = _____+_____h 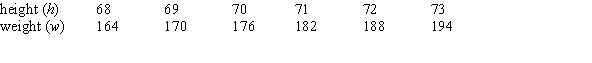
Question
Question
Could the following table represent a linear function? Answer yes or no. 
Question
The following figure gives both supply and demand curves for a certain product. If the price is $50 per item, how many items will the consumers buy? 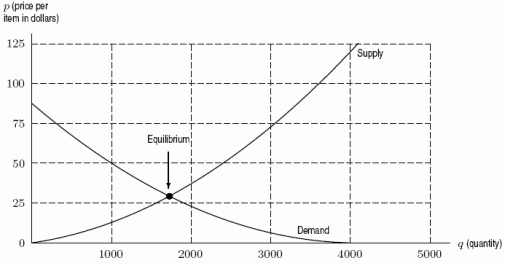
A)1000
B)2400
C)1700
D)4000
A)1000
B)2400
C)1700
D)4000
Question
Question
The following table gives the number of students taking an applied calculus course at a community college. Find the change in the number of students taking the course between 2001 and 2004. 
Question
Question
The following graph shows the quantity of goods purchased by consumers at various prices. If the price is $15 per item, how many items do consumers purchase? 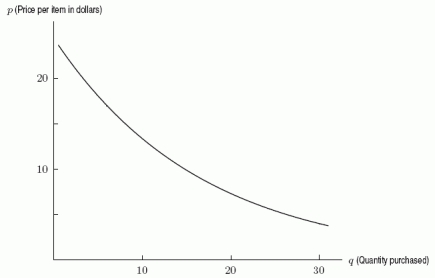
A)5
B)8
C)12
D)15
A)5
B)8
C)12
D)15
Question
Suppose that  is the price per unit (in dollars) of widgets which will induce producers to supply q thousand widgets to the market, and suppose that
  is the price per unit at which consumers will buy q thousand units. If
  and
and  , what do you predict about the future selling price of widgets (currently at $10)?
A)It will rise.
B)It will fall.
is the price per unit (in dollars) of widgets which will induce producers to supply q thousand widgets to the market, and suppose that is the price per unit at which consumers will buy q thousand units. If and , what do you predict about the future selling price of widgets (currently at $10)?A)It will rise.
B)It will fall.
Question
The following figure gives both supply and demand curves for a certain product. If the price is $75 per item, would you expect the market pressures to push the price higher or lower? 
A)higher
B)lower
A)higher
B)lower
Question
Suppose that  is the price per unit (in dollars) of widgets which will induce producers to supply q thousand widgets to the market, and suppose that
  is the price per unit at which consumers will buy q thousand units. Which is larger, S(150) or S(100)?
A)S(100)
B)S(150)
is the price per unit (in dollars) of widgets which will induce producers to supply q thousand widgets to the market, and suppose that is the price per unit at which consumers will buy q thousand units. Which is larger, S(150) or S(100)?A)S(100)
B)S(150)
Question
Question
The number of reported offenses of violent crime in the U.S. between 1983 and 1996 is given in the following table.
A. Find the average rate of change between 1983 and 1992 (to the nearest integer).
B. Find the average rate of change between 1992 and 1996 (to the nearest integer).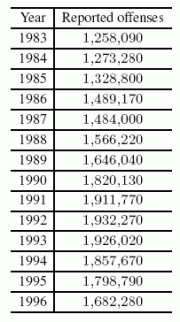
A. Find the average rate of change between 1983 and 1992 (to the nearest integer).
B. Find the average rate of change between 1992 and 1996 (to the nearest integer).
Question
Values for g(x) are given in the following table. Does it appear that g(x) is concave up or concave down? 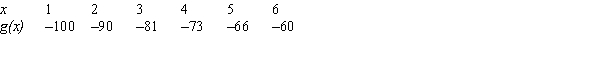
Question
The distance  in feet that a golf ball will fall in t seconds if dropped from a very high tower is given by the formula
  . Make and label a table or a graph of values of f(t) giving distances fallen for the time period
  . Using your table or graph, the change in the height of the golf ball between times t = 5 and t = 7 is _____ feet, and the average rate of change in the height of the golf ball between times t = 5 and t = 7 is____ feet per second.
in feet that a golf ball will fall in t seconds if dropped from a very high tower is given by the formula . Make and label a table or a graph of values of f(t) giving distances fallen for the time period . Using your table or graph, the change in the height of the golf ball between times t = 5 and t = 7 is _____ feet, and the average rate of change in the height of the golf ball between times t = 5 and t = 7 is____ feet per second. Question
The table gives information about the number of cases of pancreatic cancer diagnosed in the United States.  A) Find the average rate of change in number of cases from 1997 to 2002.
B) Find the average rate of change in number of cases from 2002 to 2004.
C) Is the average rate of change increasing or decreasing?
A) Find the average rate of change in number of cases from 1997 to 2002.B) Find the average rate of change in number of cases from 2002 to 2004.
C) Is the average rate of change increasing or decreasing?
Question
Consider the following graph. Between point A and point B, the graph is: (mark all that apply) 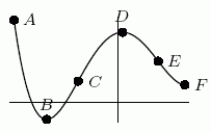
A)decreasing
B)increasing
C)concave up
D)concave down
A)decreasing
B)increasing
C)concave up
D)concave down
Question
Question
A textbook company had fixed costs of $15,000 and variable costs of $20 for a certain book. The company sells the books for $30 each. Find a formula for the profit function,  .
.
. Question
Find the average rate of change of 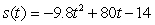 between t = 1 and t = 3. Round to two decimal places.
A)40.80
B)81.60
C)120.8
D)43.92
between t = 1 and t = 3. Round to two decimal places.A)40.80
B)81.60
C)120.8
D)43.92
Question
Question
The following table gives the number of students taking an applied calculus course at a community college.
A. Find the average rate of change in the number of students taking the course between 2000 and 2004 (in students per year).
B. If the average rate of change continues at the same rate as between 2000 and 2004, in which year will the number of students taking the course first exceed 900?
A. Find the average rate of change in the number of students taking the course between 2000 and 2004 (in students per year).
B. If the average rate of change continues at the same rate as between 2000 and 2004, in which year will the number of students taking the course first exceed 900?
Question
Values of a linear cost function are given in the following table. Find a formula for the cost function. 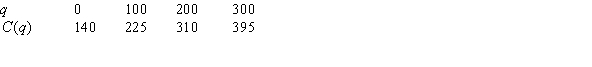
Question
Question
A town has 800 people initially. Find the formula for the population of the town, P, in terms of the number of years, t, if the town shrinks at an annual rate of 13% a year.
A)
B)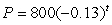
C)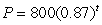
D)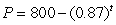
A)
B)
C)
D)
Question
The demand and supply curves for a certain product are given in terms of price, p, by  and
and  . What is the equilibrium price?
A)$7
B)$2
C)$28
D)$200
and . What is the equilibrium price?A)$7
B)$2
C)$28
D)$200
Question
A population is growing according to the formula  , where P is the population at year t. What is the initial population?
A)507
B)426
C)107
D)400
, where P is the population at year t. What is the initial population?A)507
B)426
C)107
D)400
Question
A population is growing according to the formula  , where P is the population in year t. How many years will it take for the population to exceed 1000?
A)151
B)28
C)29
D)150
, where P is the population in year t. How many years will it take for the population to exceed 1000?A)151
B)28
C)29
D)150
Question
A population of rabbits is growing. In 2006, there were 10,000,000 rabbits, and the rate of increase was 10% per decade. Find  , the formula to predict the population t years after 2006.
A)
B)
C)
D)
, the formula to predict the population t years after 2006.A)
B)
C)
D)
Question
A population is growing according to the formula  , where P is the population at year t. What is the annual growth rate?
A)3.25%
B)3.41%
C)5%
D)10.25%
, where P is the population at year t. What is the annual growth rate?A)3.25%
B)3.41%
C)5%
D)10.25%
Question
The cost of producing q items in a tortilla factory is given by  dollars. The revenue from sales of q items is
  dollars.
A. For what values of q does the tortilla factory make a profit?
B. Write a formula for profit as a function of q.
dollars. The revenue from sales of q items is dollars.A. For what values of q does the tortilla factory make a profit?
B. Write a formula for profit as a function of q.
Question
Production costs for manufacturing t-shirts consist of a fixed cost of $12,000 plus variable costs of $2 per shirt. Each t-shirt sells for $7 dollars. Find the total profit,  , as a function of the number of shirts produced, q.
A)
B)
C)
D)
, as a function of the number of shirts produced, q.A)
B)
C)
D)
Question
The following table gives values of three functions. Which one(s) could possibly be linear? Select all that apply. 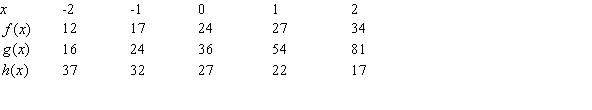
A)
B)
C)
A)
B)
C)
Question
A town has 2400 people initially. Find the formula for the population of the town, P, in terms of the number of years, t, if the town grows by 70 people a year.
A)
B)
C)
D)
A)
B)
C)
D)
Question
A population is growing according to the formula  . What is the population in year 9?
A)460
B)2,408
C)7,013
D)252
. What is the population in year 9?A)460
B)2,408
C)7,013
D)252
Question
A town has 2400 people initially. Find the formula for the population of the town, P, in terms of the number of years, t, if the town shrinks by 70 people a year.
A)
B)
C)
D)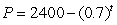
A)
B)
C)
D)
Question
Question
The following table gives values of three functions. Which one(s) could possibly be exponential? Select all that apply. 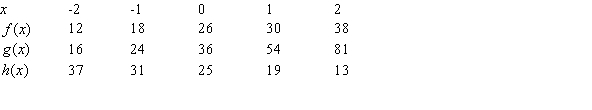
A)
B)
C)
A)
B)
C)
Question
Question
A teenager has $36 to spend at a carnival on both food and rides. Food costs (on average) $4 per item, and rides cost (on average) $2 each. Let f be the number of food items purchased and r be the number of rides purchased. What is the equation of the teenager's budget constraint?
A)
B)
C)
D)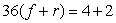
A)
B)
C)
D)
Question
Identify the function defined in the following table as potentially linear, exponential, or neither. 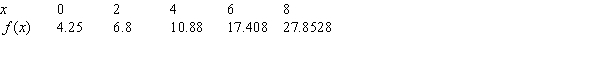
A)exponential
B)neither
C)linear
A)exponential
B)neither
C)linear
Question
A town has 1200 people initially. Find the formula for the population of the town, P, in terms of the number of years, t, if the town grows at an annual rate of 8% a year.
A)
B)
C)
D)
A)
B)
C)
D)
Question
The demand and supply curves for a certain product are given in terms of price, p, by  and
and 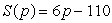 . What is the equilibrium quantity?
A)35
B)100
C)2
D)270
and . What is the equilibrium quantity?A)35
B)100
C)2
D)270
Question
Question
Using the table, find the value of a if f is exponential. 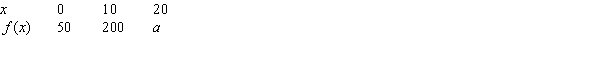
Question
The following table shows values for an exponential function,  . Find a formula for
  . Table entries are rounded to two decimal places.
. Find a formula for . Table entries are rounded to two decimal places. Question
Find a formula for the exponential function partially defined in the following table. Round any constants to 3 decimal places. 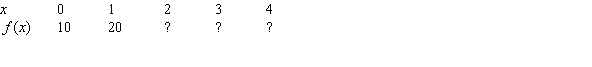
Question
Question
Question
Question
Does  represent exponential growth or decay?
represent exponential growth or decay? Question
Question
Question
Question
Which could be a possible formula for the following figure? Assume a and b are positive constants. 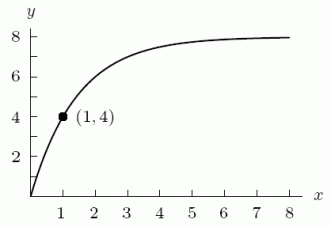
A)
B)
C)
D)
A)
B)
C)
D)
Question
Which could be a possible formula for the following figure? Assume a and b are positive constants. 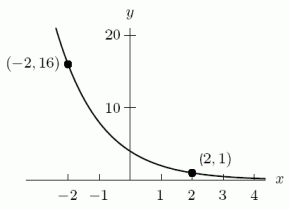
A)
B)
C)
D)
A)
B)
C)
D)
Question
Using the table, find the value of a if f is linear. 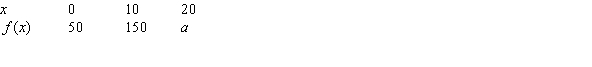
Question
The following tables shows values for two functions. Which one could be exponential? 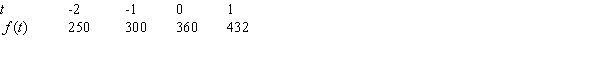
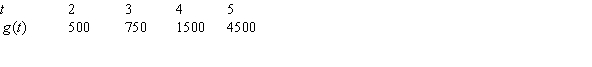
A)
B)
A)
B)
Question
Which could be a possible formula for the following figure? Assume a and b are positive constants. 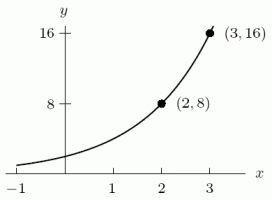
A)
B)
C)
D)
A)
B)
C)
D)
Question
Solve 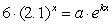 for both a and k. Round to 3 decimal places.
a=_____ k=_____
for both a and k. Round to 3 decimal places.a=_____ k=_____
Question
Solve  for t. Round to 3 decimal places.
for t. Round to 3 decimal places. Question
Question
Does  represent exponential growth or decay?
represent exponential growth or decay?
Unlock Deck
Sign up to unlock the cards in this deck!
Unlock Deck
Unlock Deck
1/204
Play
Full screen (f)
Deck 1: Functions and Change
1
A. Which two lines in the following figure have the same slope? Enter your answer as "I and II," etc.
B. Which two lines have the same y-intercept?
C. Which line has the largest slope?
D. Which line has the largest y-intercept?
B. Which two lines have the same y-intercept?
C. Which line has the largest slope?
D. Which line has the largest y-intercept?
A. III and IV
B. II and III
C. I
D. I
B. II and III
C. I
D. I
2
The equation of the line through the points (1, 2) and (-1, -4) is:

3
The population of Los Angeles, California was 2,811,801 in 1970 and was 3,448,613 in 1994. The average rate of change in the population of Los Angeles between 1970 and 1994 was _____ people per year.
26,534
4
The bill for electricity is $200 when 55 kilowatt hours are used and $300 when 95 kilowatt hours are used.
A. The base cost (without using any electricity) is $______.
B. Each additional kilowatt hour used costs $_____.
A. The base cost (without using any electricity) is $______.
B. Each additional kilowatt hour used costs $_____.
Unlock Deck
Unlock for access to all 204 flashcards in this deck.
Unlock Deck
k this deck
5
The empirical function graphed below represents the population P of a city (in thousands of people) at time t. The _____ of the function is from 1900 to 1980, and the _____ of the function is from approximately 35,000 to 70,000 people.
graphed below represents the population P of a city (in thousands of people) at time t. The _____ of the function is from 1900 to 1980, and the _____ of the function is from approximately 35,000 to 70,000 people. Unlock Deck
Unlock for access to all 204 flashcards in this deck.
Unlock Deck
k this deck
6
The height (in inches) and weight (in pounds) of 8 students is given in the following table. Find a regression line for this data and use it to estimate the weight of a person who is 5 feet 1 inches tall. Round to the nearest pound.
Unlock Deck
Unlock for access to all 204 flashcards in this deck.
Unlock Deck
k this deck
7
Find the value for b in the following table of values for the linear function f.
Unlock Deck
Unlock for access to all 204 flashcards in this deck.
Unlock Deck
k this deck
8
Find a formula for the linear function f. .
A)
B)
C)
D)
A)
B)
C)
D)
Unlock Deck
Unlock for access to all 204 flashcards in this deck.
Unlock Deck
k this deck
9
Let .
A. Find the value of y when x is zero.
B. Find f(3).
.A. Find the value of y when x is zero.
B. Find f(3).
Unlock Deck
Unlock for access to all 204 flashcards in this deck.
Unlock Deck
k this deck
10
A graph of is given in the following figure.
A. What is (to the nearest whole number)?
B. What is the range of the function?
is given in the following figure.A. What is
(to the nearest whole number)?B. What is the range of the function?
Unlock Deck
Unlock for access to all 204 flashcards in this deck.
Unlock Deck
k this deck
11
A school library opened in 1980. In January of 2000, they had 16,000 books. One year later, they had 16,840 books. Assuming they acquire the same number of books at the start of each month, give a linear formula for the number of books, N, in the library as a function of the number of years, t, the library has been open.
Unlock Deck
Unlock for access to all 204 flashcards in this deck.
Unlock Deck
k this deck
12
A school library opened in 1980. In January of 2000, they had 33,000 books. One year later, they had 33,240 books. Assume they acquire the same number of books at the start of each month.
A. How many books did they have in January of 2003?
B. How many books did they have in July of 1980?
A. How many books did they have in January of 2003?
B. How many books did they have in July of 1980?
Unlock Deck
Unlock for access to all 204 flashcards in this deck.
Unlock Deck
k this deck
13
Harley Davidson (ticker symbol HOG) stock prices dropped sharply in late 2008. Series 1 in the graph below shows the actual prices at the end of each week. The trend over time is approximately linear; and the graph of a possible linear model is given by Series 2. Based on the data given, find the linear model and use it to approximate the stock's price on November 30, 2008, assuming the current trend continued.
Unlock Deck
Unlock for access to all 204 flashcards in this deck.
Unlock Deck
k this deck
14
A car is worth $15,000 when it is 1 year old, and it is worth $8,000 when it is three years old.
A. Write the value of the car, V (in dollars), as a function of the age of the car, a (in years). Assume this is a linear function.
B. How much does the car depreciate in value each year?
C. How much was the car worth when it was first purchased?
A. Write the value of the car, V (in dollars), as a function of the age of the car, a (in years). Assume this is a linear function.
B. How much does the car depreciate in value each year?
C. How much was the car worth when it was first purchased?
Unlock Deck
Unlock for access to all 204 flashcards in this deck.
Unlock Deck
k this deck
15
A furniture moving company charges a fixed amount plus a charge for each pound that they move. A person who shipped 60 pounds of furniture was charged $280, while someone else was charged $610 to ship 170 pounds.
A. Write a function that represents the moving cost, C, in terms of pounds, x, and fixed cost.
B. Suppose the company changes their rates. They increase the per pound charge by $1 but cut the fixed amount they charge by half. What is the new function that represents the new moving cost, D?
C. Will someone who ships 170 pounds pay more or less with the new rates than they would have with the original rates?
Unlock Deck
Unlock for access to all 204 flashcards in this deck.
Unlock Deck
k this deck
16
From the following table,
A. Find f(4)
B. Find the value(s) of x for which . If there is more than one, list them in increasing order, separated by commas.
A. Find f(4)
B. Find the value(s) of x for which
. If there is more than one, list them in increasing order, separated by commas. Unlock Deck
Unlock for access to all 204 flashcards in this deck.
Unlock Deck
k this deck
17
Suppose that is the distance in miles traveled in t hours by a car moving at 70 miles per hour. Give a formula for the function .
is the distance in miles traveled in t hours by a car moving at 70 miles per hour. Give a formula for the function . Unlock Deck
Unlock for access to all 204 flashcards in this deck.
Unlock Deck
k this deck
18
The average weight in pounds of American men in their sixties (in 1979) as a function of their heights in inches is given in the following table. The formula that expresses the weight w in terms of the height h is given by w = _____+_____h
Unlock Deck
Unlock for access to all 204 flashcards in this deck.
Unlock Deck
k this deck
19
Do you expect the average rate of change in the number of smart phones in the U.S. since 2000 to be positive or negative?
Unlock Deck
Unlock for access to all 204 flashcards in this deck.
Unlock Deck
k this deck
20
Could the following table represent a linear function? Answer yes or no.
Unlock Deck
Unlock for access to all 204 flashcards in this deck.
Unlock Deck
k this deck
21
The following figure gives both supply and demand curves for a certain product. If the price is $50 per item, how many items will the consumers buy?
A)1000
B)2400
C)1700
D)4000
A)1000
B)2400
C)1700
D)4000
Unlock Deck
Unlock for access to all 204 flashcards in this deck.
Unlock Deck
k this deck
22
A premium ice cream company finds that at a price of $5.50, demand for their ice cream cones is 2500. For each $0.25 increase in price, the demand decreases by 50. Graph the revenue function and find the price that will maximize revenue.
Unlock Deck
Unlock for access to all 204 flashcards in this deck.
Unlock Deck
k this deck
23
The following table gives the number of students taking an applied calculus course at a community college. Find the change in the number of students taking the course between 2001 and 2004.
Unlock Deck
Unlock for access to all 204 flashcards in this deck.
Unlock Deck
k this deck
24
A textbook company had fixed costs of $15,000 and variable costs of $20 for a certain book. The company sells the books for $40 each. What is the break-even point for the company (to the nearest book)?
Unlock Deck
Unlock for access to all 204 flashcards in this deck.
Unlock Deck
k this deck
25
The following graph shows the quantity of goods purchased by consumers at various prices. If the price is $15 per item, how many items do consumers purchase?
A)5
B)8
C)12
D)15
A)5
B)8
C)12
D)15
Unlock Deck
Unlock for access to all 204 flashcards in this deck.
Unlock Deck
k this deck
26
Suppose that is the price per unit (in dollars) of widgets which will induce producers to supply q thousand widgets to the market, and suppose that is the price per unit at which consumers will buy q thousand units. If and , what do you predict about the future selling price of widgets (currently at $10)?
A)It will rise.
B)It will fall.
is the price per unit (in dollars) of widgets which will induce producers to supply q thousand widgets to the market, and suppose that is the price per unit at which consumers will buy q thousand units. If and , what do you predict about the future selling price of widgets (currently at $10)?A)It will rise.
B)It will fall.
Unlock Deck
Unlock for access to all 204 flashcards in this deck.
Unlock Deck
k this deck
27
The following figure gives both supply and demand curves for a certain product. If the price is $75 per item, would you expect the market pressures to push the price higher or lower?
A)higher
B)lower
A)higher
B)lower
Unlock Deck
Unlock for access to all 204 flashcards in this deck.
Unlock Deck
k this deck
28
Suppose that is the price per unit (in dollars) of widgets which will induce producers to supply q thousand widgets to the market, and suppose that is the price per unit at which consumers will buy q thousand units. Which is larger, S(150) or S(100)?
A)S(100)
B)S(150)
is the price per unit (in dollars) of widgets which will induce producers to supply q thousand widgets to the market, and suppose that is the price per unit at which consumers will buy q thousand units. Which is larger, S(150) or S(100)?A)S(100)
B)S(150)
Unlock Deck
Unlock for access to all 204 flashcards in this deck.
Unlock Deck
k this deck
29
A $2000 pump depreciates linearly. It is worth $1200 in 4 years. How many years will it be before the pump is worth nothing?
Unlock Deck
Unlock for access to all 204 flashcards in this deck.
Unlock Deck
k this deck
30
The number of reported offenses of violent crime in the U.S. between 1983 and 1996 is given in the following table.
A. Find the average rate of change between 1983 and 1992 (to the nearest integer).
B. Find the average rate of change between 1992 and 1996 (to the nearest integer).
A. Find the average rate of change between 1983 and 1992 (to the nearest integer).
B. Find the average rate of change between 1992 and 1996 (to the nearest integer).
Unlock Deck
Unlock for access to all 204 flashcards in this deck.
Unlock Deck
k this deck
31
Values for g(x) are given in the following table. Does it appear that g(x) is concave up or concave down?
Unlock Deck
Unlock for access to all 204 flashcards in this deck.
Unlock Deck
k this deck
32
The distance in feet that a golf ball will fall in t seconds if dropped from a very high tower is given by the formula . Make and label a table or a graph of values of f(t) giving distances fallen for the time period . Using your table or graph, the change in the height of the golf ball between times t = 5 and t = 7 is _____ feet, and the average rate of change in the height of the golf ball between times t = 5 and t = 7 is____ feet per second.
in feet that a golf ball will fall in t seconds if dropped from a very high tower is given by the formula . Make and label a table or a graph of values of f(t) giving distances fallen for the time period . Using your table or graph, the change in the height of the golf ball between times t = 5 and t = 7 is _____ feet, and the average rate of change in the height of the golf ball between times t = 5 and t = 7 is____ feet per second. Unlock Deck
Unlock for access to all 204 flashcards in this deck.
Unlock Deck
k this deck
33
The table gives information about the number of cases of pancreatic cancer diagnosed in the United States. A) Find the average rate of change in number of cases from 1997 to 2002.
B) Find the average rate of change in number of cases from 2002 to 2004.
C) Is the average rate of change increasing or decreasing?
A) Find the average rate of change in number of cases from 1997 to 2002.B) Find the average rate of change in number of cases from 2002 to 2004.
C) Is the average rate of change increasing or decreasing?
Unlock Deck
Unlock for access to all 204 flashcards in this deck.
Unlock Deck
k this deck
34
Consider the following graph. Between point A and point B, the graph is: (mark all that apply)
A)decreasing
B)increasing
C)concave up
D)concave down
A)decreasing
B)increasing
C)concave up
D)concave down
Unlock Deck
Unlock for access to all 204 flashcards in this deck.
Unlock Deck
k this deck
35
A $3000 pump depreciates linearly . It is worth $2200 in 4 years. Find a formula for the value of the pump, V, as a function of time, t (in years) since it was purchased.
Unlock Deck
Unlock for access to all 204 flashcards in this deck.
Unlock Deck
k this deck
36
A textbook company had fixed costs of $15,000 and variable costs of $20 for a certain book. The company sells the books for $30 each. Find a formula for the profit function, .
. Unlock Deck
Unlock for access to all 204 flashcards in this deck.
Unlock Deck
k this deck
37
Find the average rate of change of between t = 1 and t = 3. Round to two decimal places.
A)40.80
B)81.60
C)120.8
D)43.92
between t = 1 and t = 3. Round to two decimal places.A)40.80
B)81.60
C)120.8
D)43.92
Unlock Deck
Unlock for access to all 204 flashcards in this deck.
Unlock Deck
k this deck
38
The total sales of household computers in the U.S., as measured by sales to retail consumer dealers, in millions of dollars, was 2,385 in 1984 and 16,585 in 1997.
A. Find the average rate of change in sales between 1984 and 1997 (in millions of dollars, to the nearest tenth).
B. Use your answer to estimate total sales in 2000 (in millions of dollars, to the nearest tenth).
A. Find the average rate of change in sales between 1984 and 1997 (in millions of dollars, to the nearest tenth).
B. Use your answer to estimate total sales in 2000 (in millions of dollars, to the nearest tenth).
Unlock Deck
Unlock for access to all 204 flashcards in this deck.
Unlock Deck
k this deck
39
The following table gives the number of students taking an applied calculus course at a community college.
A. Find the average rate of change in the number of students taking the course between 2000 and 2004 (in students per year).
B. If the average rate of change continues at the same rate as between 2000 and 2004, in which year will the number of students taking the course first exceed 900?
A. Find the average rate of change in the number of students taking the course between 2000 and 2004 (in students per year).
B. If the average rate of change continues at the same rate as between 2000 and 2004, in which year will the number of students taking the course first exceed 900?
Unlock Deck
Unlock for access to all 204 flashcards in this deck.
Unlock Deck
k this deck
40
Values of a linear cost function are given in the following table. Find a formula for the cost function.
Unlock Deck
Unlock for access to all 204 flashcards in this deck.
Unlock Deck
k this deck
41
Production costs for manufacturing T-shirts consist of a fixed cost of $18,000 plus variable costs of $4 per shirt. Each T-shirt sells for $12 dollars. What is the marginal cost?
A)$4
B)$12
C)$8
D)$18,000
A)$4
B)$12
C)$8
D)$18,000
Unlock Deck
Unlock for access to all 204 flashcards in this deck.
Unlock Deck
k this deck
42
A town has 800 people initially. Find the formula for the population of the town, P, in terms of the number of years, t, if the town shrinks at an annual rate of 13% a year.
A)
B)
C)
D)
A)
B)
C)
D)
Unlock Deck
Unlock for access to all 204 flashcards in this deck.
Unlock Deck
k this deck
43
The demand and supply curves for a certain product are given in terms of price, p, by and . What is the equilibrium price?
A)$7
B)$2
C)$28
D)$200
and . What is the equilibrium price?A)$7
B)$2
C)$28
D)$200
Unlock Deck
Unlock for access to all 204 flashcards in this deck.
Unlock Deck
k this deck
44
A population is growing according to the formula , where P is the population at year t. What is the initial population?
A)507
B)426
C)107
D)400
, where P is the population at year t. What is the initial population?A)507
B)426
C)107
D)400
Unlock Deck
Unlock for access to all 204 flashcards in this deck.
Unlock Deck
k this deck
45
A population is growing according to the formula , where P is the population in year t. How many years will it take for the population to exceed 1000?
A)151
B)28
C)29
D)150
, where P is the population in year t. How many years will it take for the population to exceed 1000?A)151
B)28
C)29
D)150
Unlock Deck
Unlock for access to all 204 flashcards in this deck.
Unlock Deck
k this deck
46
A population of rabbits is growing. In 2006, there were 10,000,000 rabbits, and the rate of increase was 10% per decade. Find , the formula to predict the population t years after 2006.
A)
B)
C)
D)
, the formula to predict the population t years after 2006.A)
B)
C)
D)
Unlock Deck
Unlock for access to all 204 flashcards in this deck.
Unlock Deck
k this deck
47
A population is growing according to the formula , where P is the population at year t. What is the annual growth rate?
A)3.25%
B)3.41%
C)5%
D)10.25%
, where P is the population at year t. What is the annual growth rate?A)3.25%
B)3.41%
C)5%
D)10.25%
Unlock Deck
Unlock for access to all 204 flashcards in this deck.
Unlock Deck
k this deck
48
The cost of producing q items in a tortilla factory is given by dollars. The revenue from sales of q items is dollars.
A. For what values of q does the tortilla factory make a profit?
B. Write a formula for profit as a function of q.
dollars. The revenue from sales of q items is dollars.A. For what values of q does the tortilla factory make a profit?
B. Write a formula for profit as a function of q.
Unlock Deck
Unlock for access to all 204 flashcards in this deck.
Unlock Deck
k this deck
49
Production costs for manufacturing t-shirts consist of a fixed cost of $12,000 plus variable costs of $2 per shirt. Each t-shirt sells for $7 dollars. Find the total profit, , as a function of the number of shirts produced, q.
A)
B)
C)
D)
, as a function of the number of shirts produced, q.A)
B)
C)
D)
Unlock Deck
Unlock for access to all 204 flashcards in this deck.
Unlock Deck
k this deck
50
The following table gives values of three functions. Which one(s) could possibly be linear? Select all that apply.
A)
B)
C)
A)
B)
C)
Unlock Deck
Unlock for access to all 204 flashcards in this deck.
Unlock Deck
k this deck
51
A town has 2400 people initially. Find the formula for the population of the town, P, in terms of the number of years, t, if the town grows by 70 people a year.
A)
B)
C)
D)
A)
B)
C)
D)
Unlock Deck
Unlock for access to all 204 flashcards in this deck.
Unlock Deck
k this deck
52
A population is growing according to the formula . What is the population in year 9?
A)460
B)2,408
C)7,013
D)252
. What is the population in year 9?A)460
B)2,408
C)7,013
D)252
Unlock Deck
Unlock for access to all 204 flashcards in this deck.
Unlock Deck
k this deck
53
A town has 2400 people initially. Find the formula for the population of the town, P, in terms of the number of years, t, if the town shrinks by 70 people a year.
A)
B)
C)
D)
A)
B)
C)
D)
Unlock Deck
Unlock for access to all 204 flashcards in this deck.
Unlock Deck
k this deck
54
A population of rabbits is growing. In 2005, there were 10,000,000 rabbits, and the population was increasing at a rate of 20% per decade. What is the predicted rabbit population in 2016? Round to the nearest rabbit.
Unlock Deck
Unlock for access to all 204 flashcards in this deck.
Unlock Deck
k this deck
55
The following table gives values of three functions. Which one(s) could possibly be exponential? Select all that apply.
A)
B)
C)
A)
B)
C)
Unlock Deck
Unlock for access to all 204 flashcards in this deck.
Unlock Deck
k this deck
56
Production costs for manufacturing T-shirts consist of a fixed cost of $18,000 plus variable costs of $2 per shirt. Each T-shirt sells for $8 dollars. How many T-shirts must be sold for the company to break even?
A)2,250
B)3,000
C)9,000
D)5,625
A)2,250
B)3,000
C)9,000
D)5,625
Unlock Deck
Unlock for access to all 204 flashcards in this deck.
Unlock Deck
k this deck
57
A teenager has $36 to spend at a carnival on both food and rides. Food costs (on average) $4 per item, and rides cost (on average) $2 each. Let f be the number of food items purchased and r be the number of rides purchased. What is the equation of the teenager's budget constraint?
A)
B)
C)
D)
A)
B)
C)
D)
Unlock Deck
Unlock for access to all 204 flashcards in this deck.
Unlock Deck
k this deck
58
Identify the function defined in the following table as potentially linear, exponential, or neither.
A)exponential
B)neither
C)linear
A)exponential
B)neither
C)linear
Unlock Deck
Unlock for access to all 204 flashcards in this deck.
Unlock Deck
k this deck
59
A town has 1200 people initially. Find the formula for the population of the town, P, in terms of the number of years, t, if the town grows at an annual rate of 8% a year.
A)
B)
C)
D)
A)
B)
C)
D)
Unlock Deck
Unlock for access to all 204 flashcards in this deck.
Unlock Deck
k this deck
60
The demand and supply curves for a certain product are given in terms of price, p, by and . What is the equilibrium quantity?
A)35
B)100
C)2
D)270
and . What is the equilibrium quantity?A)35
B)100
C)2
D)270
Unlock Deck
Unlock for access to all 204 flashcards in this deck.
Unlock Deck
k this deck
61
A bar of soap starts out at 100 grams. Write a formula for the quantity S grams of soap remaining after t days if the decrease is 5% per day
Unlock Deck
Unlock for access to all 204 flashcards in this deck.
Unlock Deck
k this deck
62
Using the table, find the value of a if f is exponential.
Unlock Deck
Unlock for access to all 204 flashcards in this deck.
Unlock Deck
k this deck
63
The following table shows values for an exponential function, . Find a formula for . Table entries are rounded to two decimal places.
. Find a formula for . Table entries are rounded to two decimal places. Unlock Deck
Unlock for access to all 204 flashcards in this deck.
Unlock Deck
k this deck
64
Find a formula for the exponential function partially defined in the following table. Round any constants to 3 decimal places.
Unlock Deck
Unlock for access to all 204 flashcards in this deck.
Unlock Deck
k this deck
65
A photocopy machine can reduce copies to 90% or 70% of their original size. By copying an already reduced copy, further reductions can be made. Write a formula for the size of the image, N, after the original image of size a has been reduced n times with the copy machine set on 90% reduction.
Unlock Deck
Unlock for access to all 204 flashcards in this deck.
Unlock Deck
k this deck
66
A bakery has 800 pounds of flour. If they use 5% of the available flour each day, how many pounds do they have left after 9 days? Round to the nearest pound.
Unlock Deck
Unlock for access to all 204 flashcards in this deck.
Unlock Deck
k this deck
67
Joe invested $10,000 in the stock market, while Sam invested $20,000. Joe's investment increased by 6% per year for 10 years. Sam's investment decreased in value by 12% per year for 5 years and then increased by 12% per year for the next 5 years. What was Joe's investment worth after 10 years? Round to the nearest dollar.
Unlock Deck
Unlock for access to all 204 flashcards in this deck.
Unlock Deck
k this deck
68
Does represent exponential growth or decay?
represent exponential growth or decay? Unlock Deck
Unlock for access to all 204 flashcards in this deck.
Unlock Deck
k this deck
69
A photocopy machine can reduce copies to 90% or 70% of their original size. By copying an already reduced copy, further reductions can be made. Which will be larger, an image that has been reduced on the 90% setting 10 times, or the same image after being reduced 3 times on the 70% setting?
A)The image reduced on the 90% setting
B)The image reduced on the 70% setting
A)The image reduced on the 90% setting
B)The image reduced on the 70% setting
Unlock Deck
Unlock for access to all 204 flashcards in this deck.
Unlock Deck
k this deck
70
A bar of soap starts out weighing 125 grams. Write a formula for the quantity S grams of soap remaining after t days if the decrease is 5 grams per day.
Unlock Deck
Unlock for access to all 204 flashcards in this deck.
Unlock Deck
k this deck
71
You were the housing minister in the year 1996 for a country with 30 million people. You were asked to predict the population 15 years from 1996 as part of a 15 year master plan for housing. Census records show that the population was 22.684 million in 1986 and 26.087 million in 1991. What was your best prediction of the population 15 years from 1996?
A)45.626 million
B)40.974 million
C)41.739 million
D)52.470 million
A)45.626 million
B)40.974 million
C)41.739 million
D)52.470 million
Unlock Deck
Unlock for access to all 204 flashcards in this deck.
Unlock Deck
k this deck
72
Which could be a possible formula for the following figure? Assume a and b are positive constants.
A)
B)
C)
D)
A)
B)
C)
D)
Unlock Deck
Unlock for access to all 204 flashcards in this deck.
Unlock Deck
k this deck
73
Which could be a possible formula for the following figure? Assume a and b are positive constants.
A)
B)
C)
D)
A)
B)
C)
D)
Unlock Deck
Unlock for access to all 204 flashcards in this deck.
Unlock Deck
k this deck
74
Using the table, find the value of a if f is linear.
Unlock Deck
Unlock for access to all 204 flashcards in this deck.
Unlock Deck
k this deck
75
The following tables shows values for two functions. Which one could be exponential?
A)
B)
A)
B)
Unlock Deck
Unlock for access to all 204 flashcards in this deck.
Unlock Deck
k this deck
76
Which could be a possible formula for the following figure? Assume a and b are positive constants.
A)
B)
C)
D)
A)
B)
C)
D)
Unlock Deck
Unlock for access to all 204 flashcards in this deck.
Unlock Deck
k this deck
77
Solve for both a and k. Round to 3 decimal places.
a=_____ k=_____
for both a and k. Round to 3 decimal places.a=_____ k=_____
Unlock Deck
Unlock for access to all 204 flashcards in this deck.
Unlock Deck
k this deck
78
Solve for t. Round to 3 decimal places.
for t. Round to 3 decimal places. Unlock Deck
Unlock for access to all 204 flashcards in this deck.
Unlock Deck
k this deck
79
A substance has a half-life of 56 years. What percent of the original amount of the substance will remain after 20 years? Round to the nearest percent.
Unlock Deck
Unlock for access to all 204 flashcards in this deck.
Unlock Deck
k this deck
80
Does represent exponential growth or decay?
represent exponential growth or decay? Unlock Deck
Unlock for access to all 204 flashcards in this deck.
Unlock Deck
k this deck
Unlock Deck
Unlock for access to all 204 flashcards in this deck.


